Web analytics
Web analytics, explained simply — what the numbers mean, how to set up tracking that answers real questions, and how analytics works on the platforms you build with.
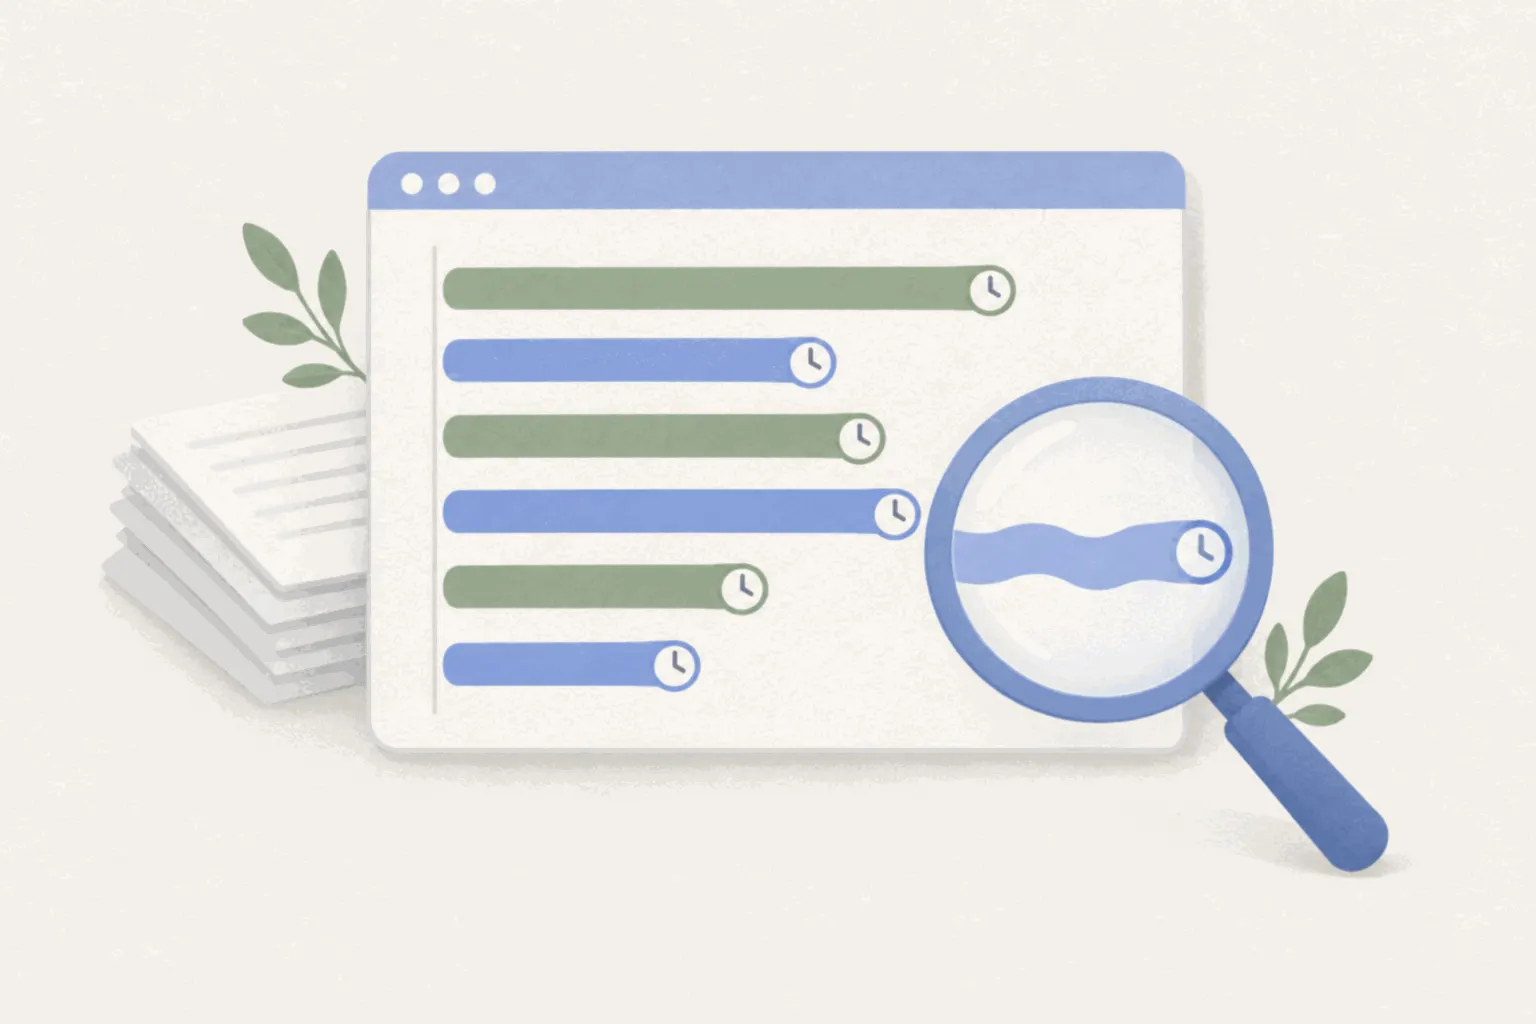
Average session duration benchmarks: what the disclosed data says
Most session duration tables online descend from one agency's 2022 client data with no metric attached. Here is what the sources that disclose their methodology actually report, why they disagree by minutes, and the benchmark worth using instead.
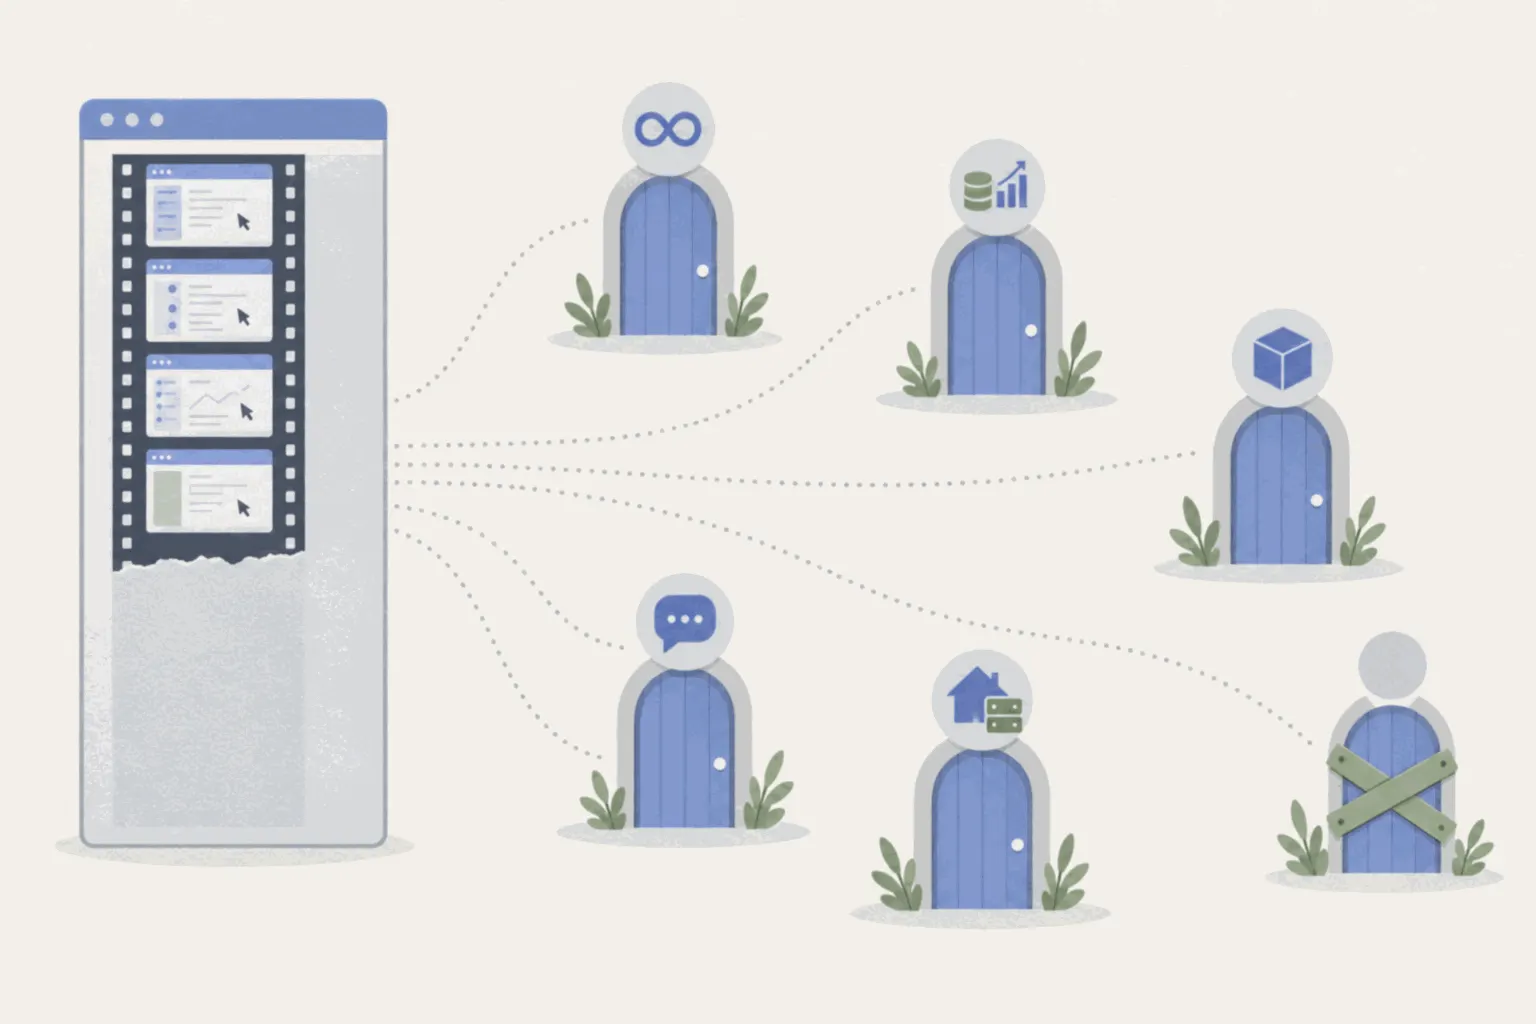
Mouseflow alternatives (2026)
Mouseflow records every session until the monthly quota runs out, then records nothing. Six alternatives matched to the reasons teams leave, plus the one name still on every list that you can no longer sign up for.
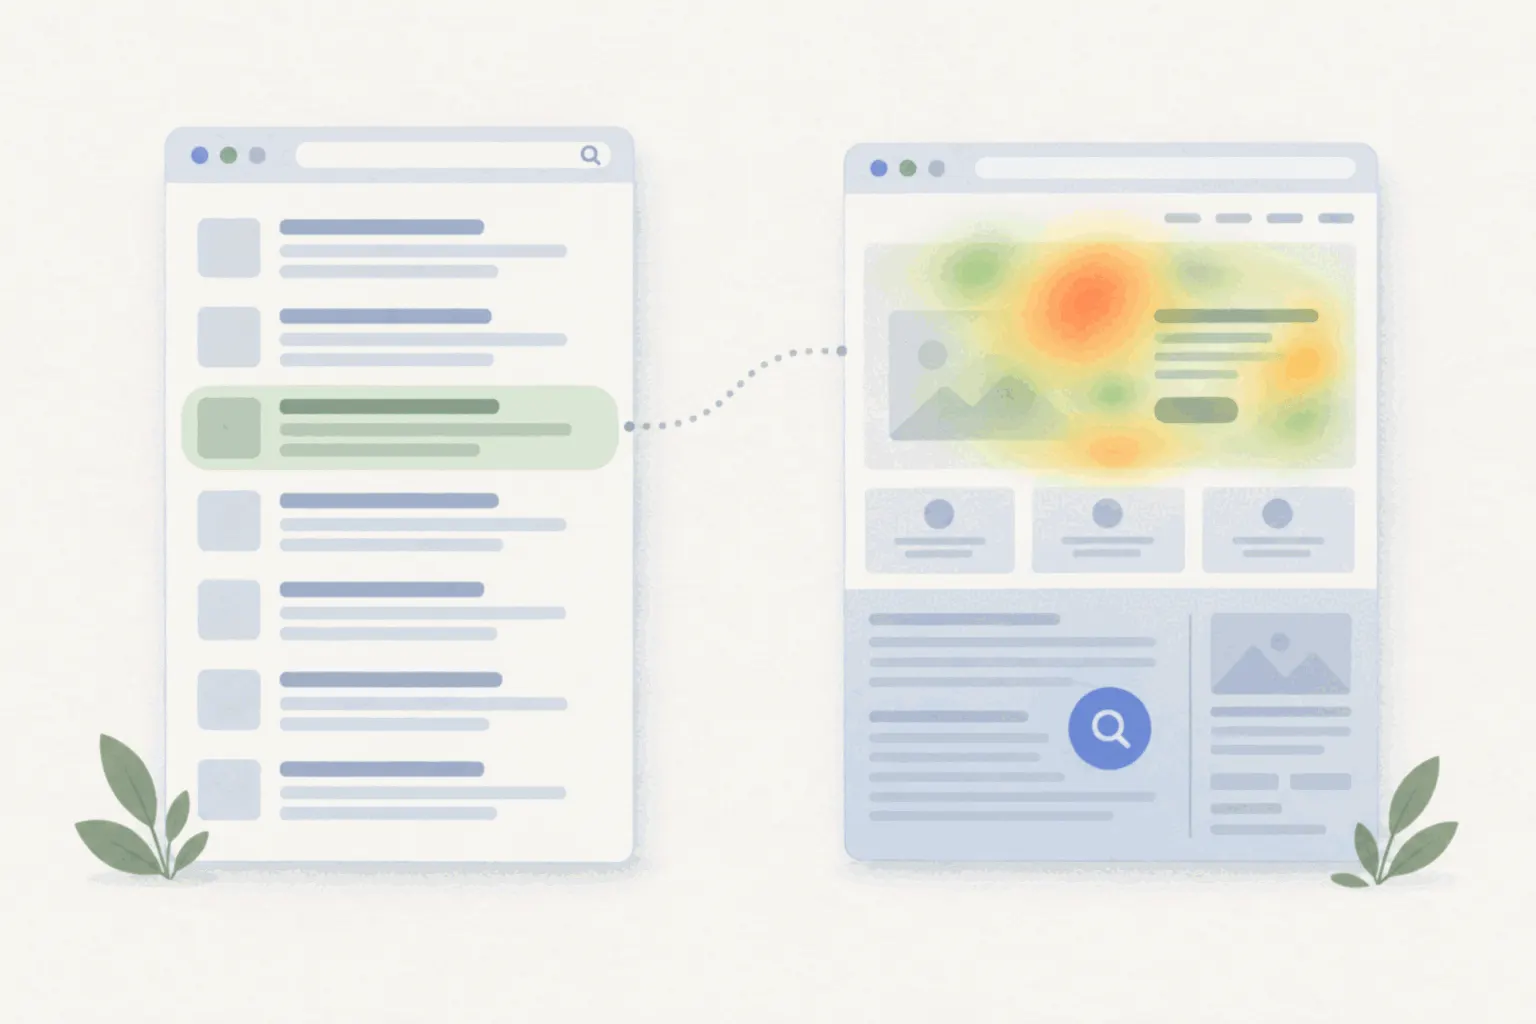
Heatmaps for SEO: what behaviour data can and can't do for rankings
Google never sees your heatmap. What click and scroll maps are actually worth in SEO work: diagnosing pages that rank but produce nothing, testing content length against real readers, and finding the internal links nobody clicks.
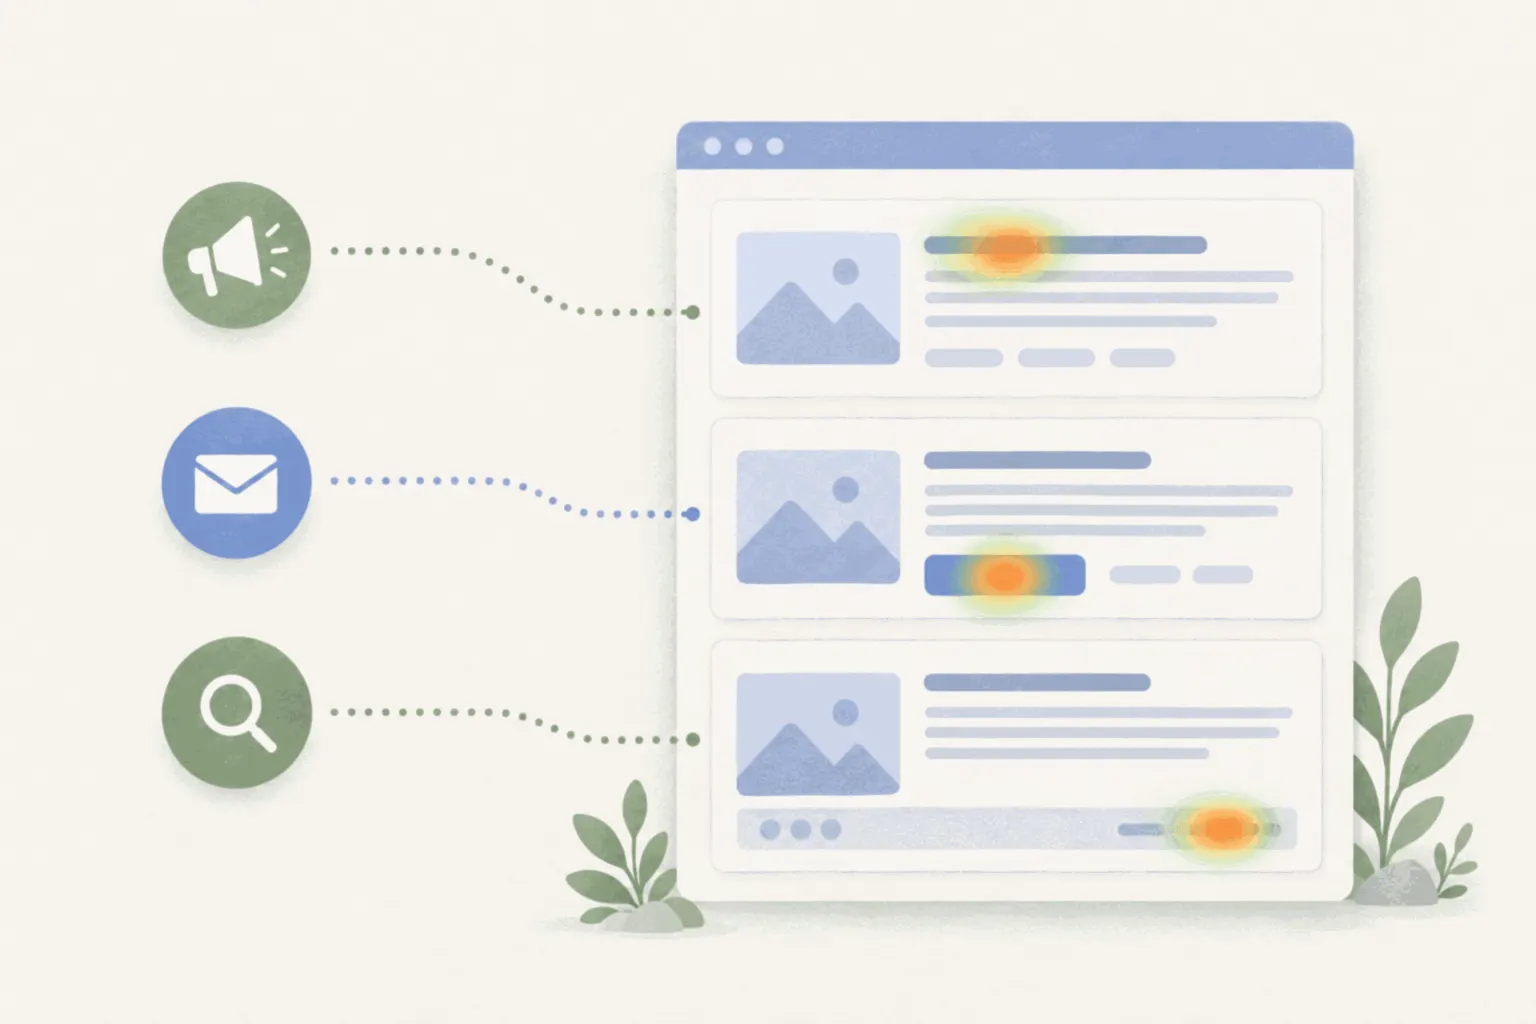
Heatmaps for marketers: what campaign traffic does on the page
Analytics says which campaign brought visitors and whether they converted. The heatmap covers the page in between: where paid traffic clicked, how far it read, and what it walked past.
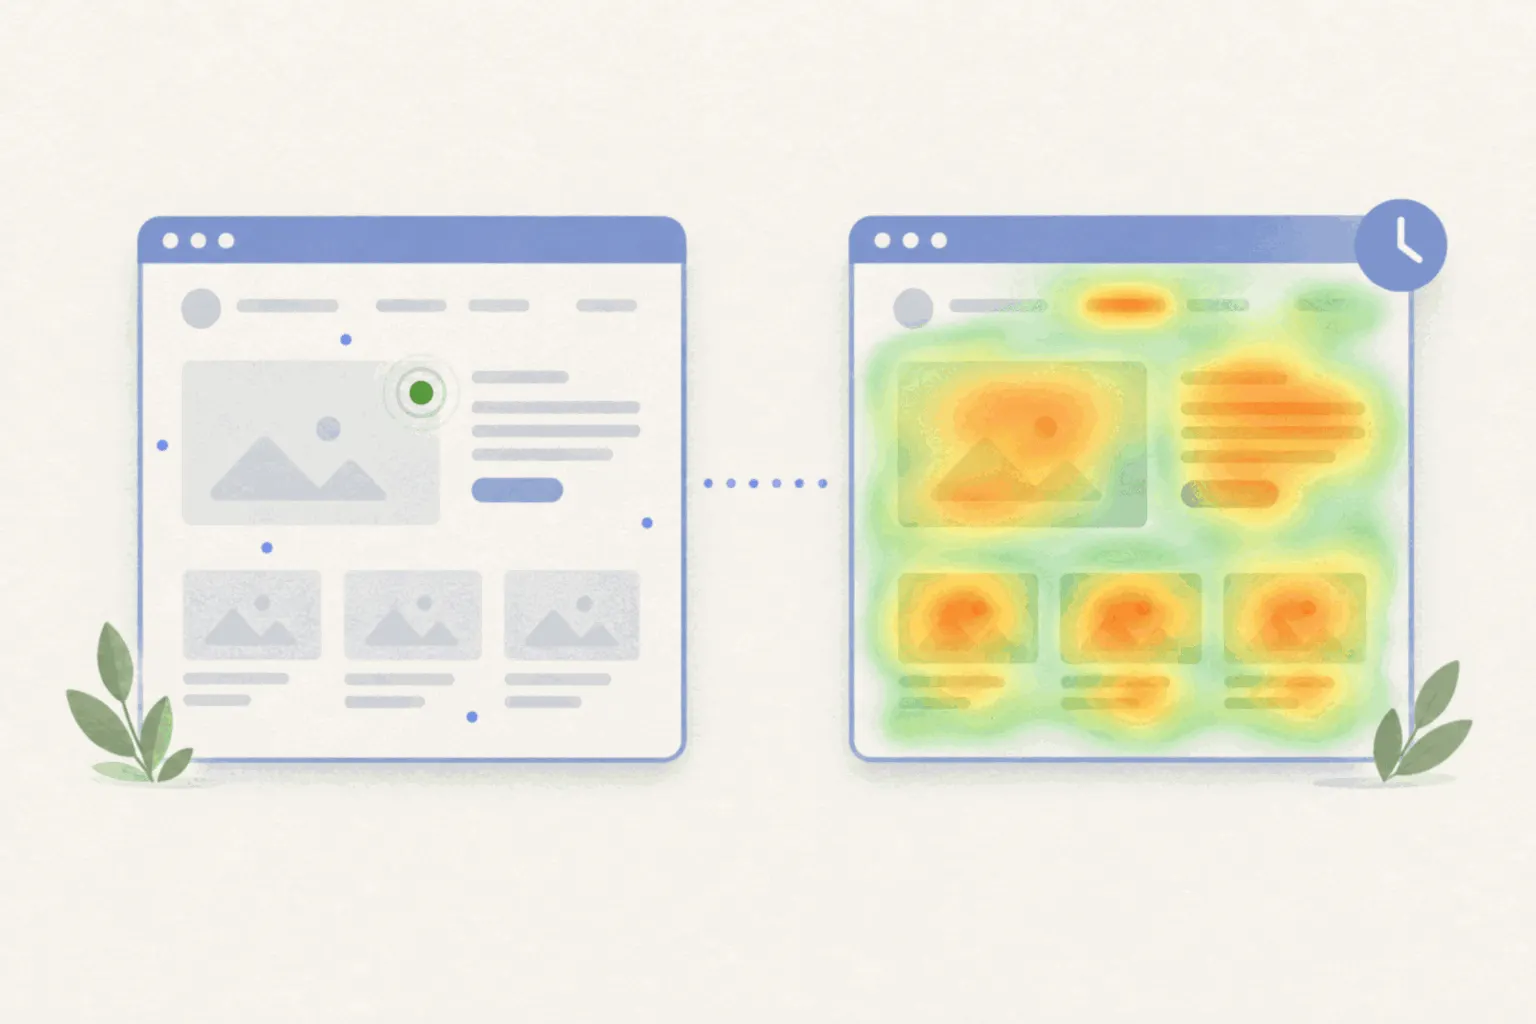
What is a real-time heatmap?
Tools sell heatmaps as live, then update them on a delay they rarely print. What real-time actually means for an aggregate map, the launch-day cases where freshness earns its keep, and why a full map beats a fresh one.
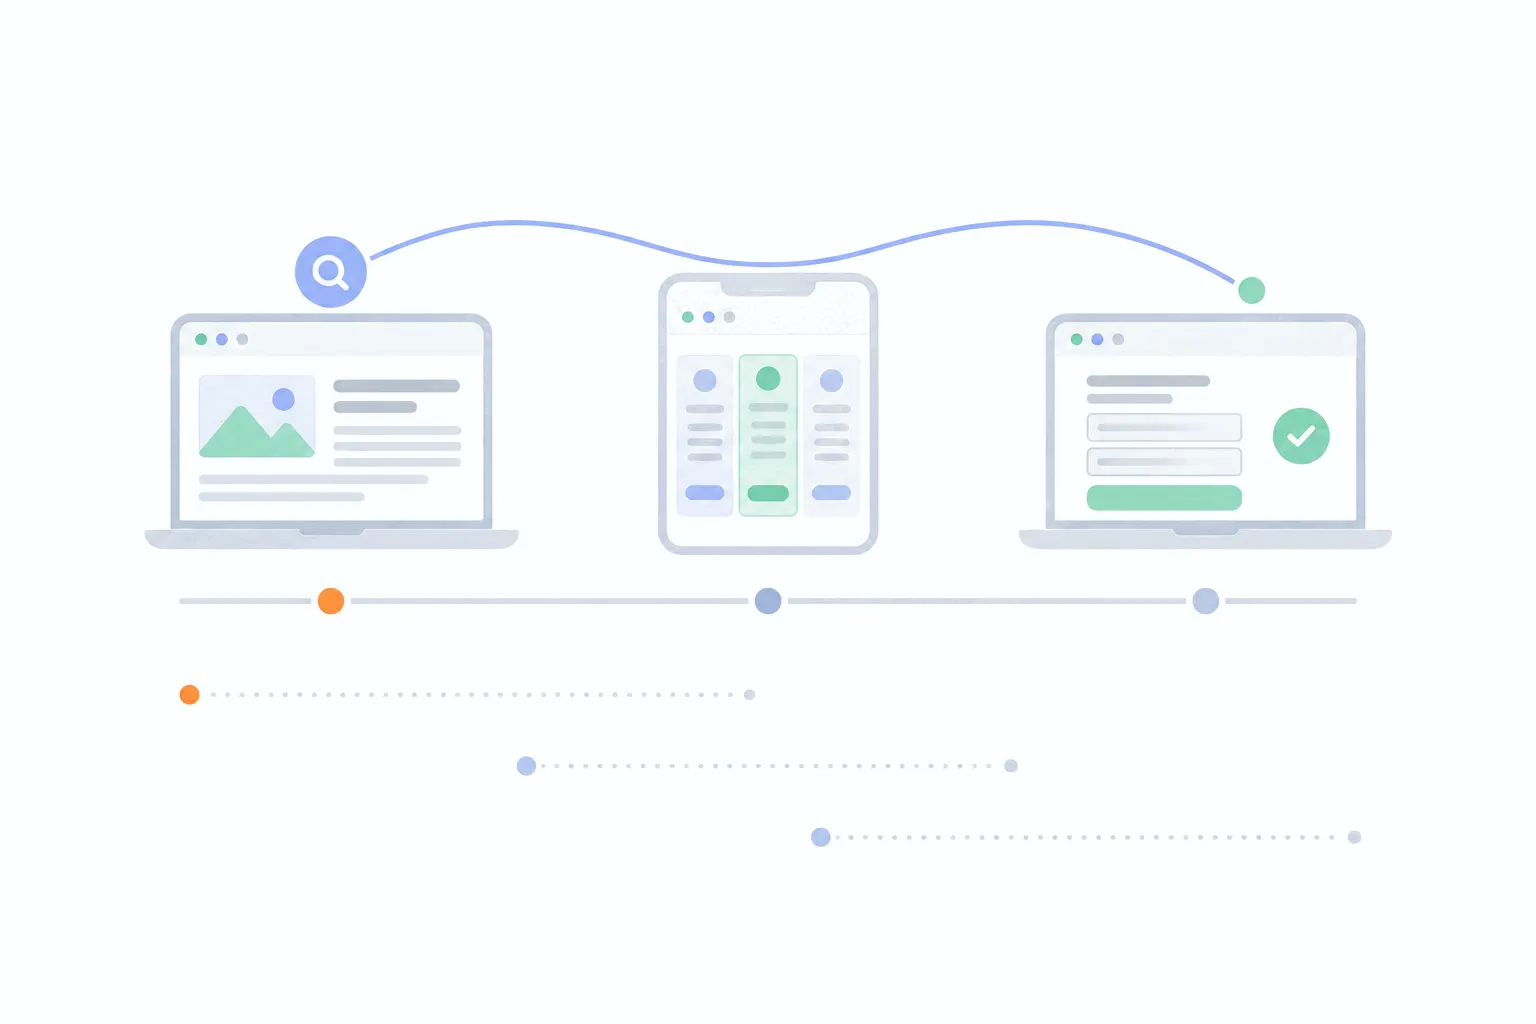
User journey analysis: following visitors across visits
User journey analysis connects one person's visits into a single path from first touch to purchase. What it shows, where identity limits stitching, and how to read journeys backwards from the conversion.
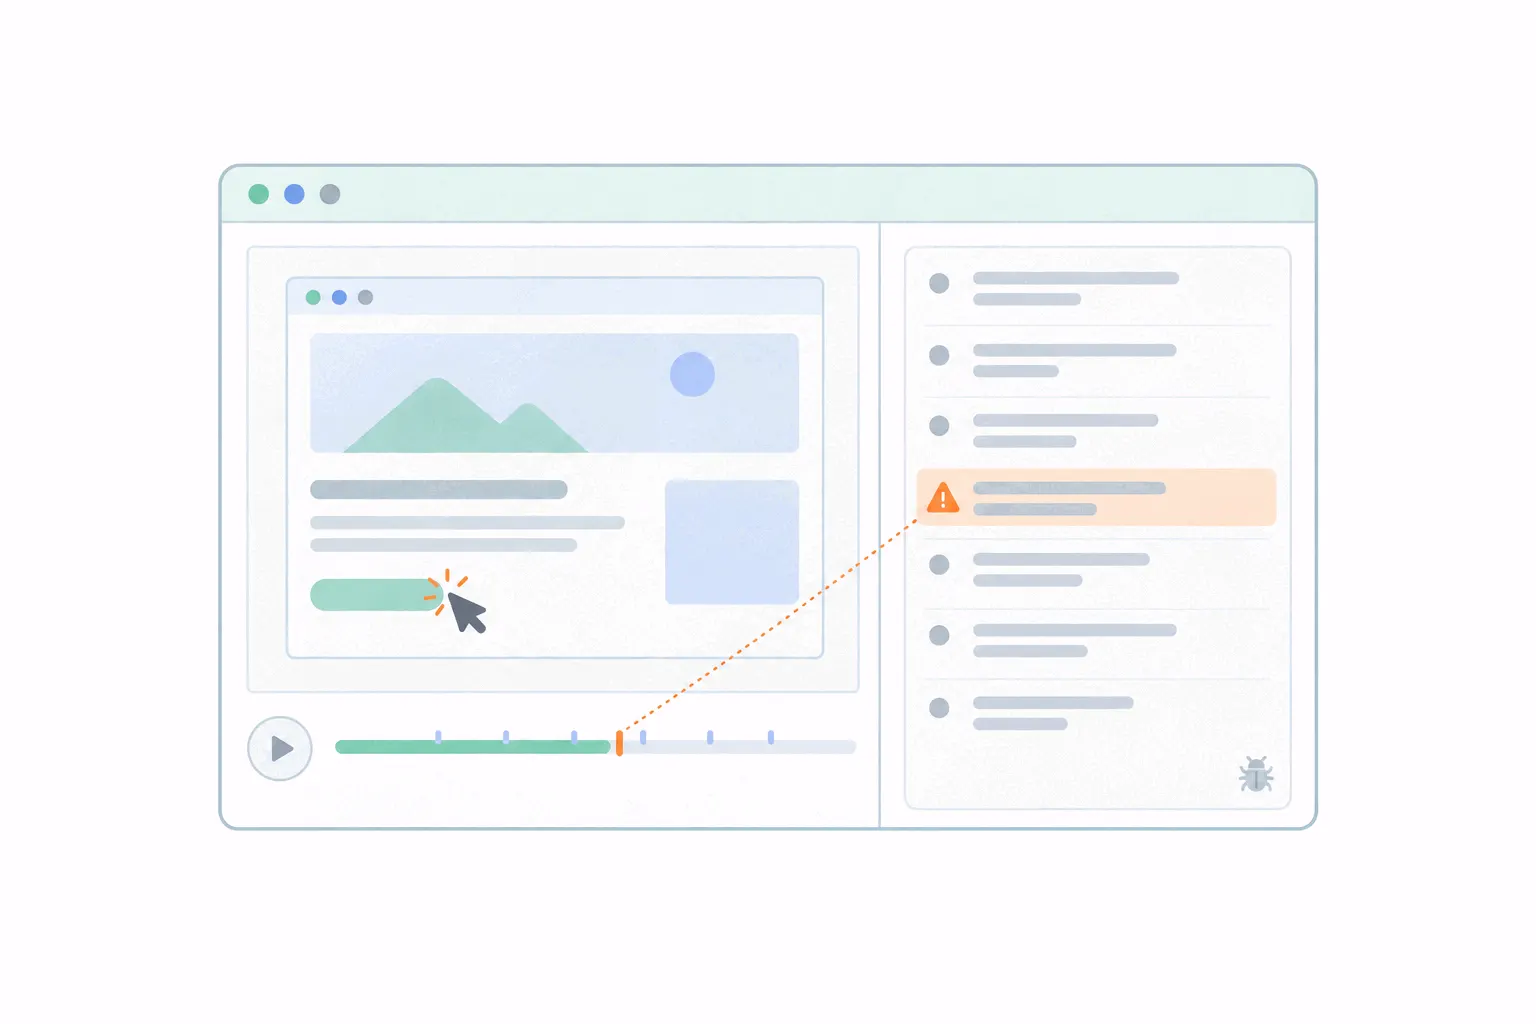
Session replay for debugging: reproducing what the user saw
A bug report names the failure without the steps that produced it. How replays with console and network context turn cannot-reproduce tickets into watchable reproductions.
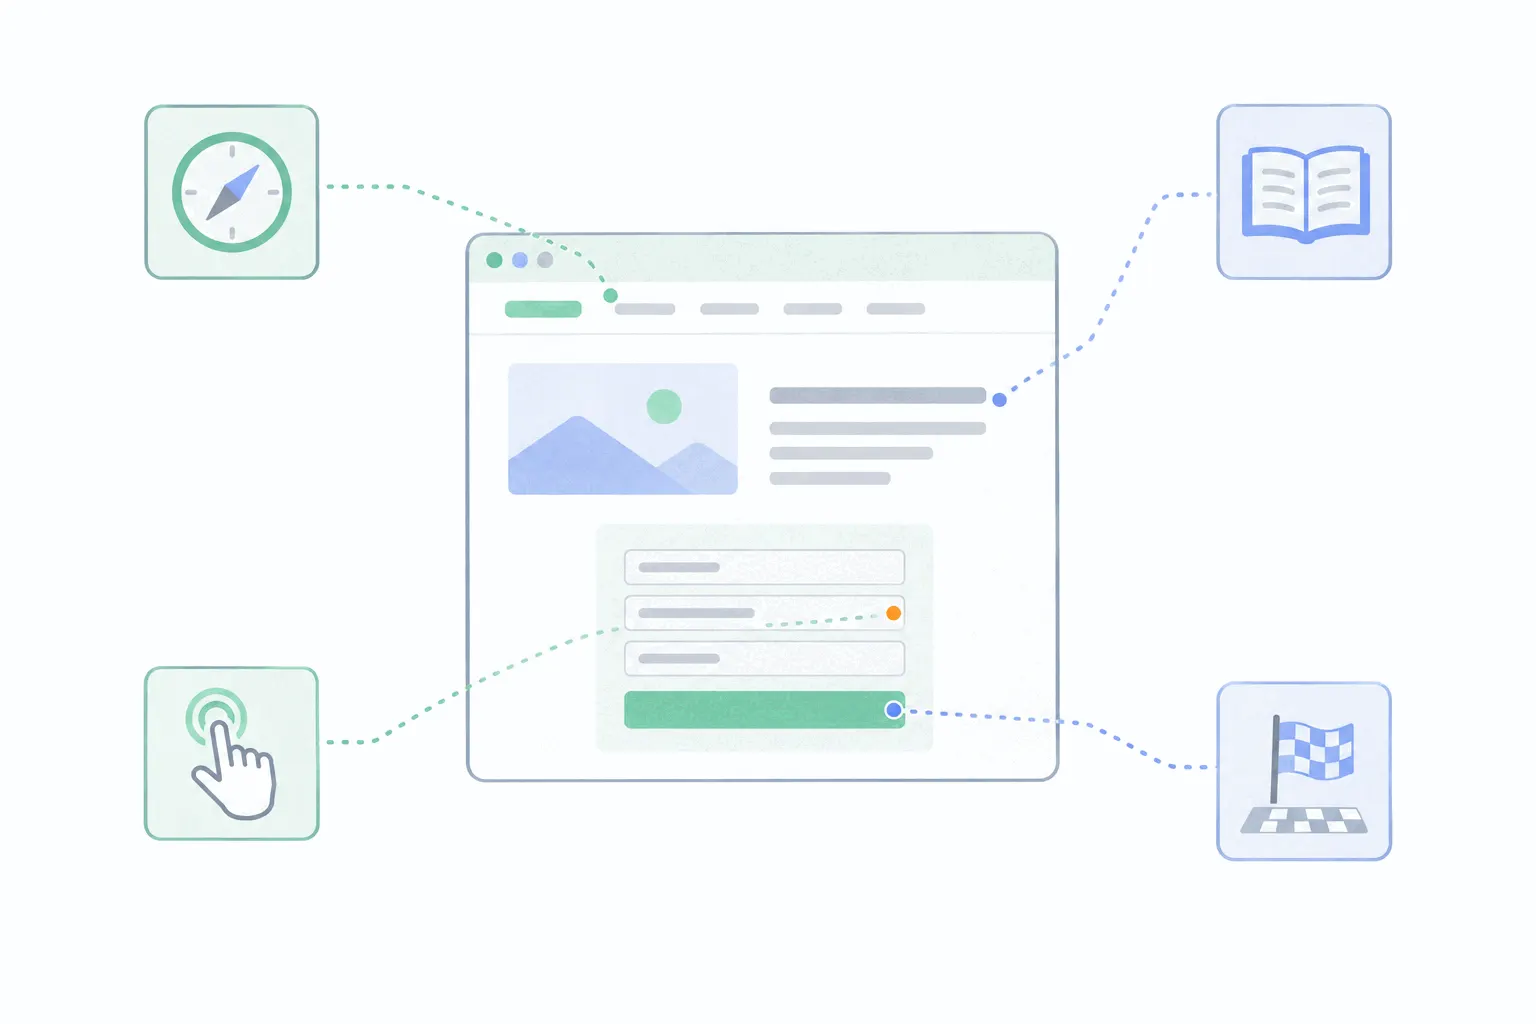
What is UX analytics?
UX analytics is the practice of measuring how real people experience an interface. The four design questions it answers, the metrics worth a dashboard, and the loop that turns numbers into design decisions.
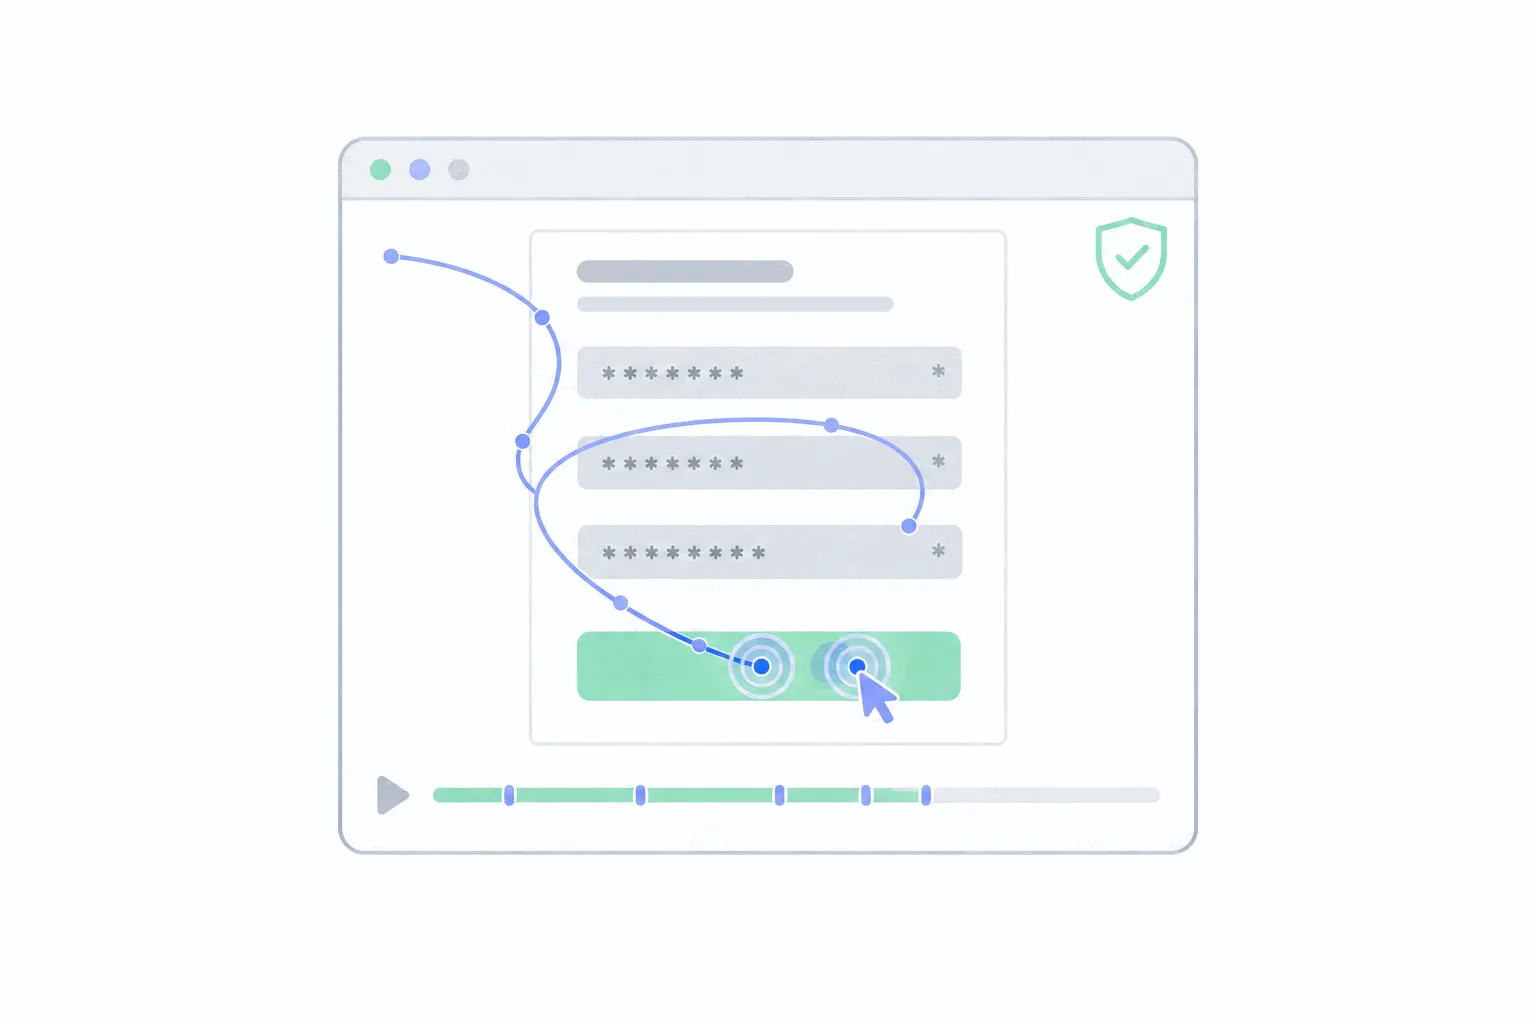
Session replay masking: what gets hidden and how
Masking replaces sensitive content with placeholders before a recording leaves the visitor's browser. The three masking levels, what counts as personal data in a replay, and how to audit yours for leaks.
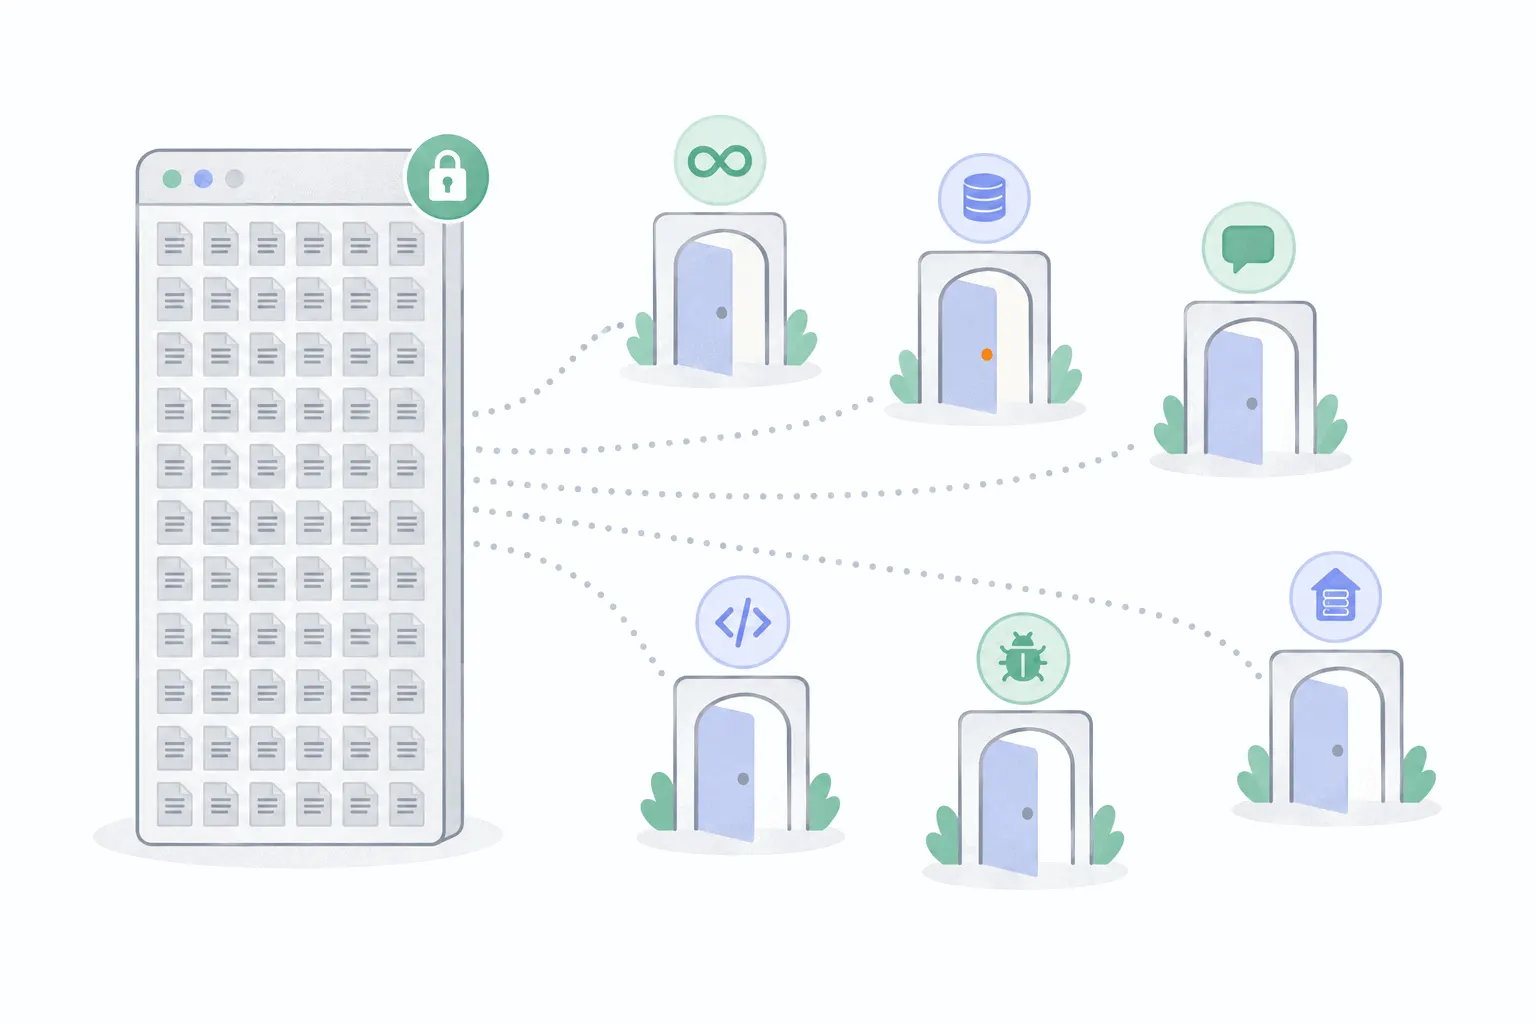
FullStory alternatives (2026)
FullStory records everything and answers questions after the fact, at enterprise depth and enterprise process. Six alternatives, each matched to a reason teams move on.

How to add heatmaps to a WordPress site
The two ways to get a heatmap onto a WordPress site, what the plugin directory actually offers, and the caching, page-builder and admin-visit gotchas that spoil first maps.
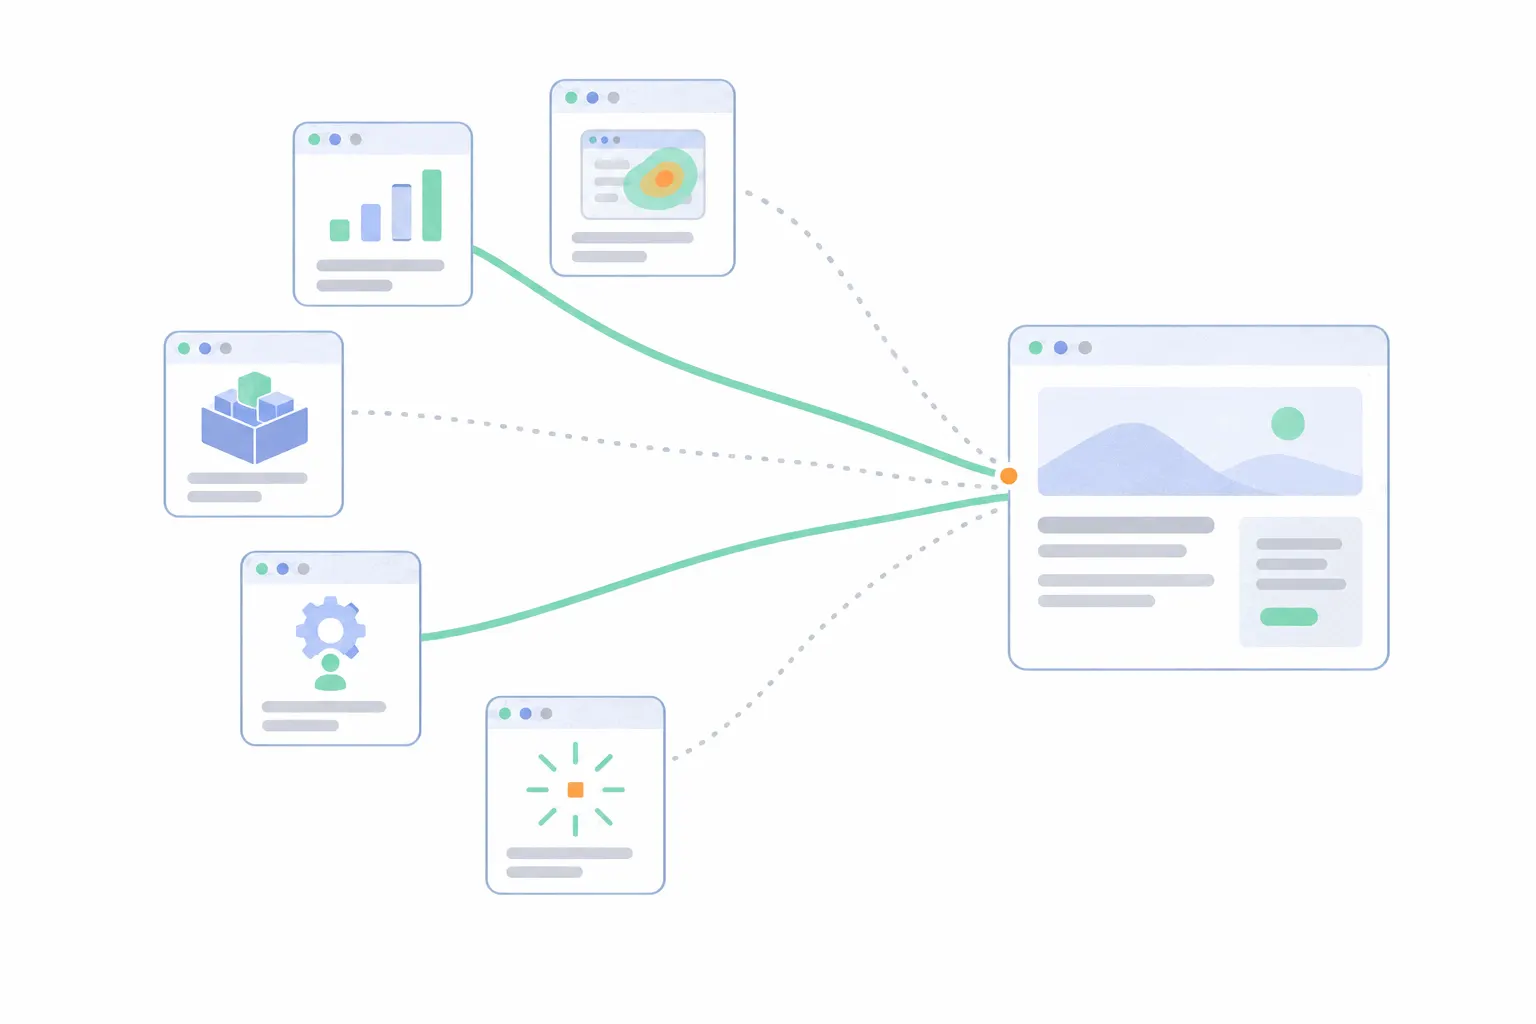
Website tracking tools: what each kind actually tracks
Tracking tools fall into five kinds that record different things. What analytics, heatmaps and replays, tag managers, product analytics and the specialised trackers each capture, and how few a site needs.
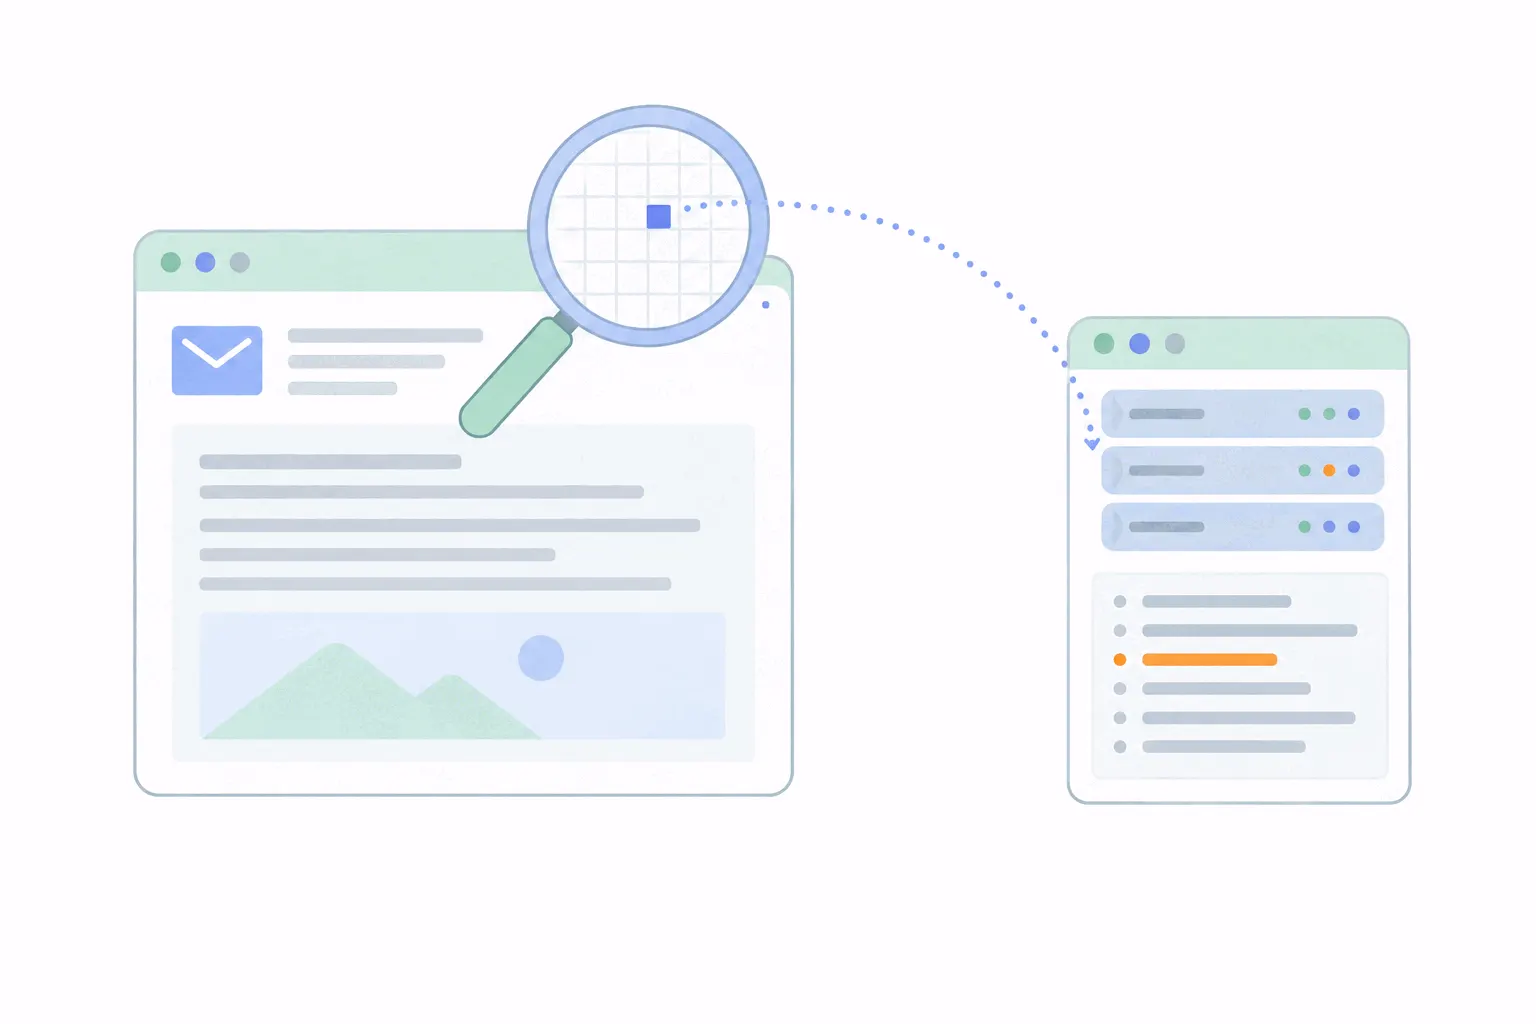
What is a tracking pixel?
An invisible one-pixel image whose loading tells a server an email was opened or a page was viewed. How pixels work, where they are used, and what blocking them changes.
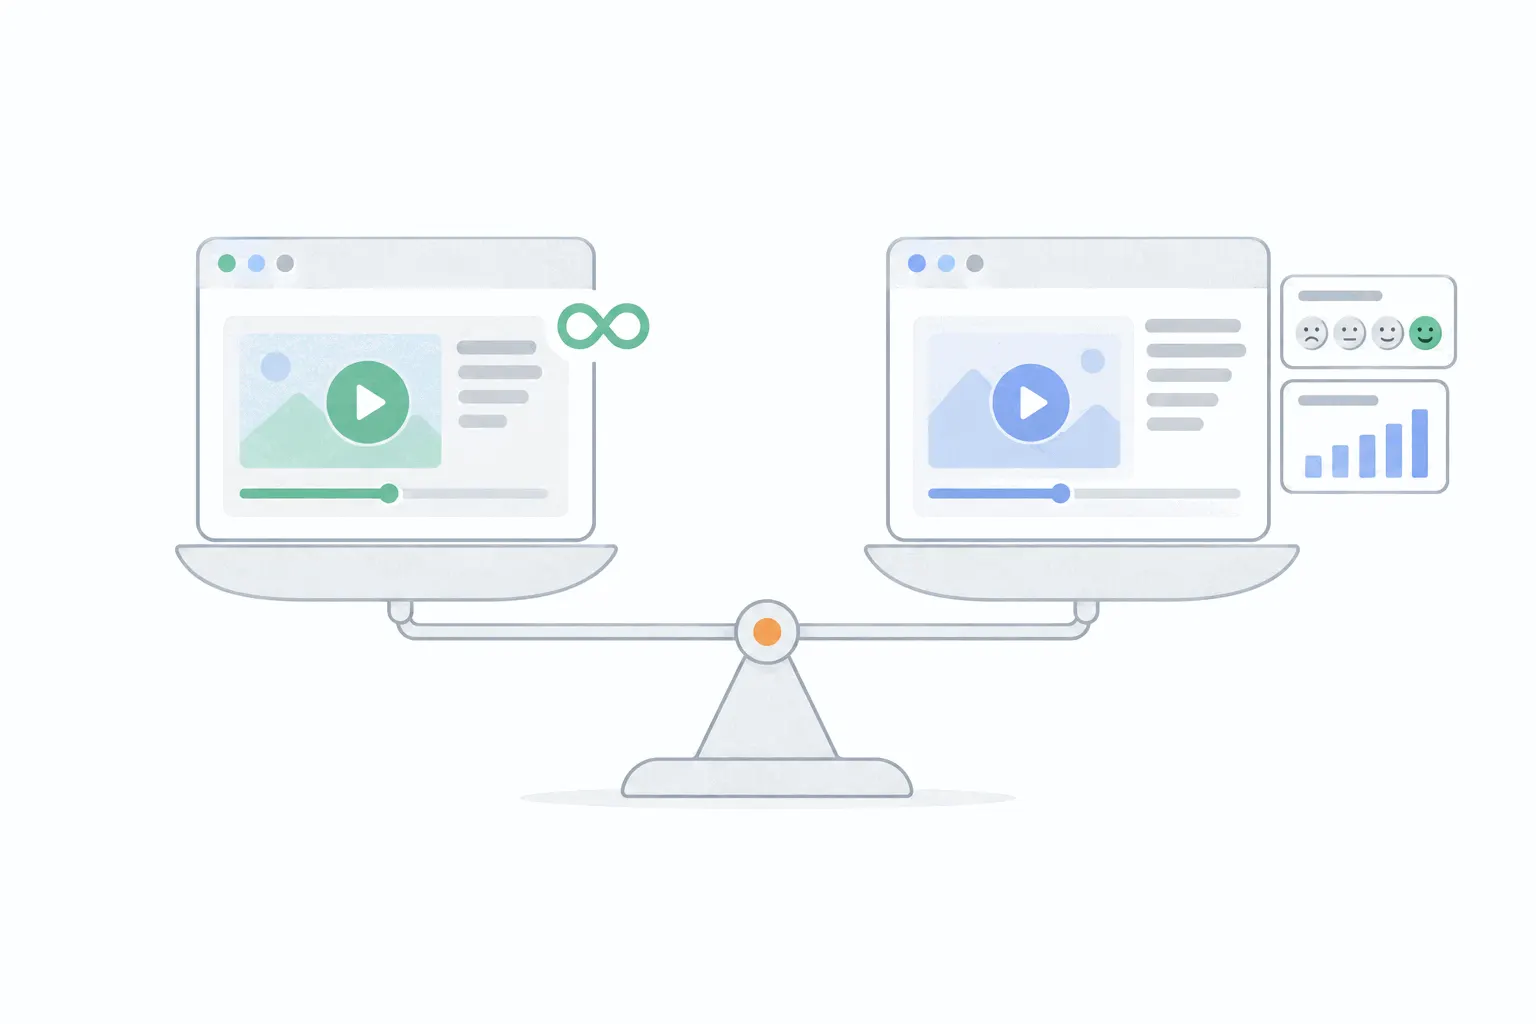
Microsoft Clarity vs Hotjar: which one to pick
Hotjar is now Contentsquare, which changes the old comparison. What each tool does today, where each one wins, the retention and consent limits, and how to choose.
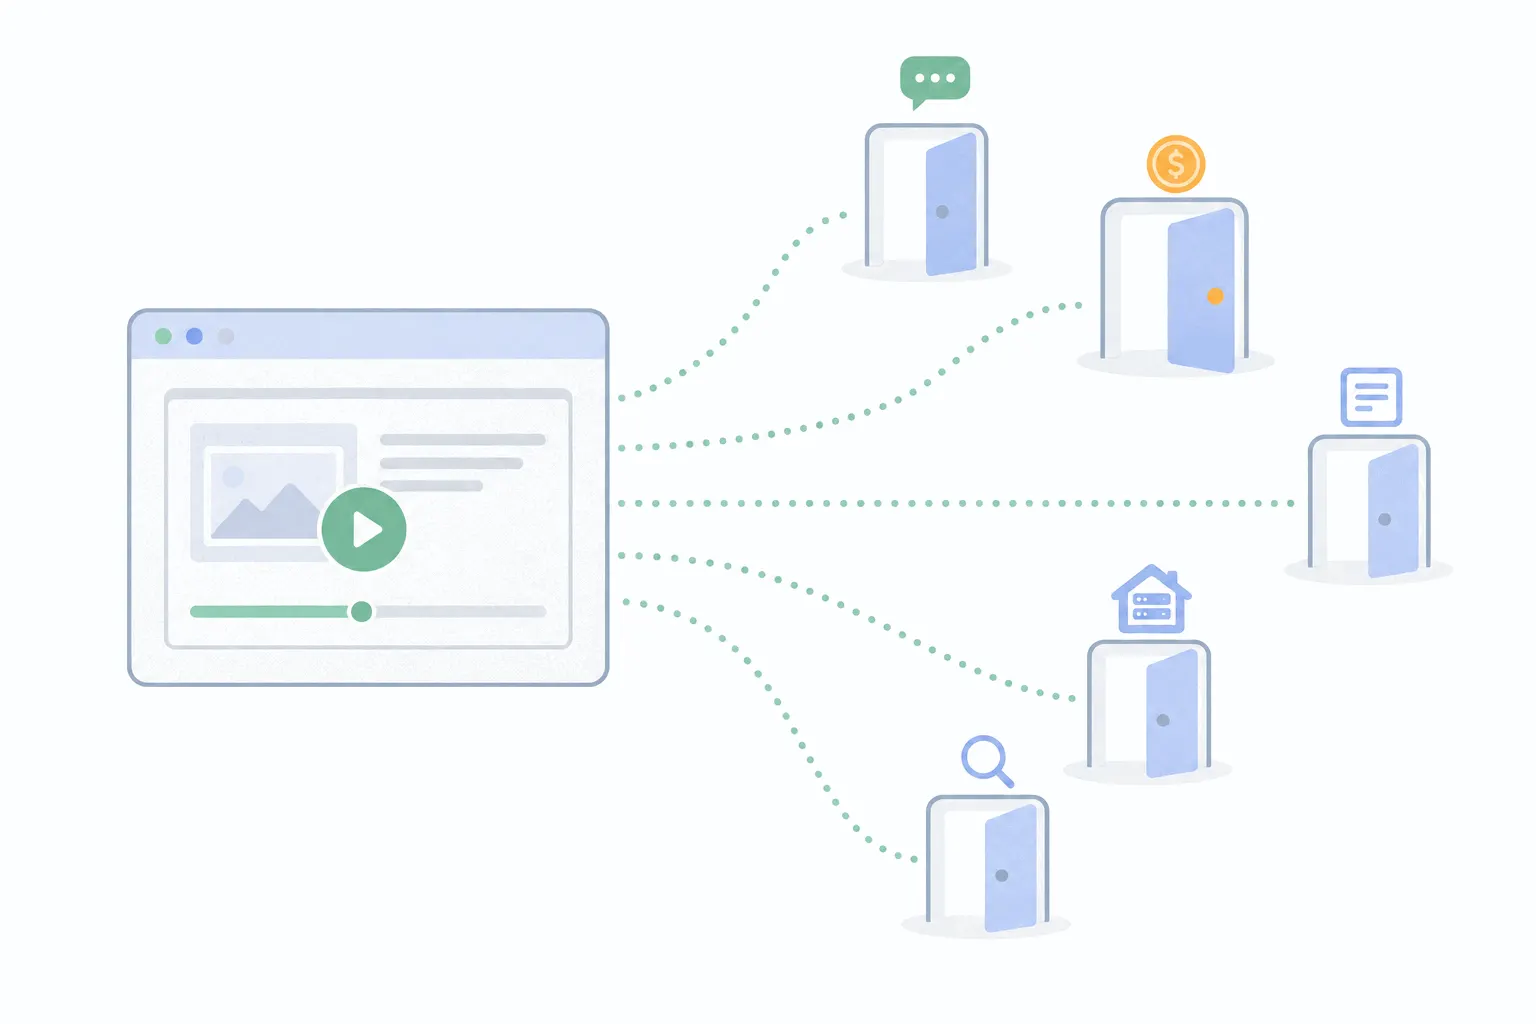
Microsoft Clarity alternatives (2026)
Clarity is free, so the reasons to switch are specific: 30-day retention, data that lives with Microsoft, and no surveys or revenue context. Five alternatives, each fixing one of them.
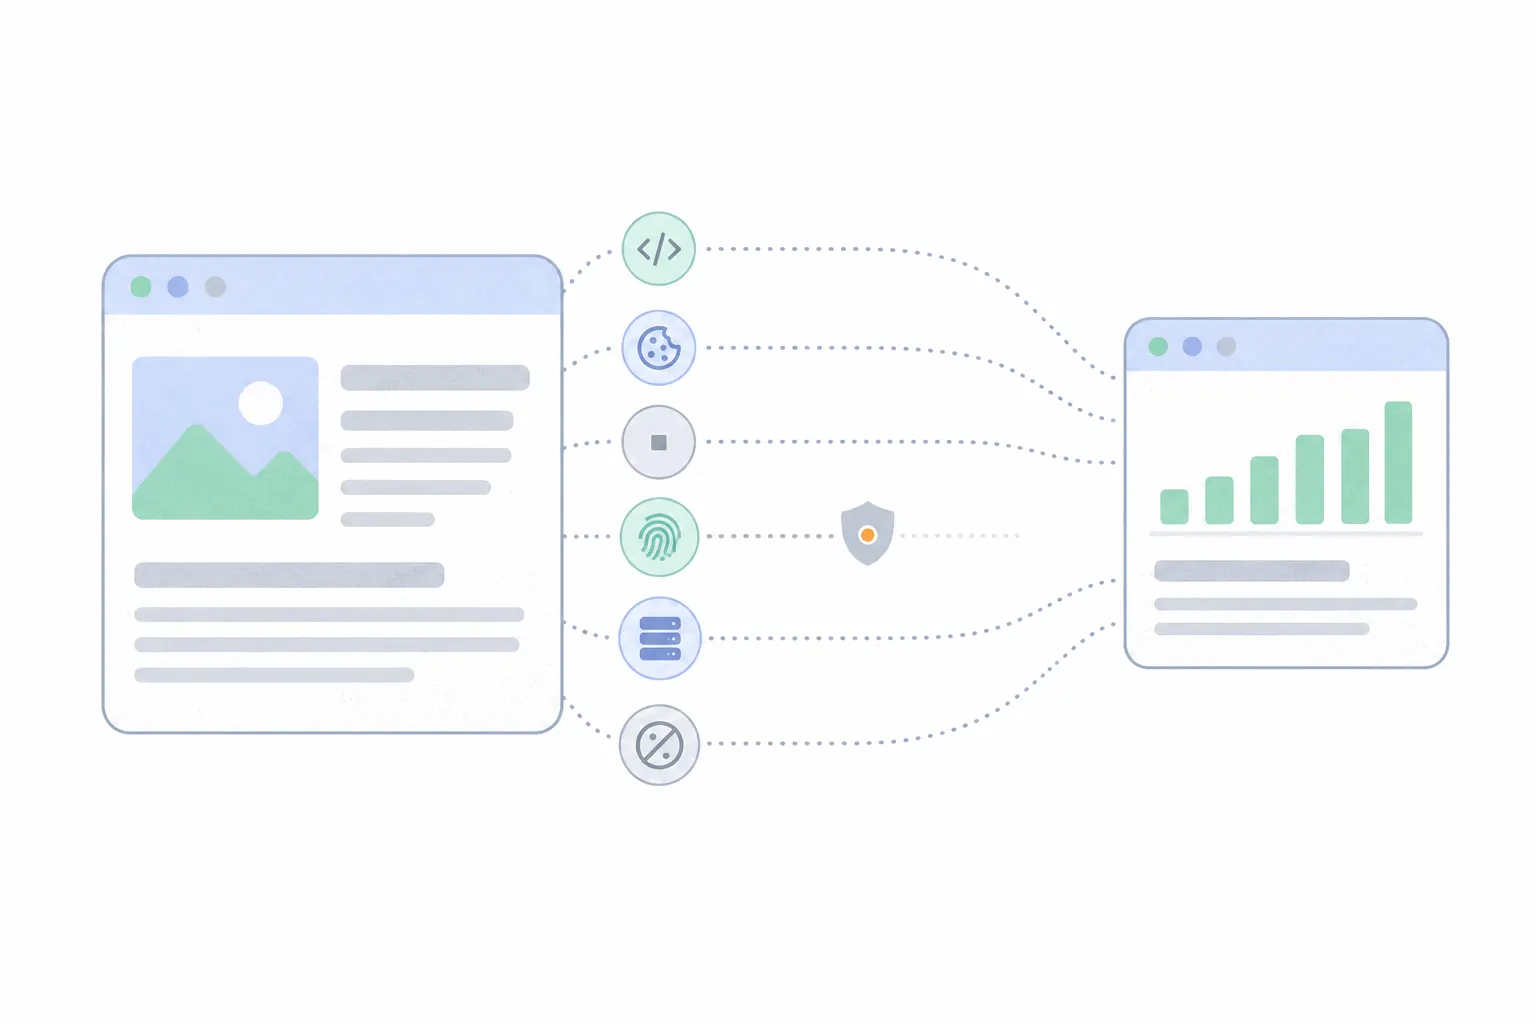
What is website tracking?
Tracking covers everything from a simple visit counter to cross-site ad profiles. The methods sites use, what each one can see about a visitor, and when consent is required.
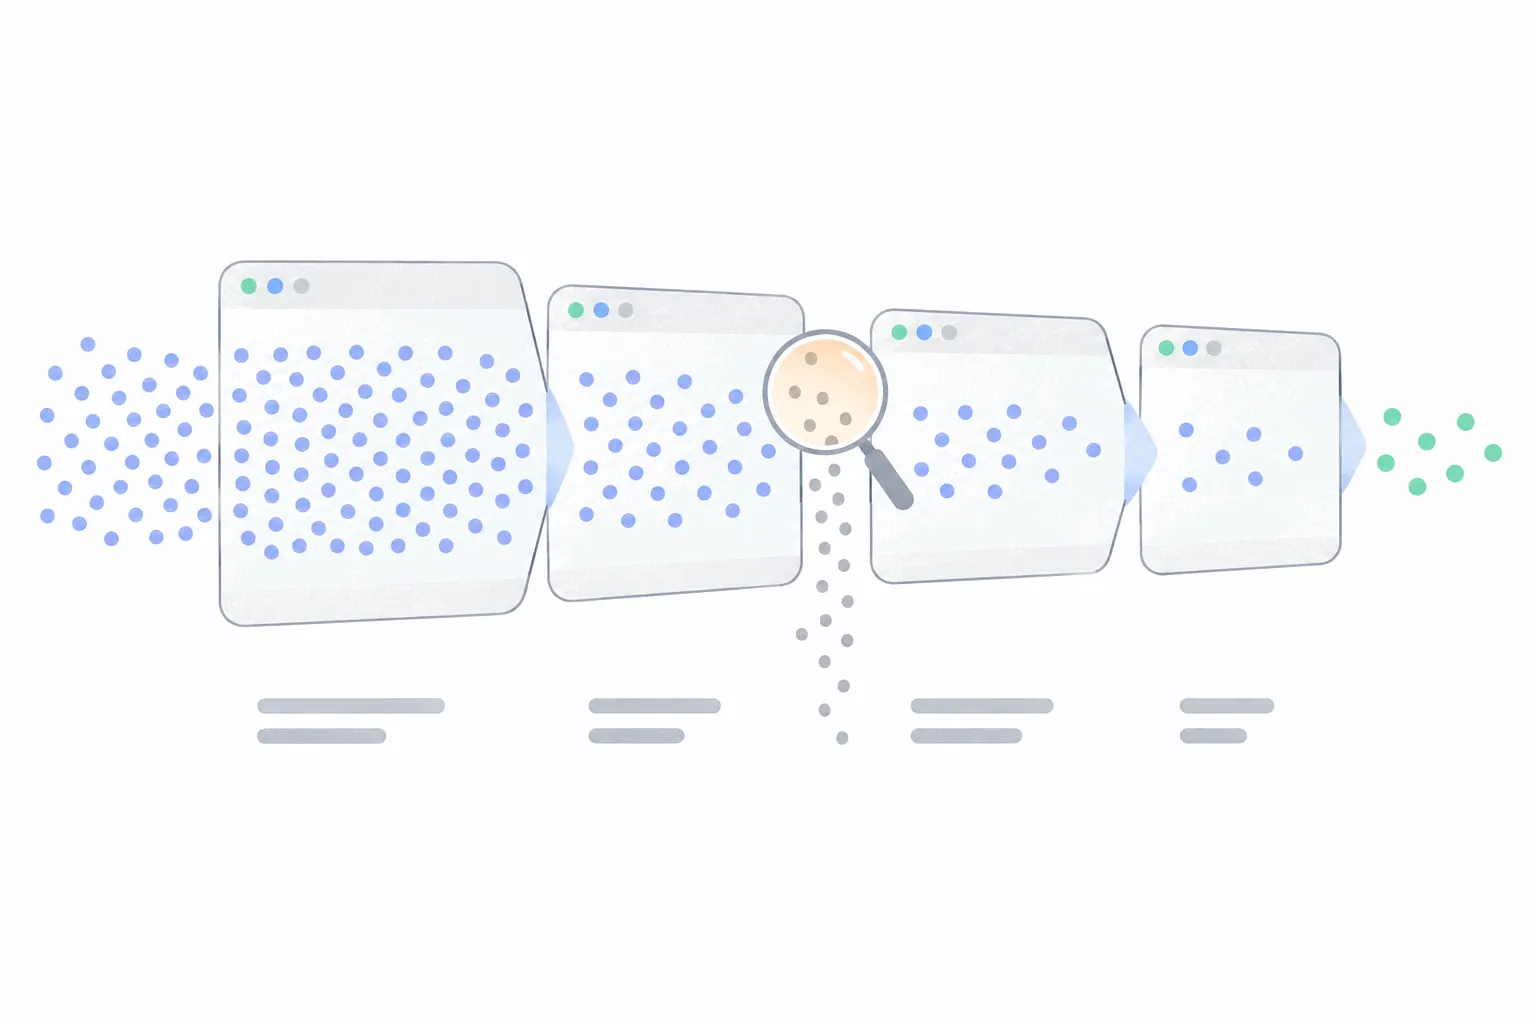
Funnel analysis: how to find and fix where visitors drop off
The method for measuring a multi-step journey: defining the steps, reading the drop-offs, segmenting before concluding, and deciding which leak to fix first.
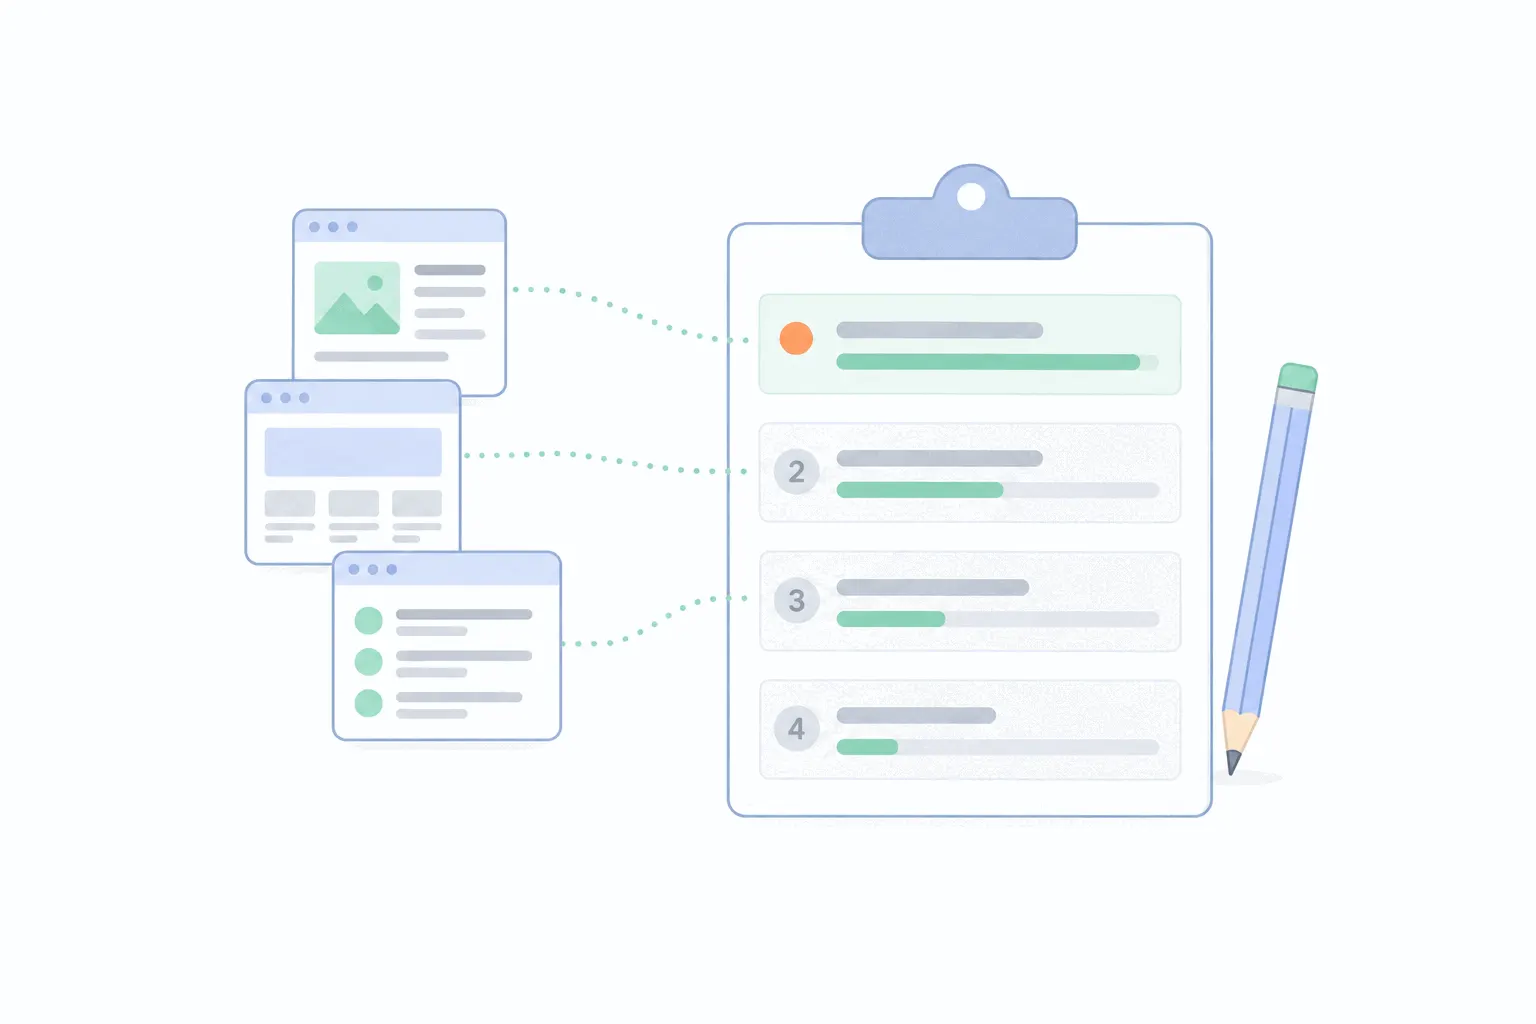
How to do a conversion analysis of your website
A structured review of how well a site turns visitors into customers: setting a baseline, finding the pages and audiences that convert worst, and ranking fixes by the conversions they would add.
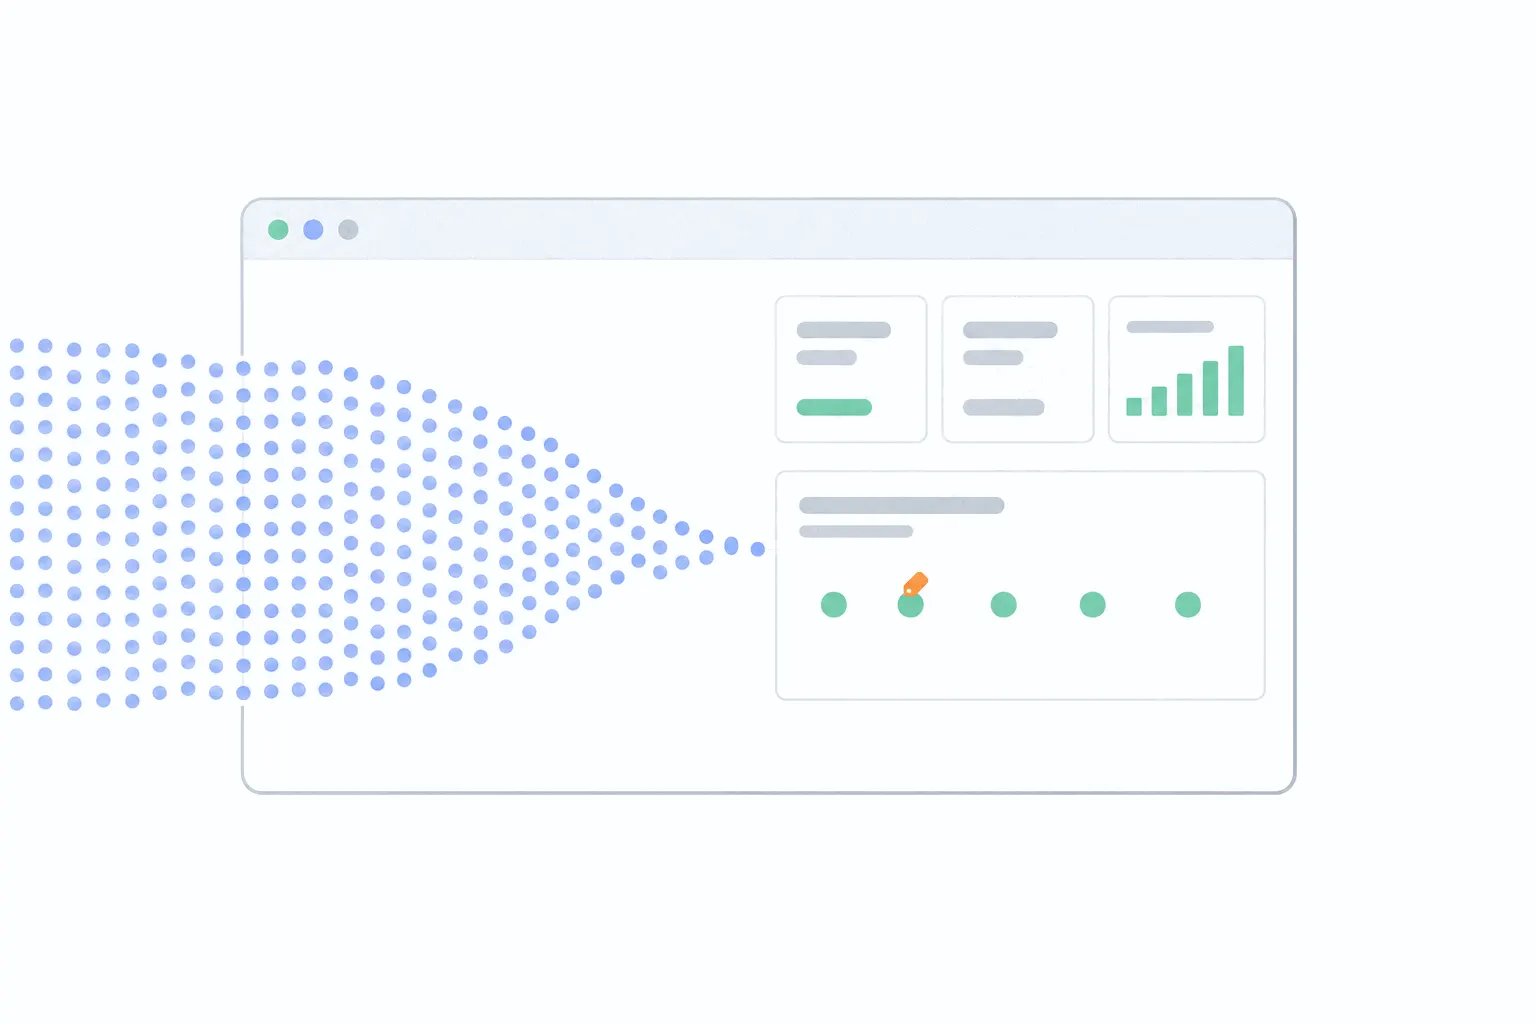
What is conversion analytics?
Conversion analytics measures whether visits turn into signups, purchases and enquiries. What the core numbers mean, how the data is collected, and the undercounting to expect.
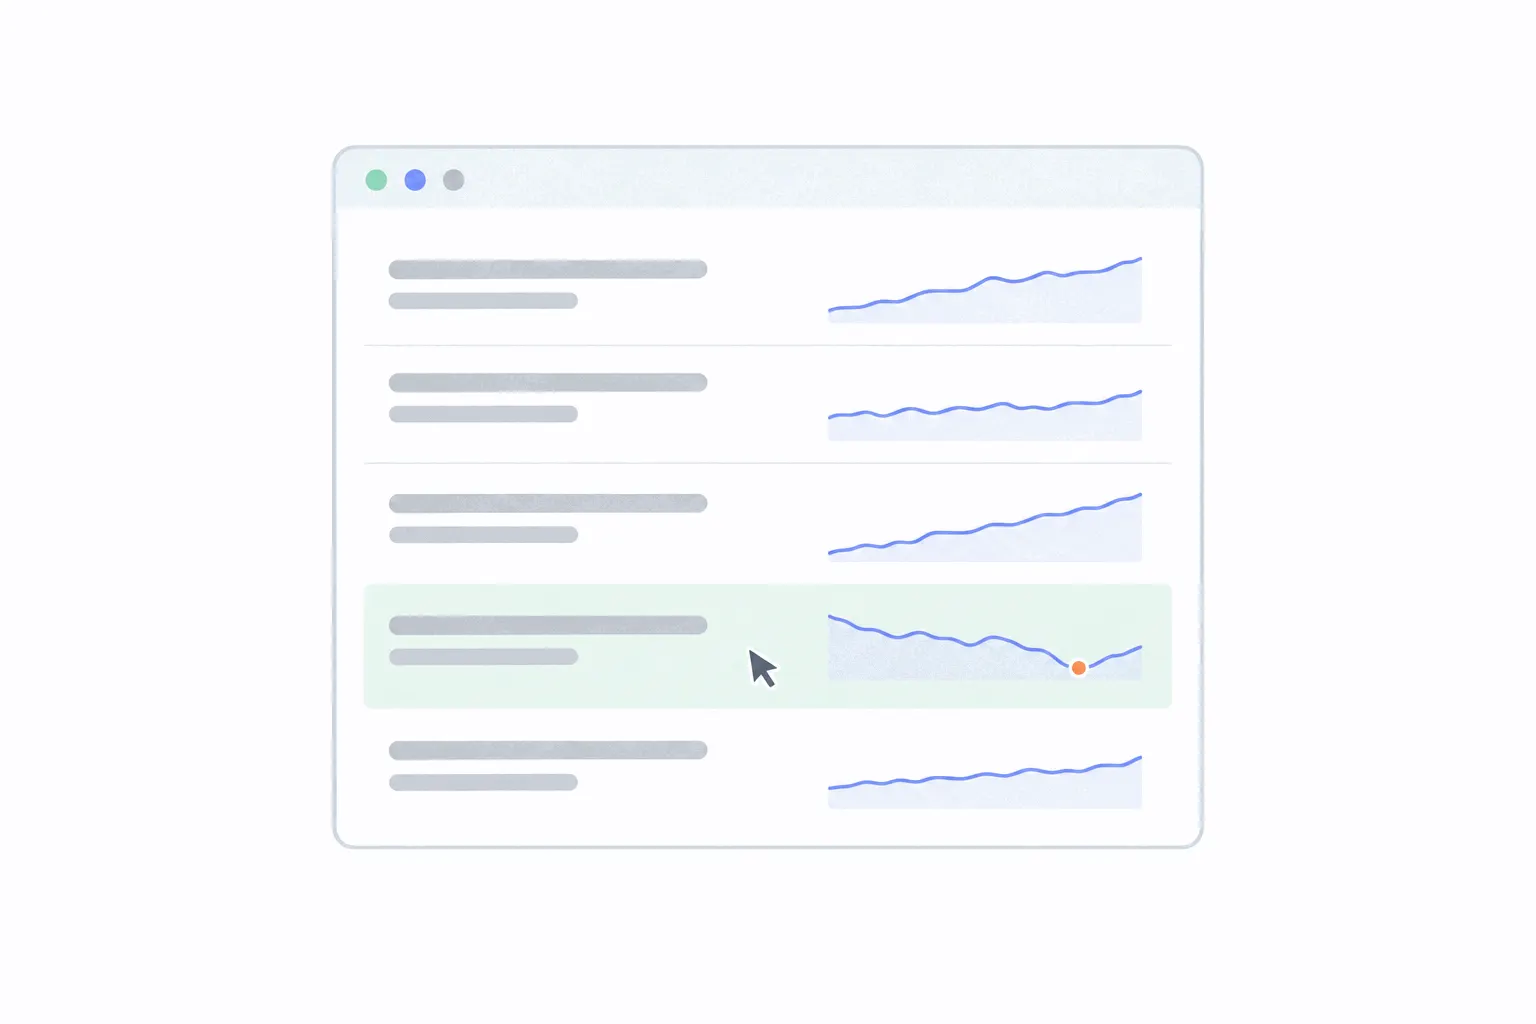
How to track page views on your site
One script counts page views on every ordinary site. The setup, the single-page-app exception, and which of the resulting numbers deserve attention.
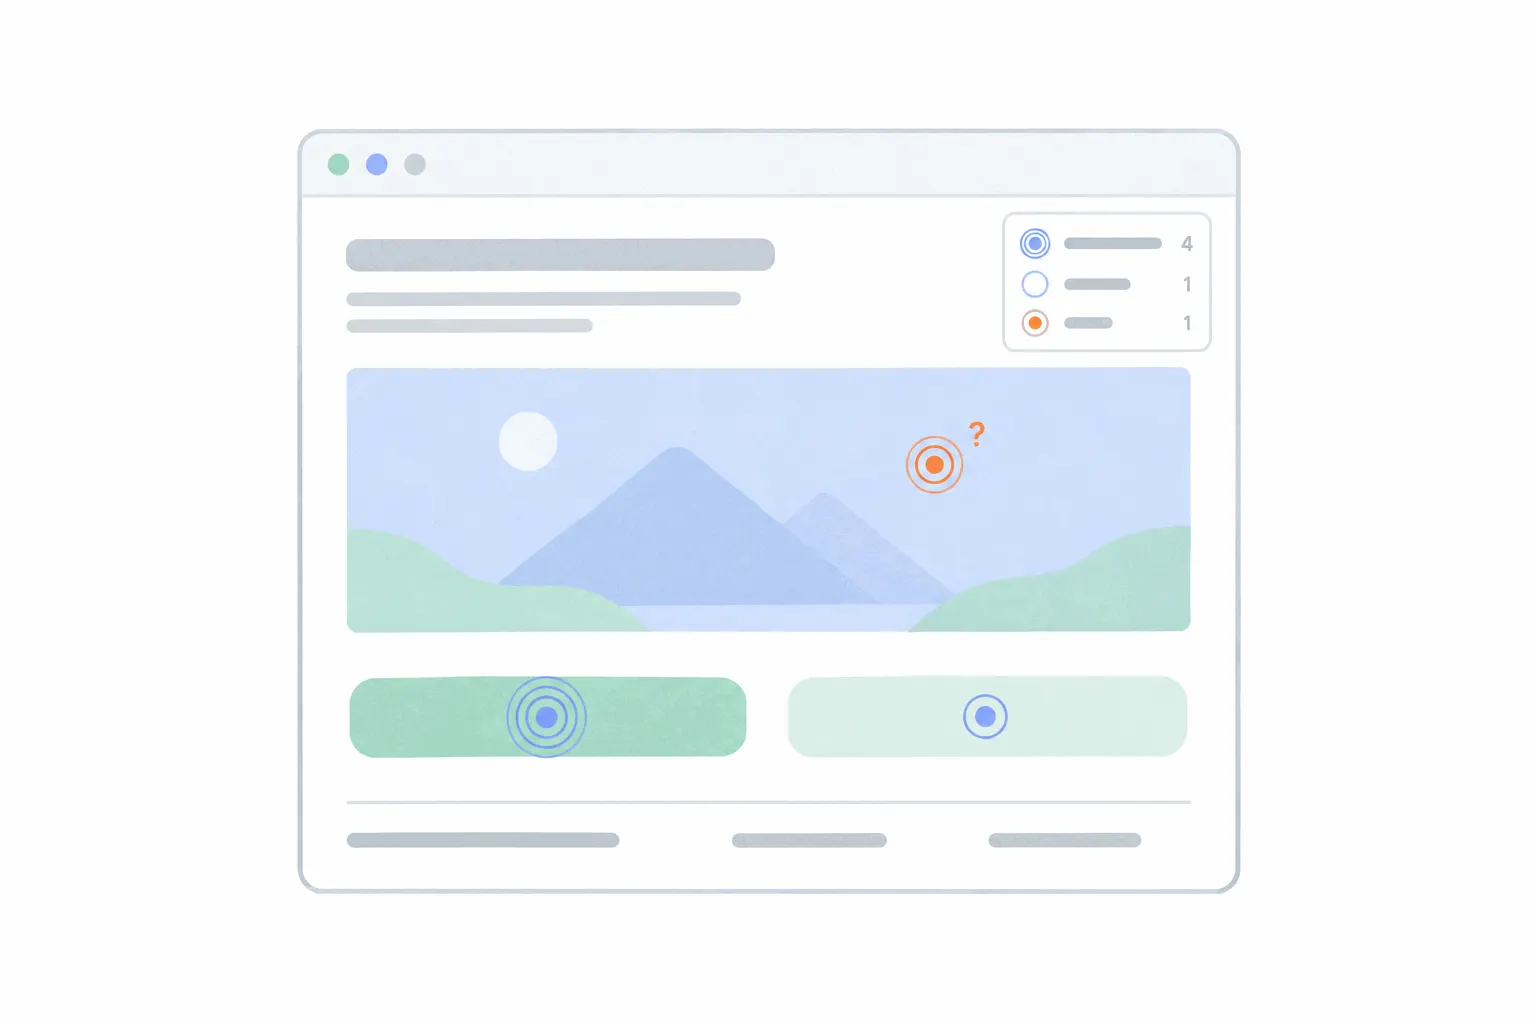
What is website click tracking?
Click tracking records where visitors click and tap on a site. The three forms it takes, what the data can tell you, and how to set it up without tagging every button by hand.
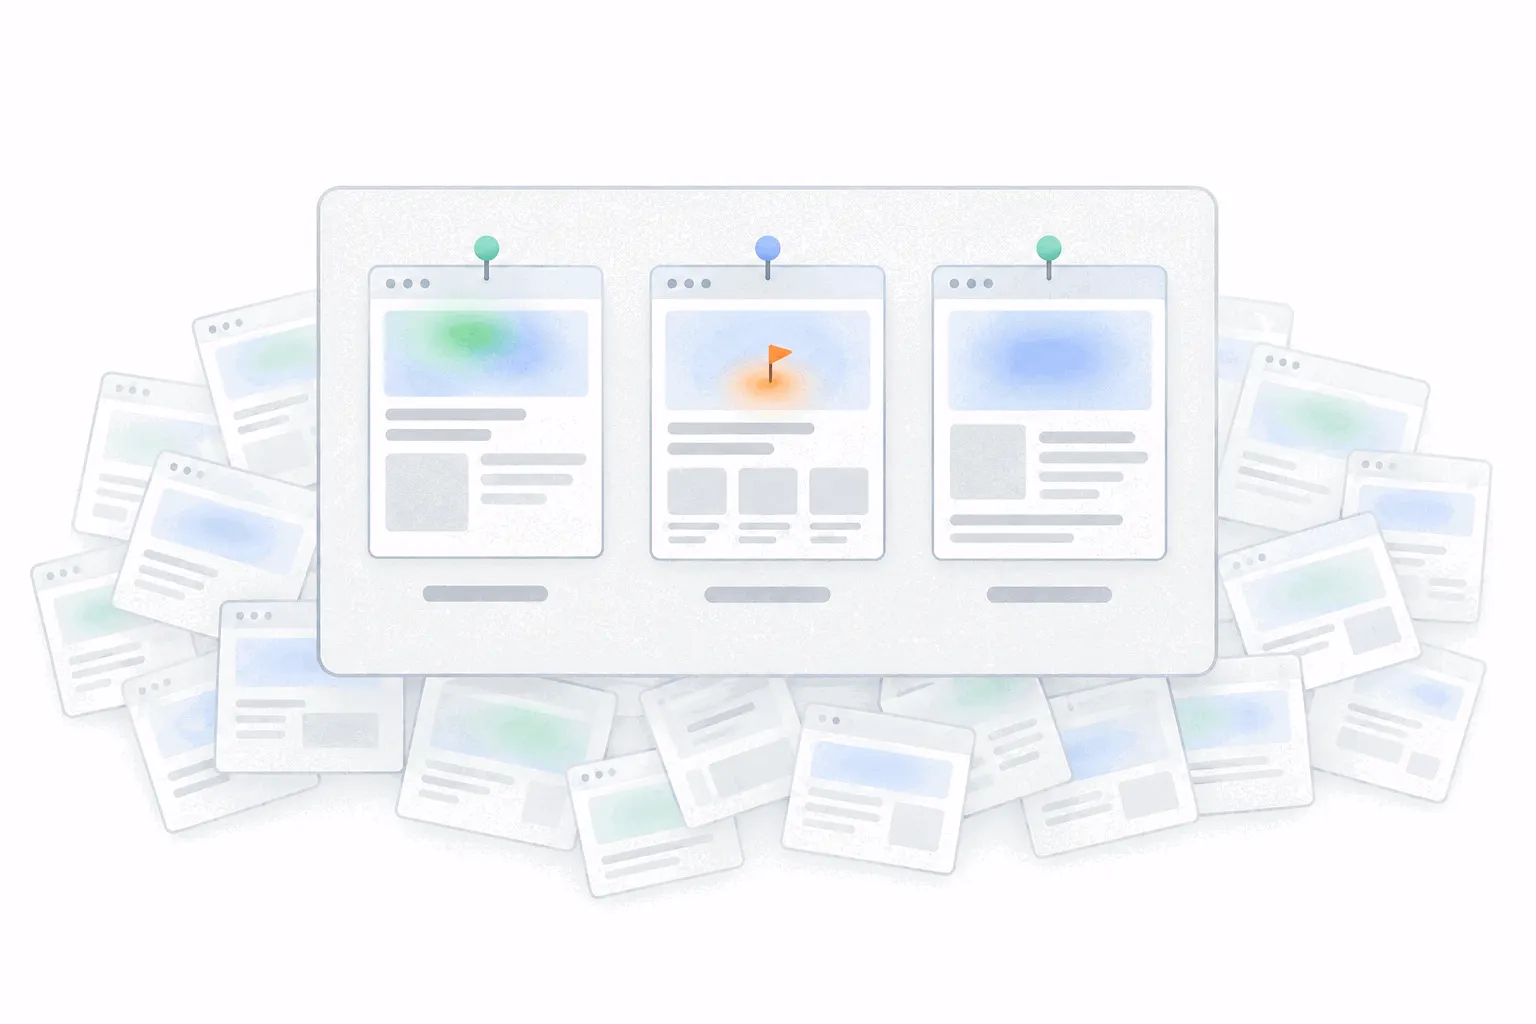
Heatmap dashboard: which heatmaps to keep in view
A heatmap dashboard is the short set of maps you actually review. Which five pages earn a standing heatmap, which map type fits each page, how often to look, and how to report what you find.
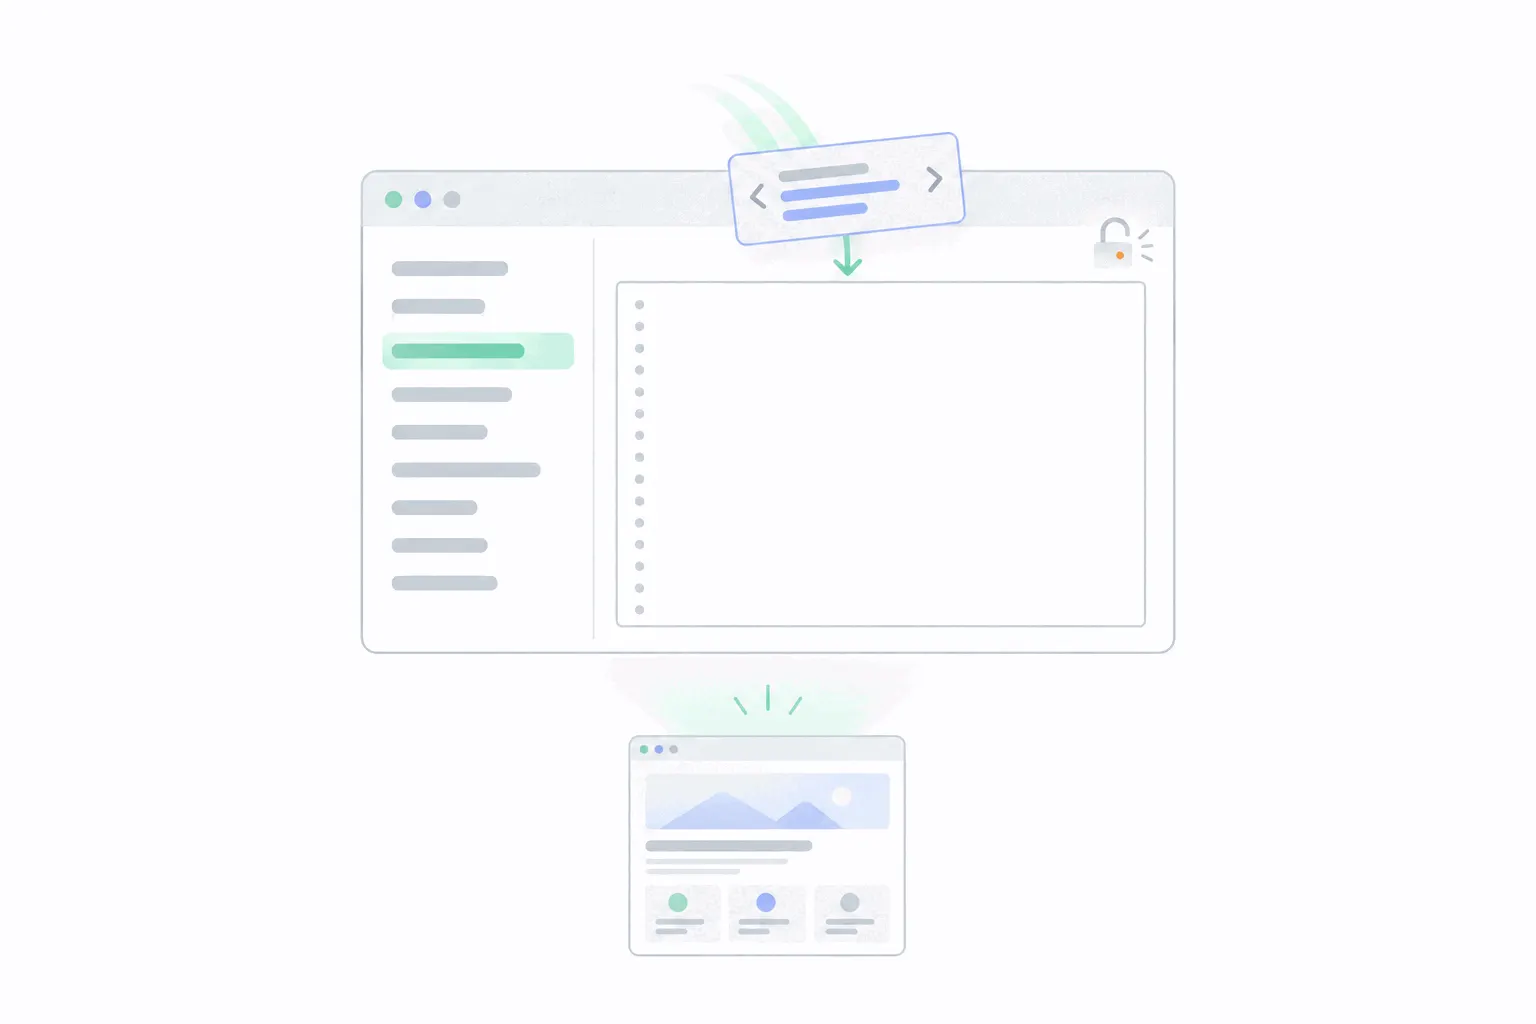
How to add Bigdelta to a Squarespace site
Squarespace takes any analytics script through one box called Code Injection. Where it is, which plans have it, and how to check the script is working.
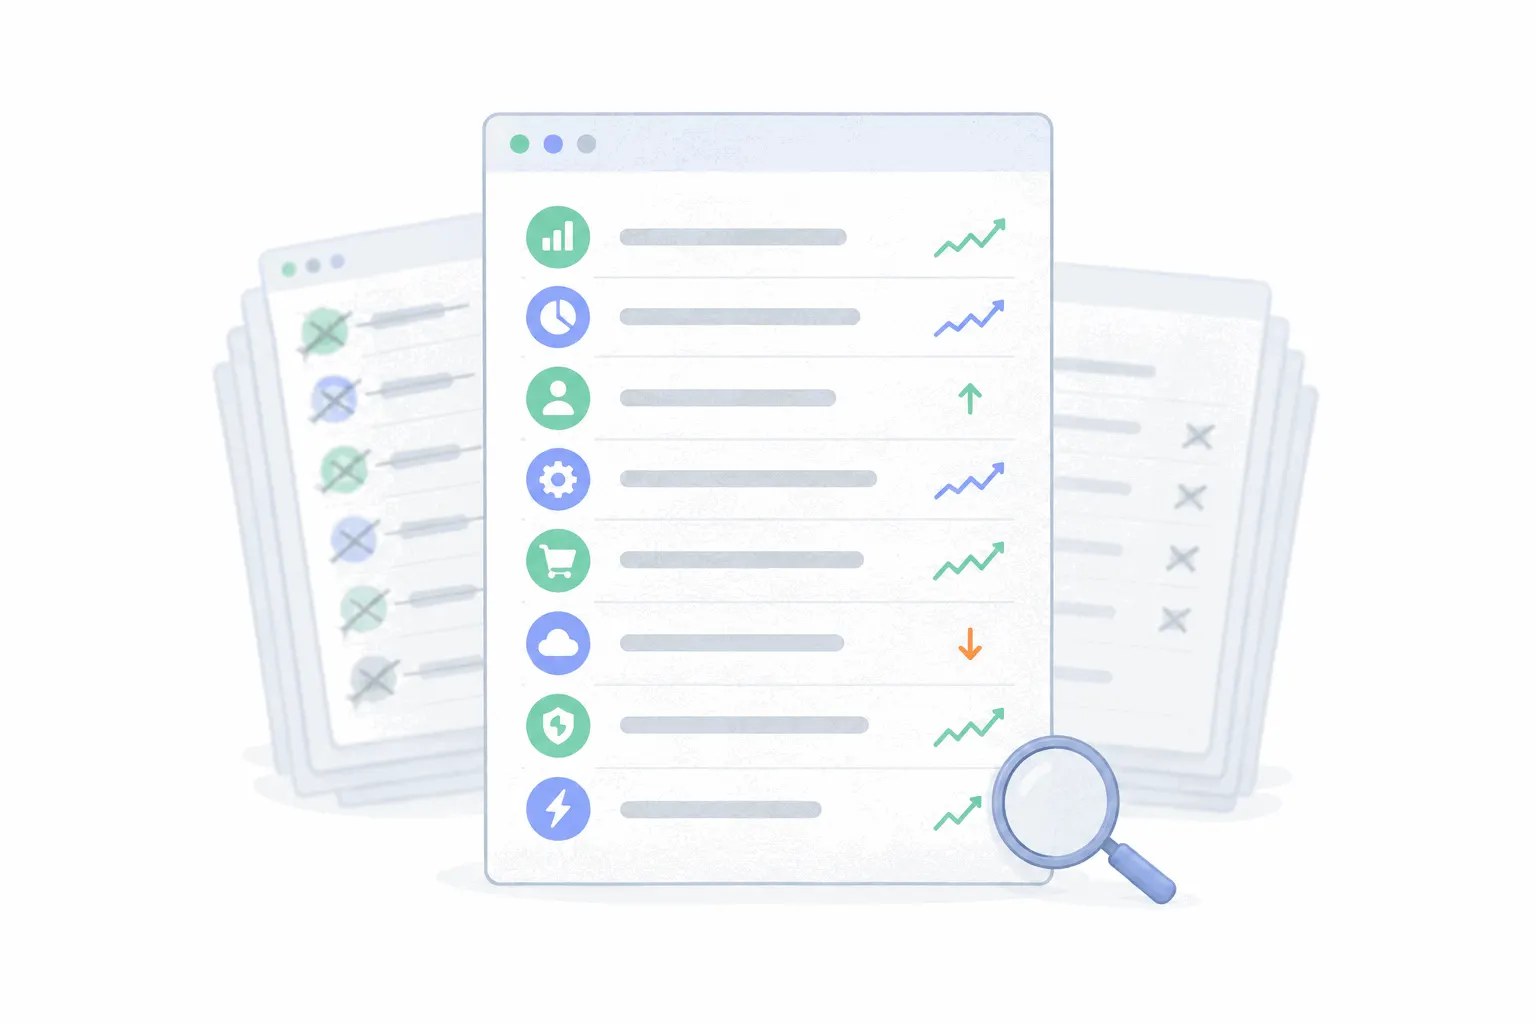
SEO metrics that matter (and the ones that don't)
The search metrics worth tracking on a small or mid-sized site, and the ones to stop reporting.
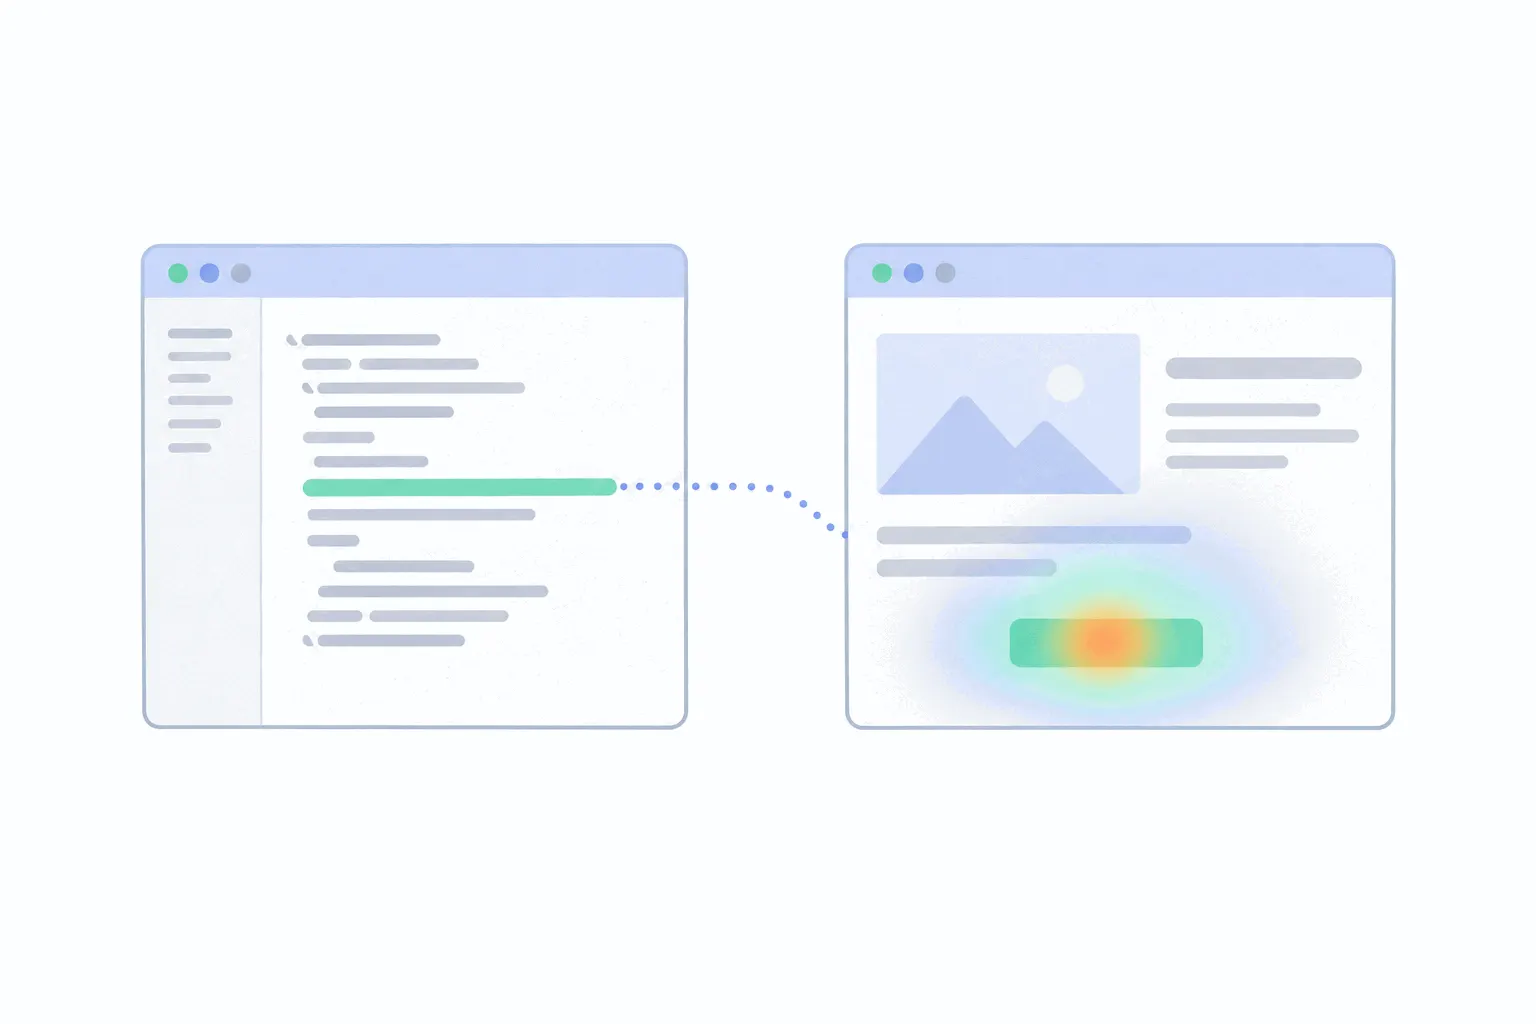
How to create a heatmap for your website
What it takes to get a heatmap of your own site: a tool, one script, the right page and device, and enough visits to trust the picture.
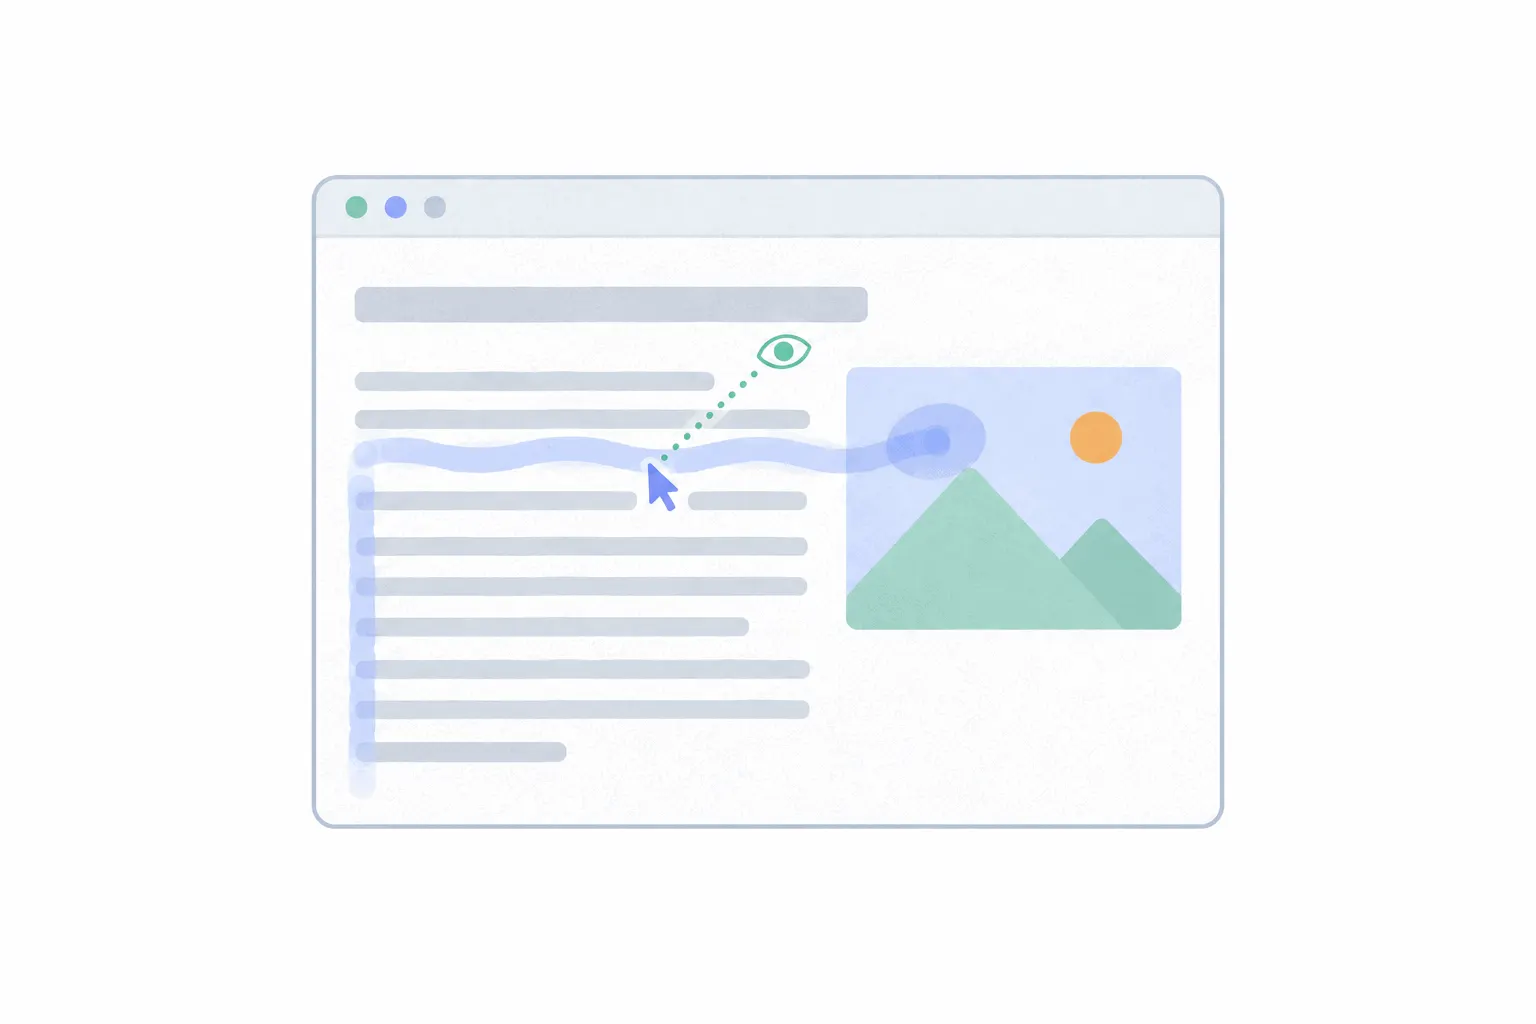
What is a mouse movement heatmap?
A mouse movement heatmap, usually called a move map, shows where desktop visitors moved and rested their cursor on a page. It is a rough guide to where they looked, and this post explains how rough.
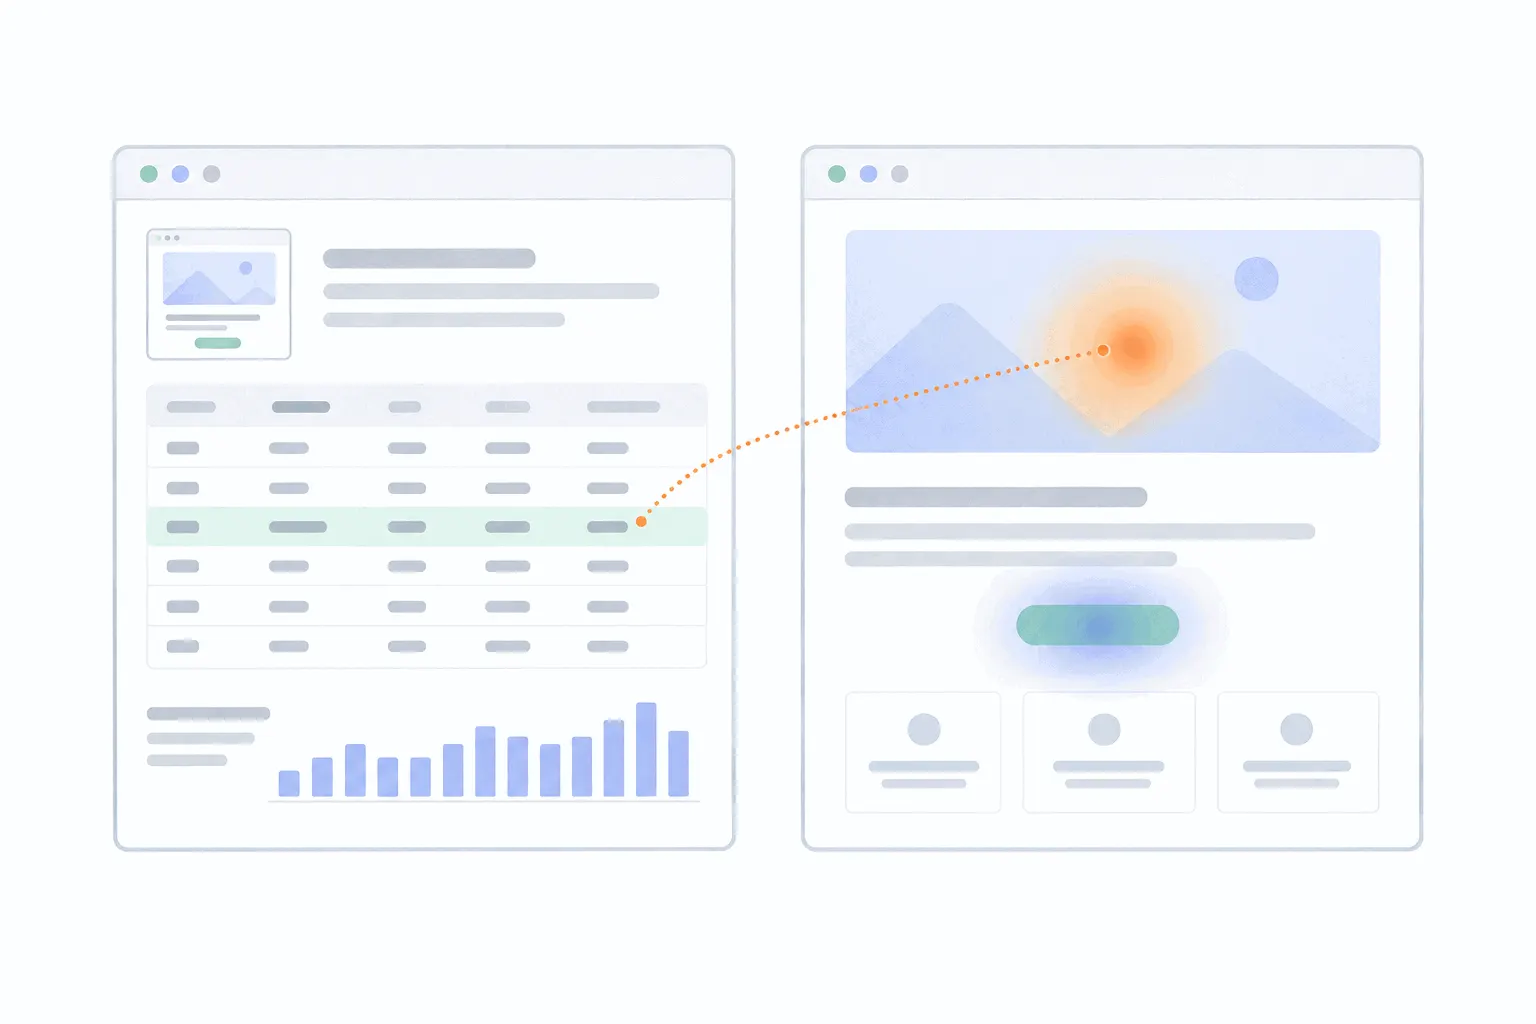
Heatmaps vs analytics: what a heatmap adds to your page view reports
An analytics report and a heatmap keep different records of the same page. What each one stores, three pages where the two disagree, and how much traffic a heatmap needs before it is worth adding.
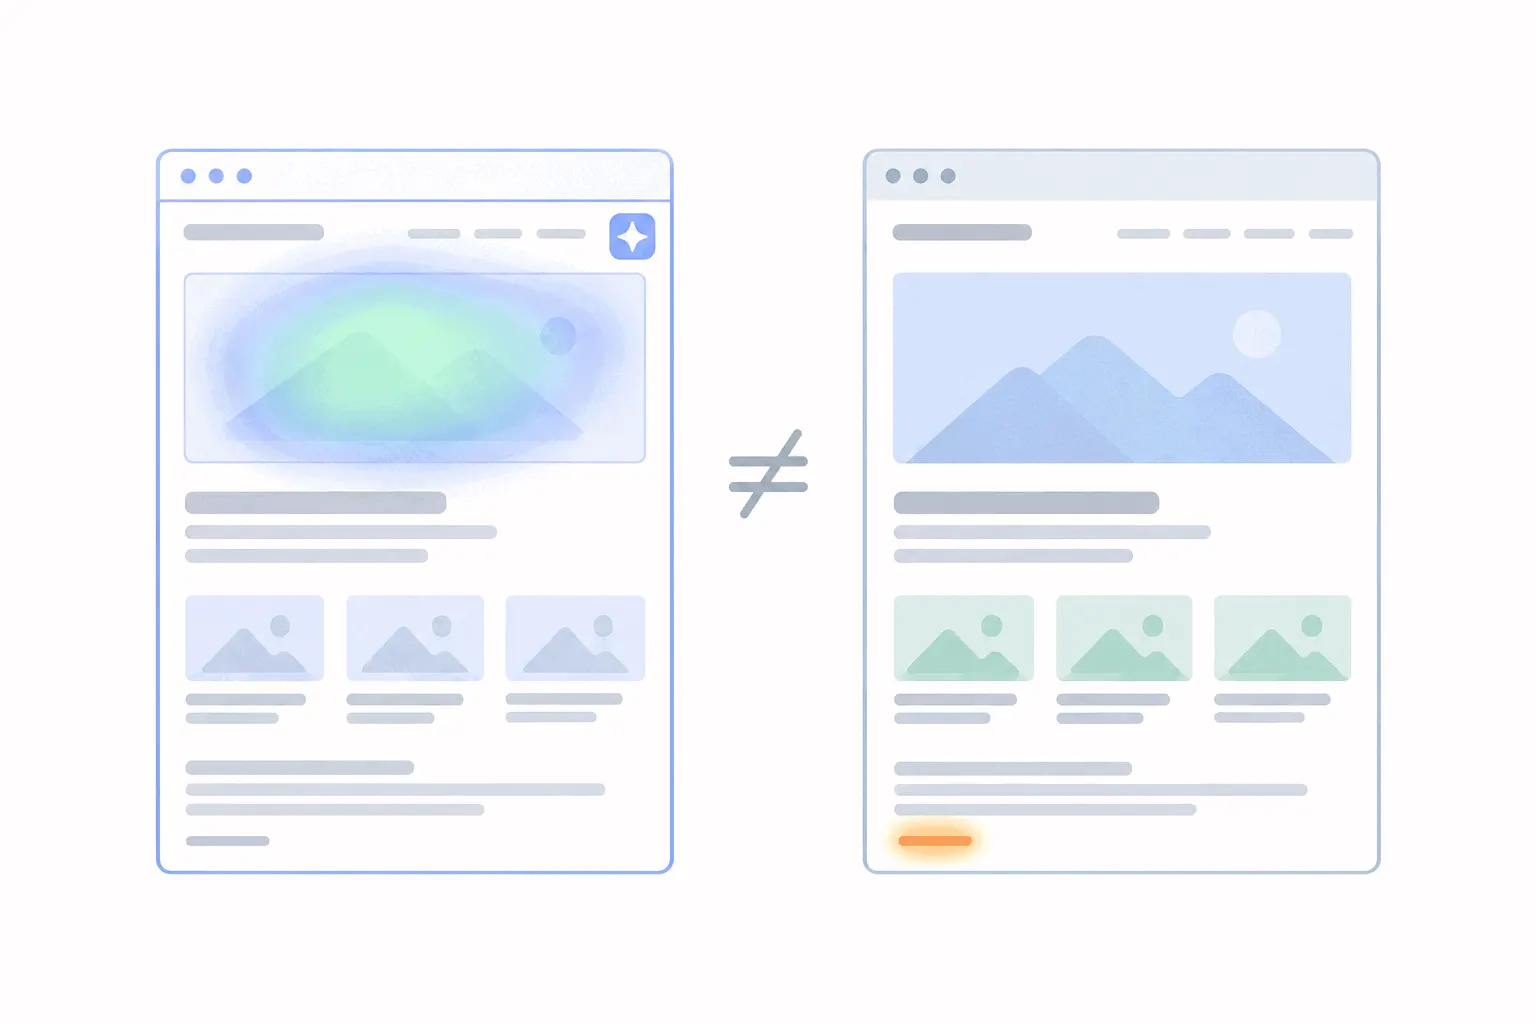
What is an AI heatmap?
An AI heatmap is a model's guess at where people will look at a page, made from a screenshot before anyone has visited. How the guess is made, and where a measured heatmap takes over.

What is website traffic?
Website traffic is the flow of people arriving at your site, counted as visitors, visits or pageviews depending on which tool you ask. What the word covers, the handful of traffic types worth telling apart, and the first number a store, a software company, a blog and a local business should each look at.

How to write a tracking plan
A tracking plan is a short list of what your website measures, why, and what each event is called. Here is how to write one before anyone adds tracking, and four example plans to copy.

First-party vs third-party cookies: what the difference means for your website
A first-party cookie is set by your own site. A third-party cookie is set by someone else's service running inside your page. That one difference decides what browsers block, which of your numbers get worse, and which parts of your setup keep working.

What are frustration signals? Rage clicks, dead clicks and error clicks
The click patterns that mean a visitor is stuck, how to tell the three apart, when they are false alarms, and where they show up on a store, a SaaS site, a blog and a service site.

Website heatmap examples: ten common patterns and what they mean
The same shapes turn up on heatmaps of shops, SaaS sites, blogs and service pages. Ten of them, each with the page it lives on, the reading behind it, and the fix.
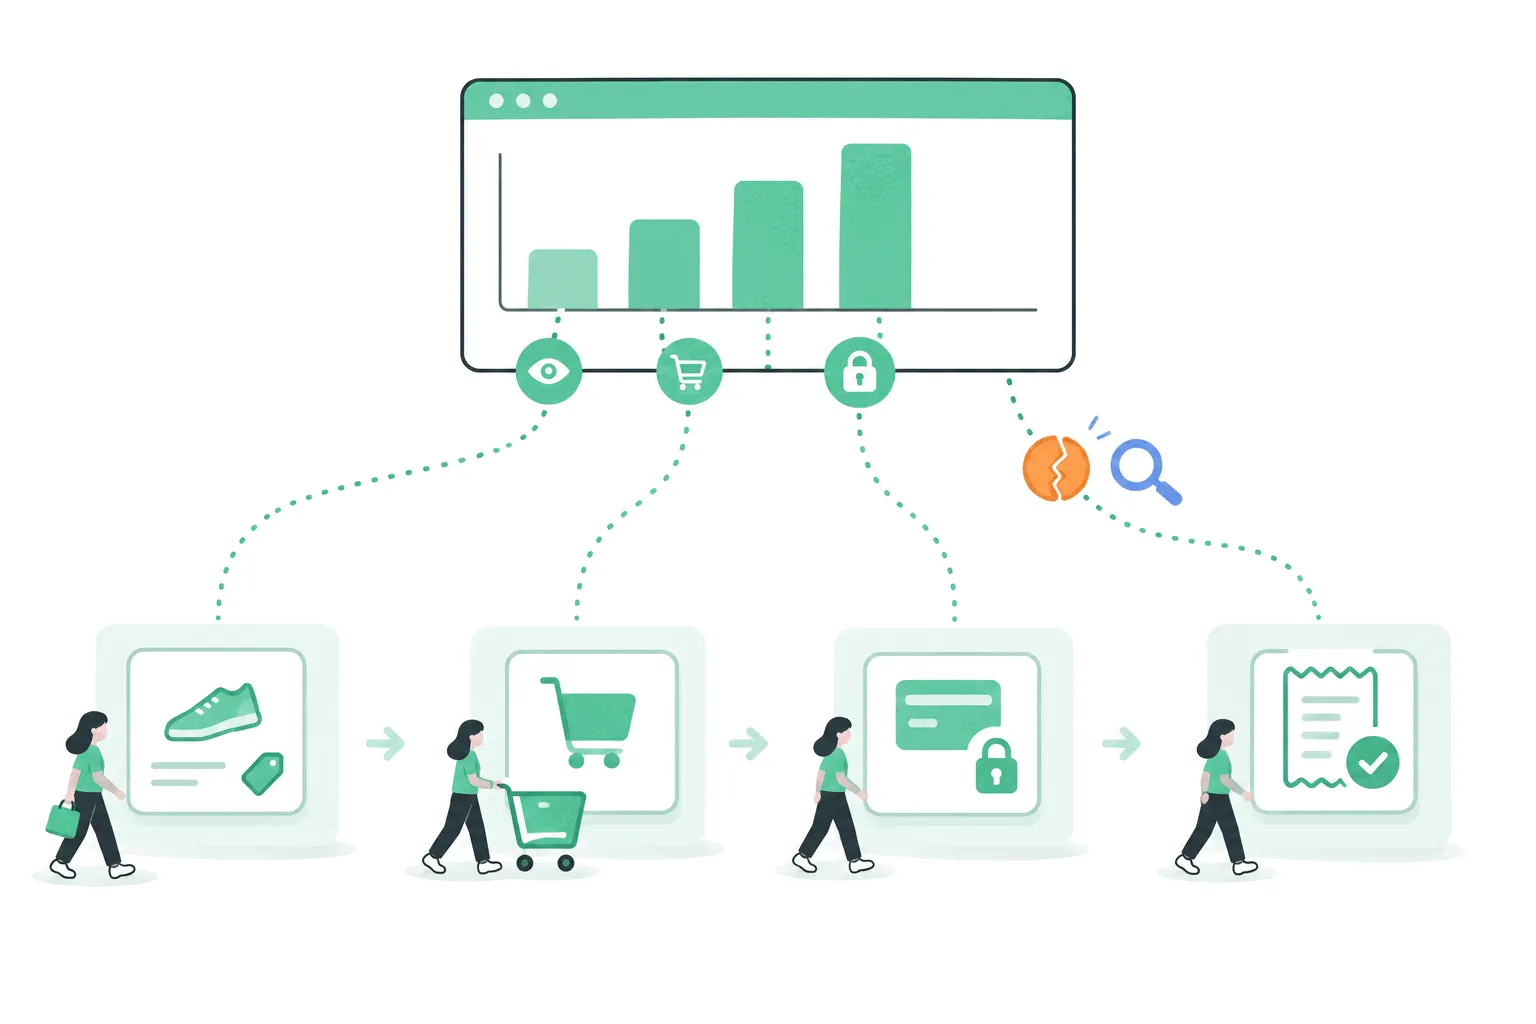
How to set up ecommerce tracking in Google Analytics 4
Until ecommerce tracking is wired up, GA4 counts your store's visitors and knows nothing about its money. What the ecommerce events are, the one-click routes on Shopify and WooCommerce, the manual build, and how to test it with a real order.
How to forecast organic traffic
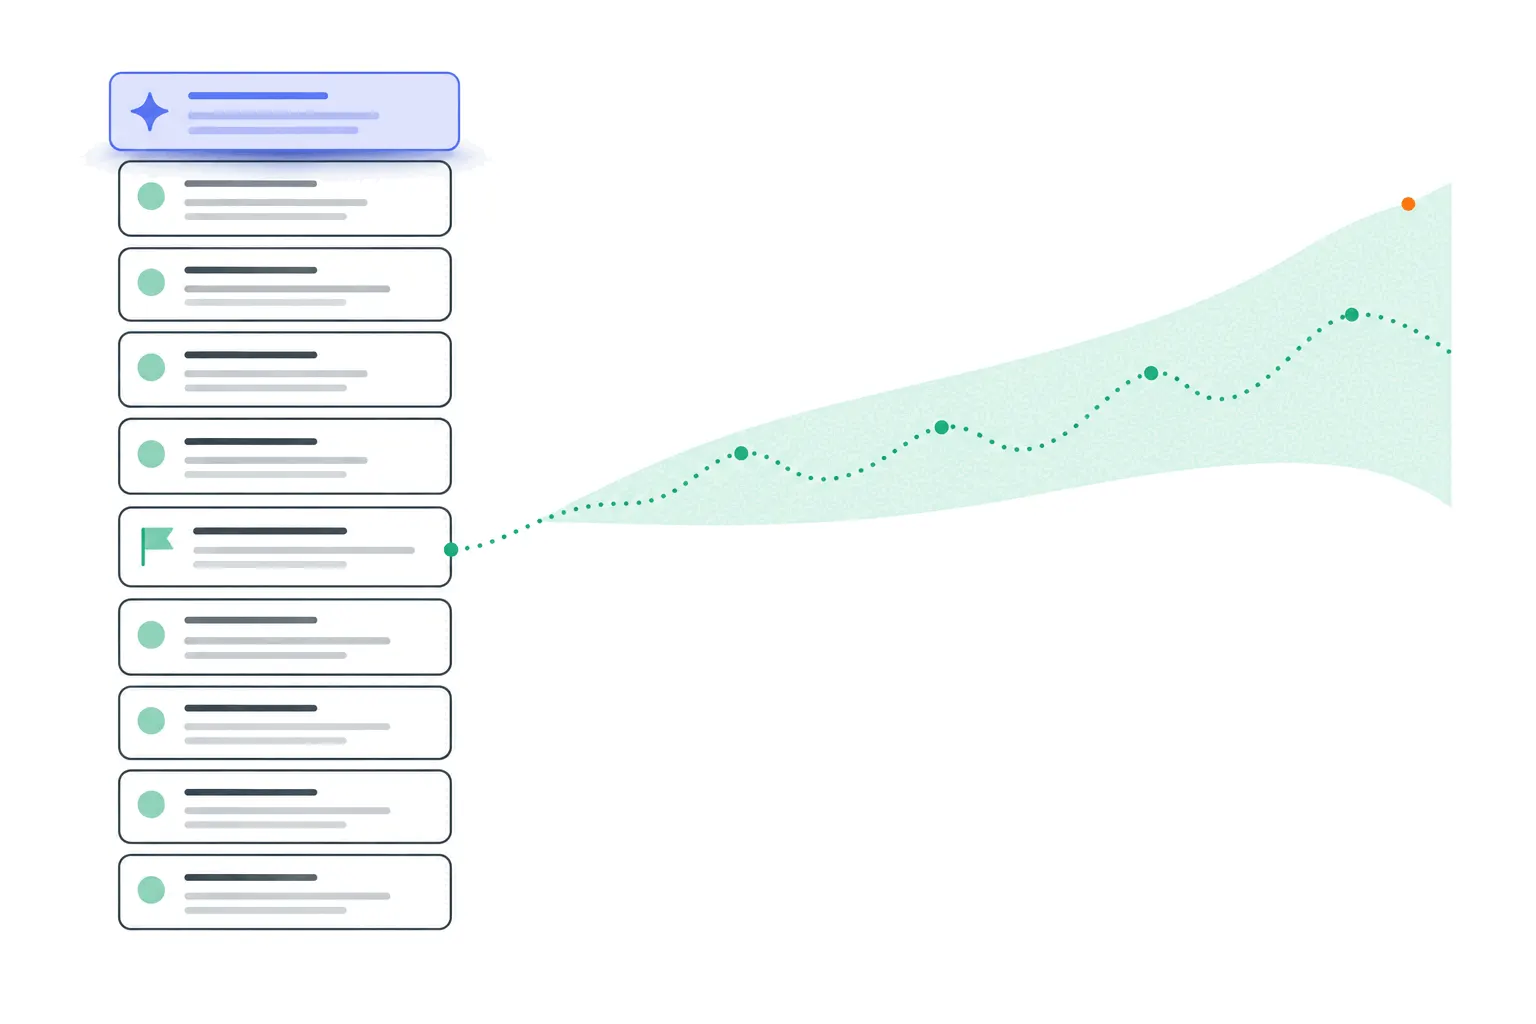
Keyword by keyword, search traffic is more forecastable than any other channel - volume, a click-through curve, a discount for AI answers, and honest ranges. The method, the three estimates hiding inside it, and how your own data sharpens all of them.

How to add heatmaps to a Shopify store
Shopify's reports tell you what sold - a heatmap shows how shoppers used the pages along the way. The two install routes, the tools with real Shopify apps, and the checkout limitation nobody's listicle mentions.
How to measure website engagement
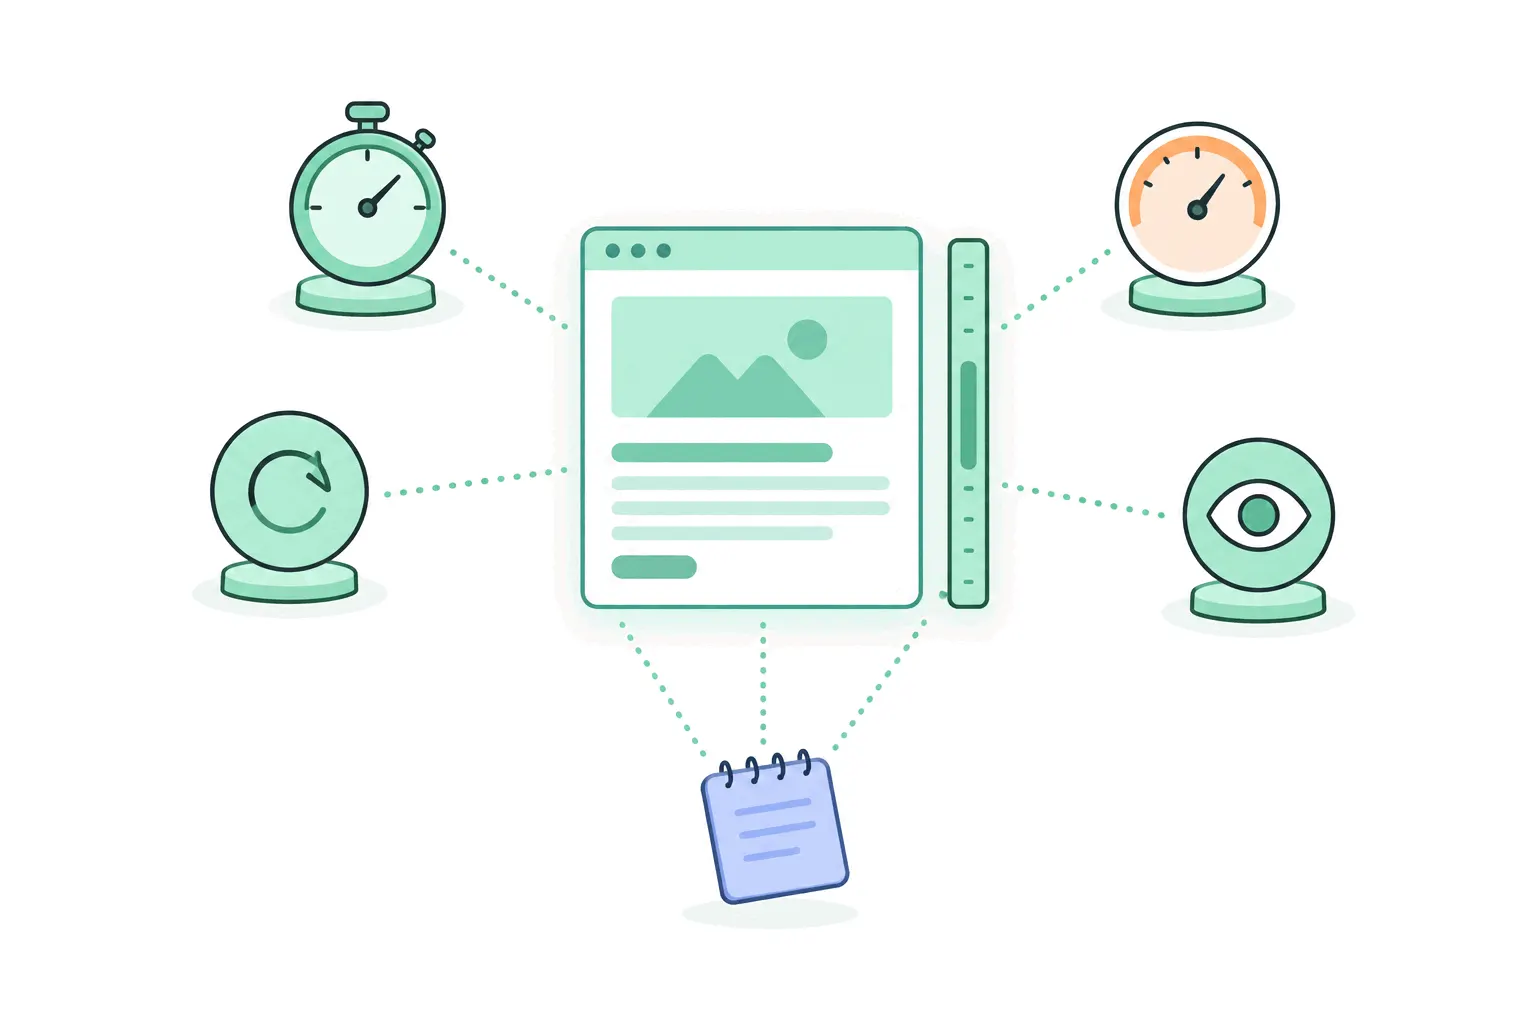
Engagement is the question every analytics metric gestures at and none of them answers alone. Which numbers capture which slice of it, what each one quietly misses, and how to build an engagement picture you can act on.
What is content analytics?
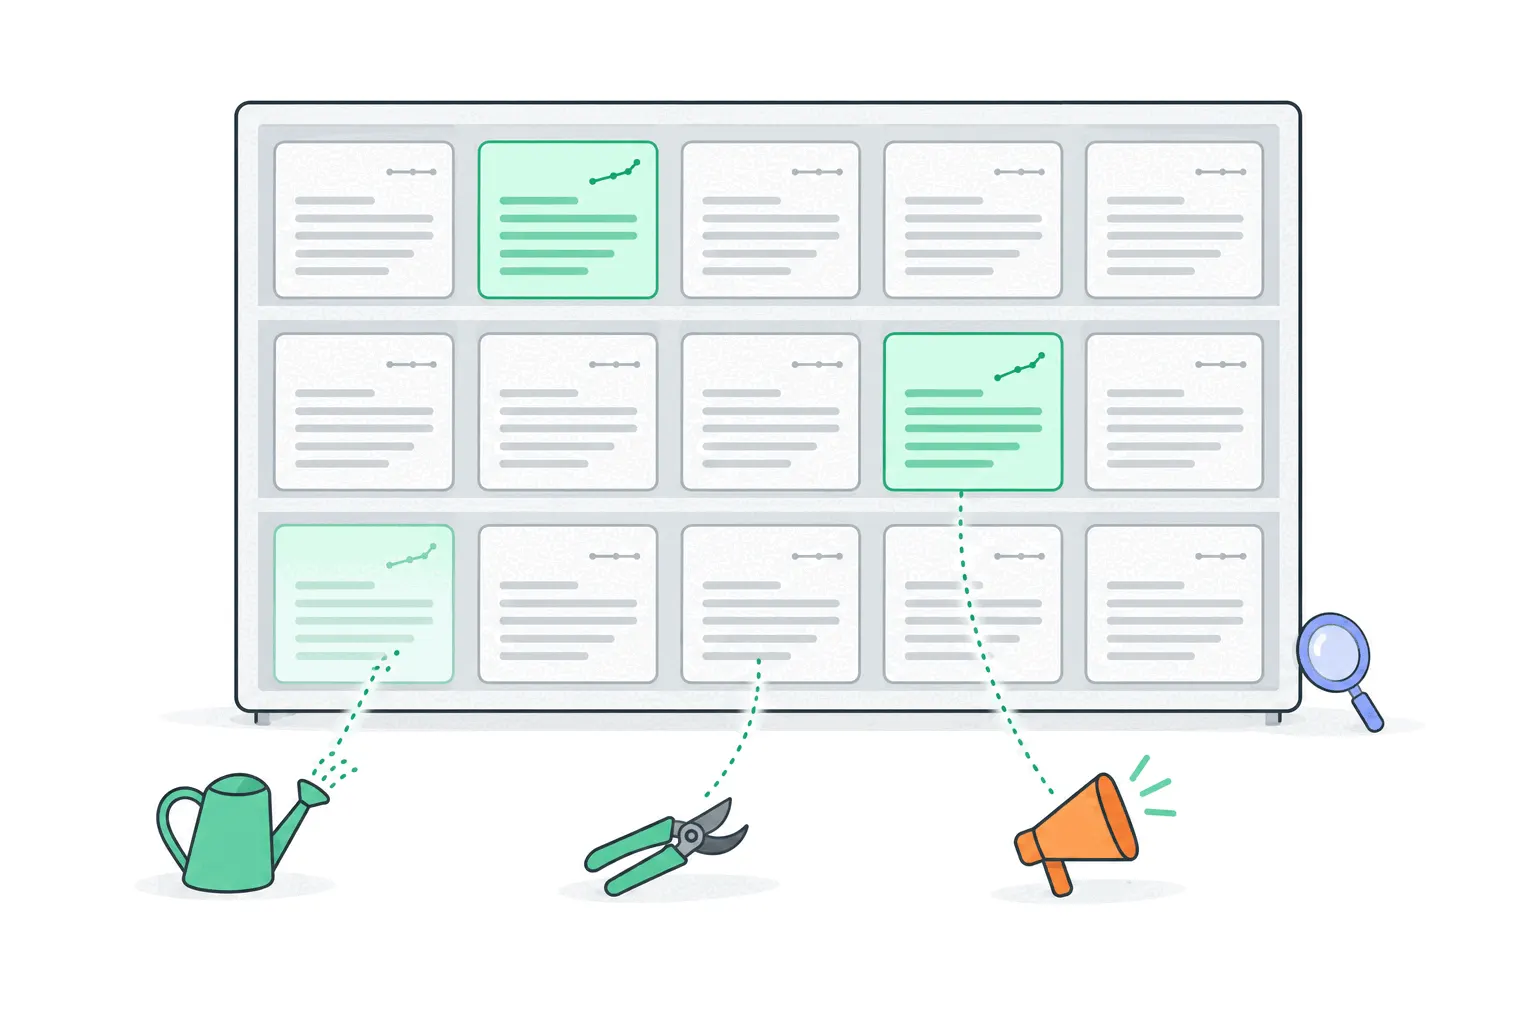
Content analytics is measuring what your articles, guides and pages actually do for you - which ones earn traffic and attention, which quietly decay, and where the next hour of work pays best. The metrics, the method, and the honest math.
Best session replay tools in 2026
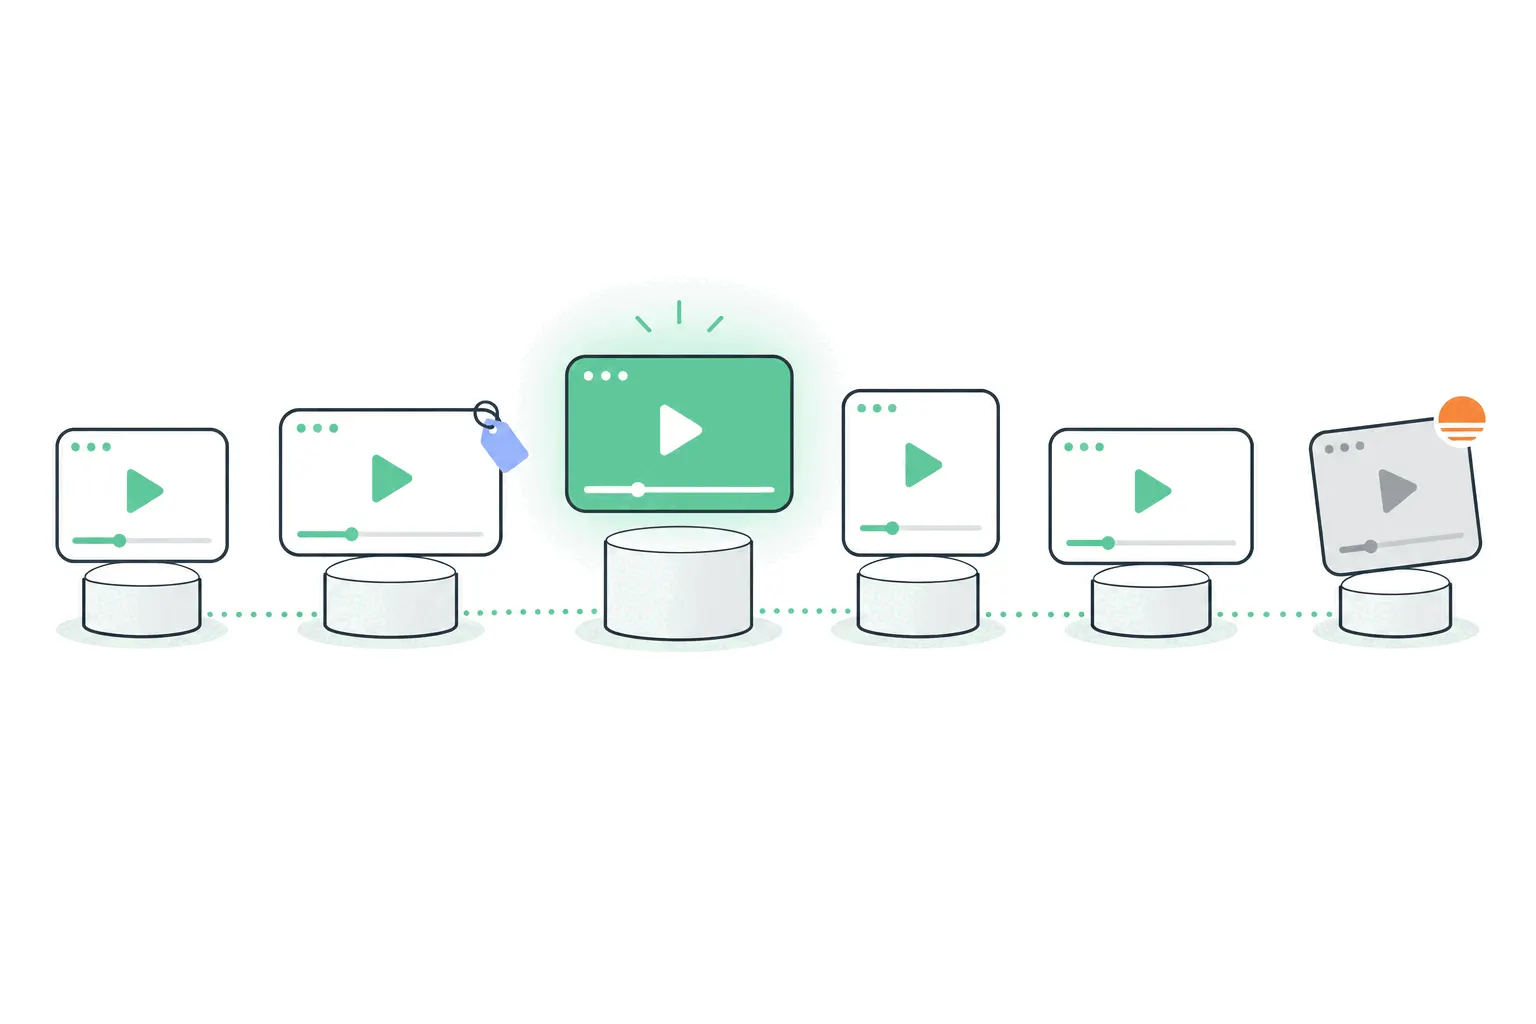
Nine tools that record what visitors do on your site, compared on the things that actually differ: what's free, what's captured, what ships alongside the recordings, and which one fits which team. Every price checked on the vendor's own page.
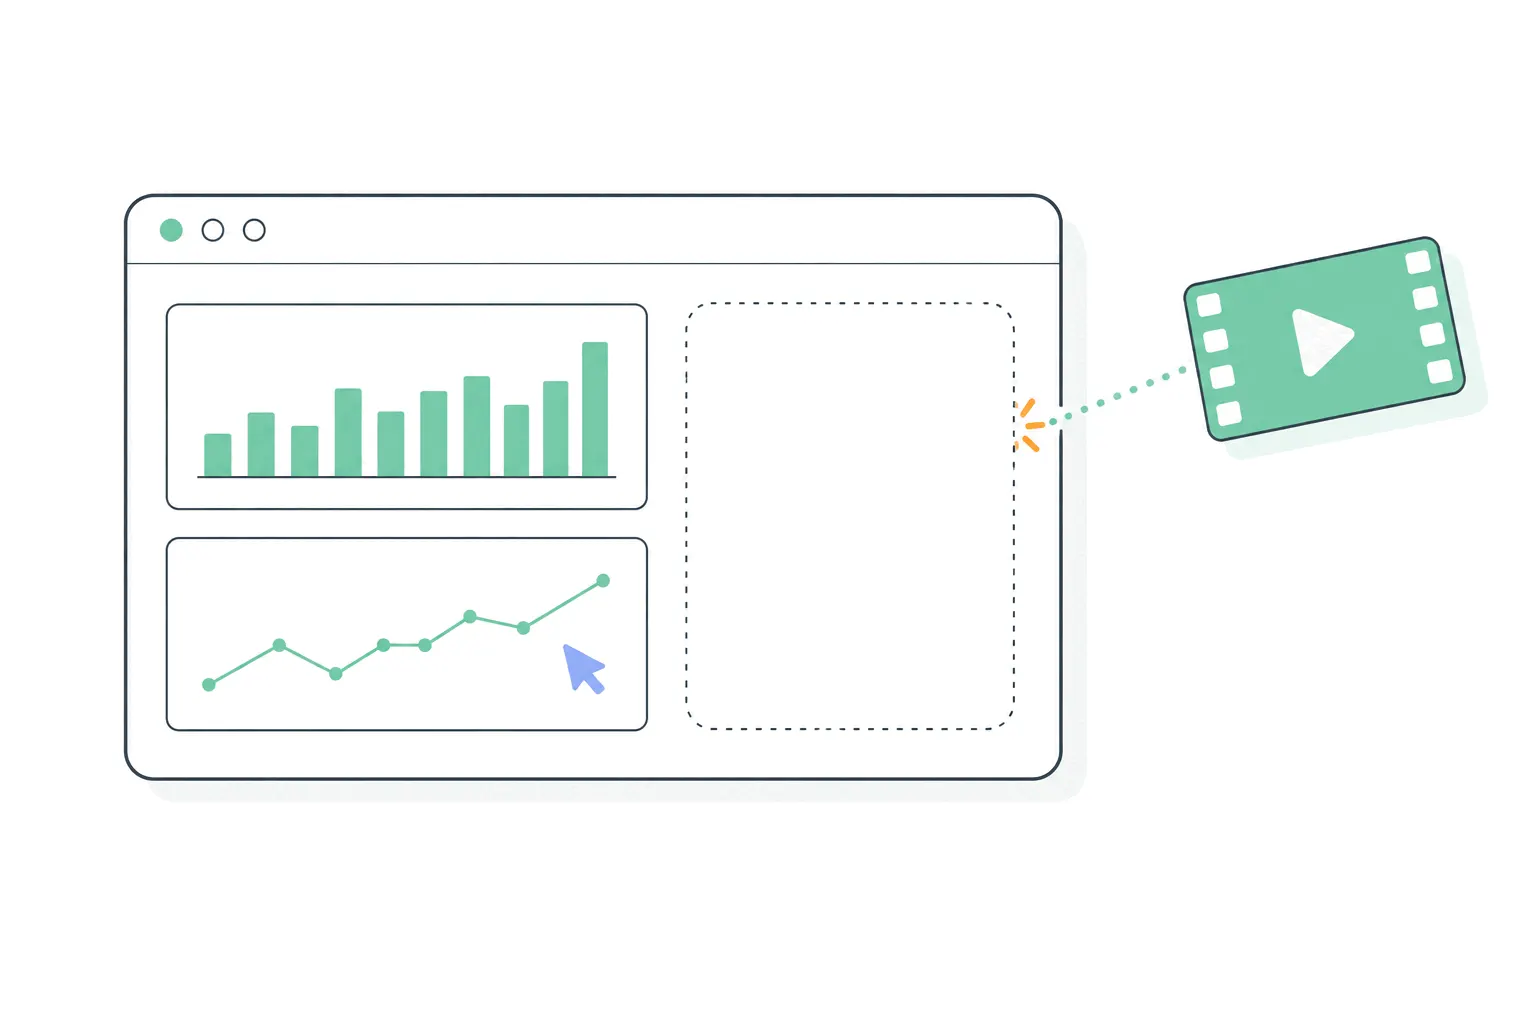
Does Google Analytics have session replay?
No - GA4 can't show you a recording of a visit, and nothing in its roadmap suggests that changes. What people mistake for replay inside GA4, why the feature doesn't fit the product, and the free way to add recordings alongside it.
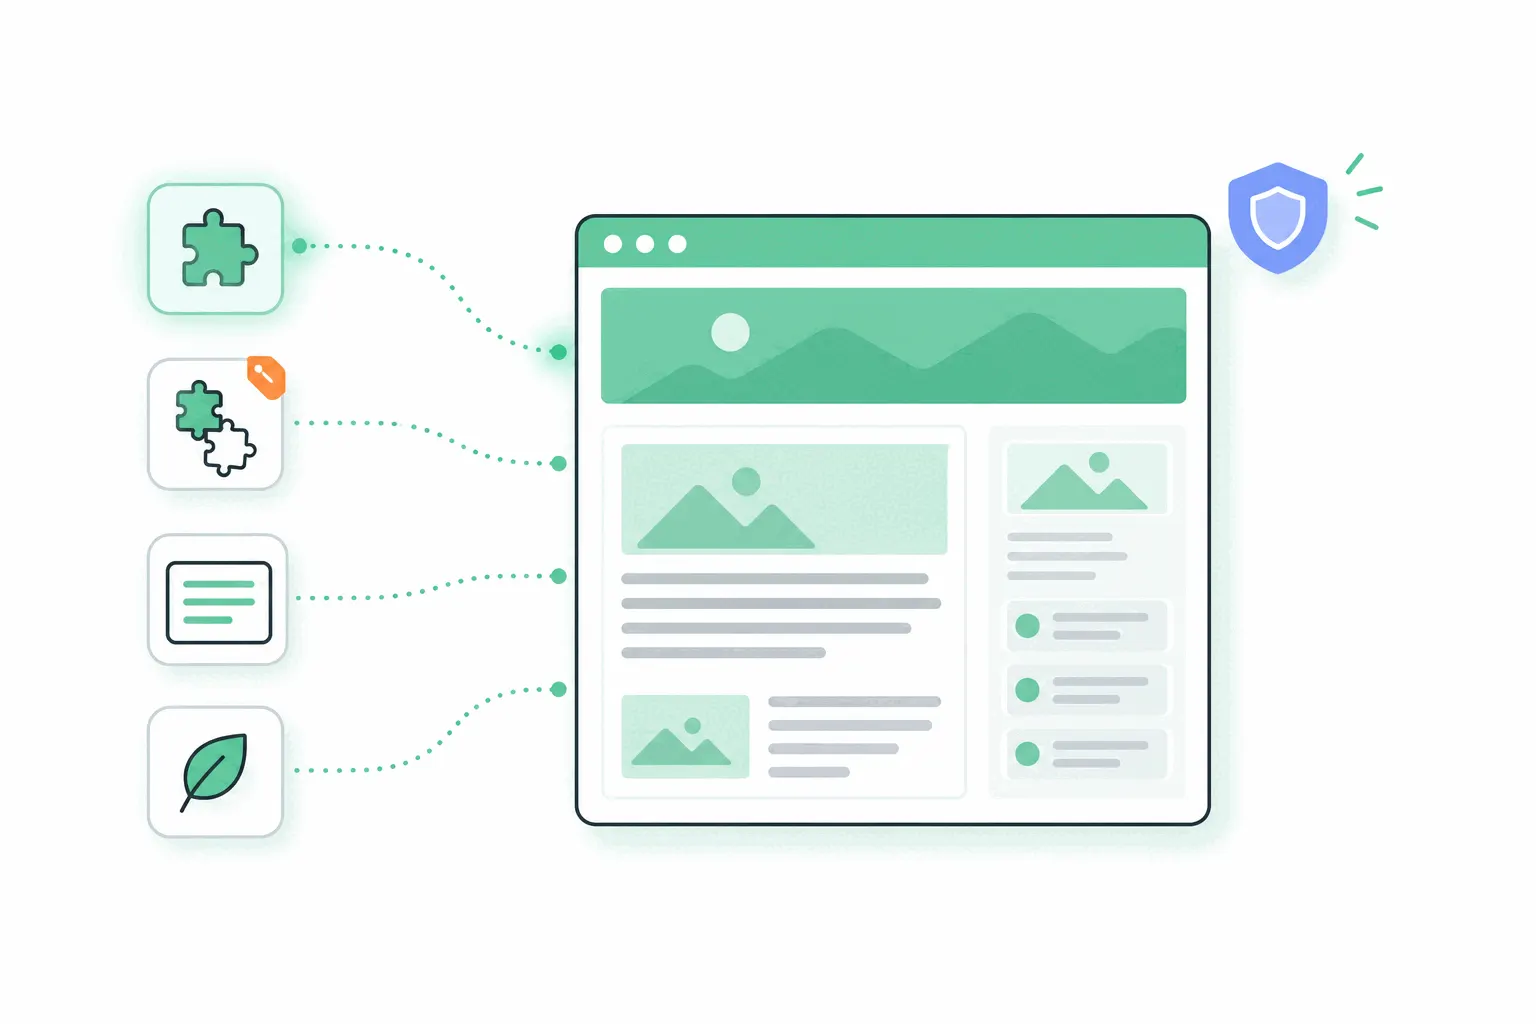
How to add analytics to a WordPress site
WordPress ships with no analytics of its own - unless you're on WordPress.com, where some stats are built in. The four ways to add real visitor tracking to a WordPress site, what each one costs you, and how to pick.

How to add analytics to a Webflow site
Webflow tracks nothing until you tell it to, and which analytics you can add depends on your plan. The free Google Analytics field, the paid custom-code route, Webflow's own Analyze add-on, and the two gotchas that pollute everyone's data.

How to build a Google Analytics dashboard
GA4 has three different things people call a dashboard, and none of them is the one you're picturing. What each level can do, the card limits Google buries in its docs, and a starter layout that answers real questions.

Is Google Analytics free?
Yes - genuinely, with no trial expiring behind your back. But the free tier has walls, the paid tier costs more than most companies' analytics budgets, and some of what free costs you isn't on any invoice. The full picture.
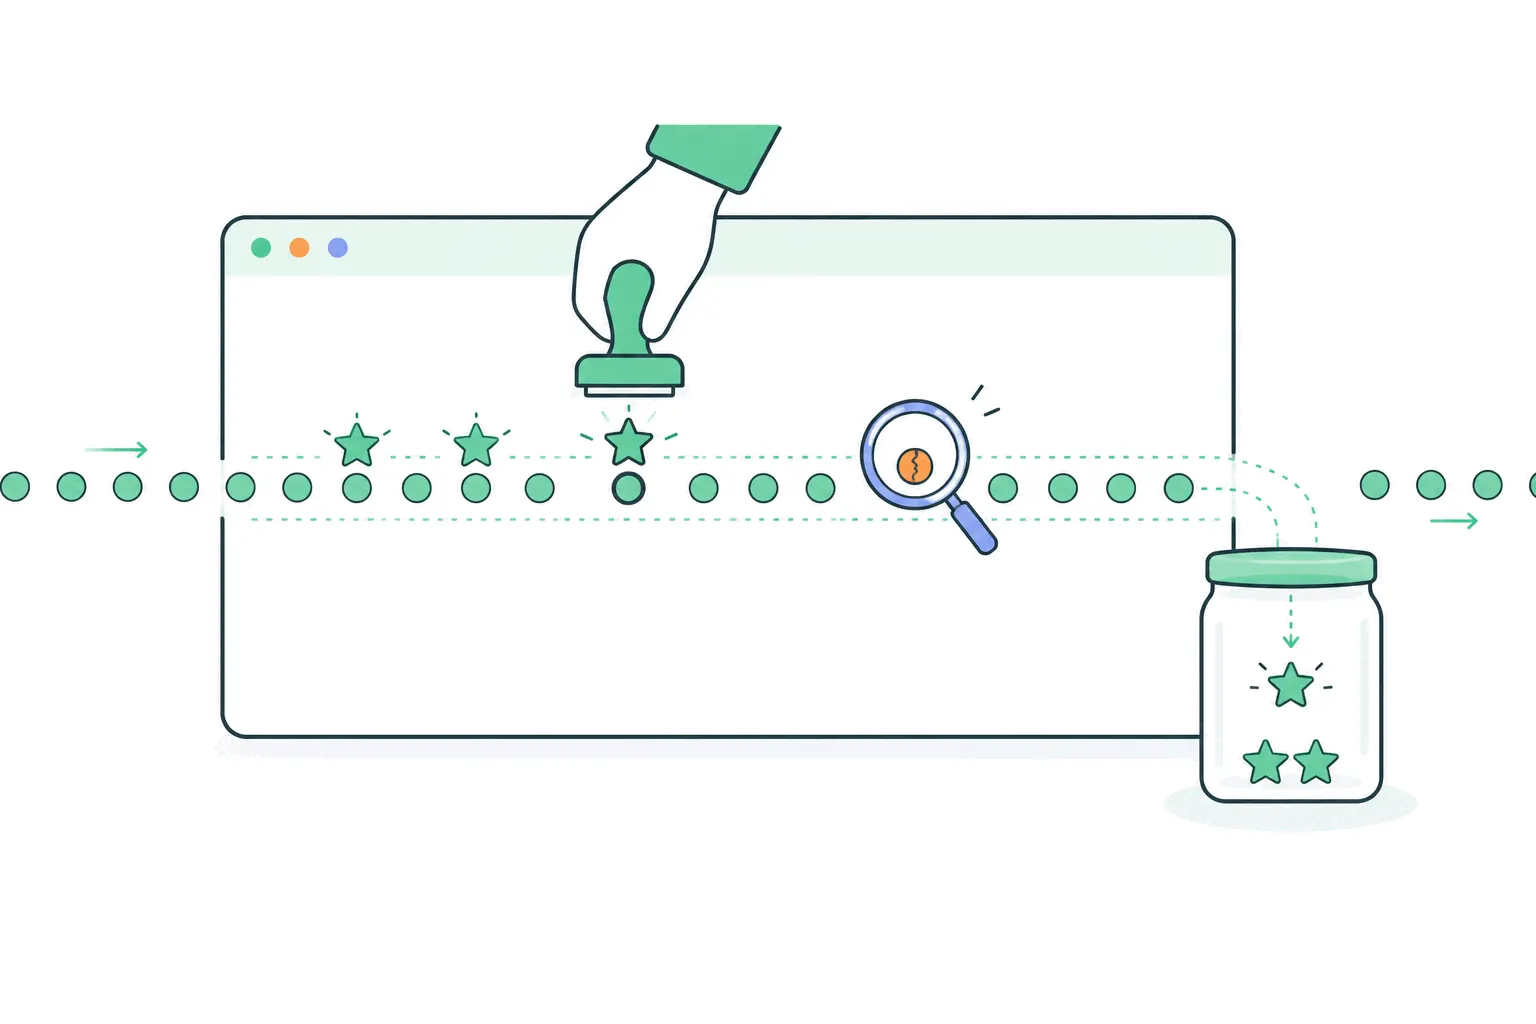
How to set up conversion tracking in Google Analytics 4
GA4 tracks nothing as a conversion until you tell it what one is. The full setup for the four common cases - thank-you pages, forms, purchases and clicks - plus the verification step and the mistakes that fake success.
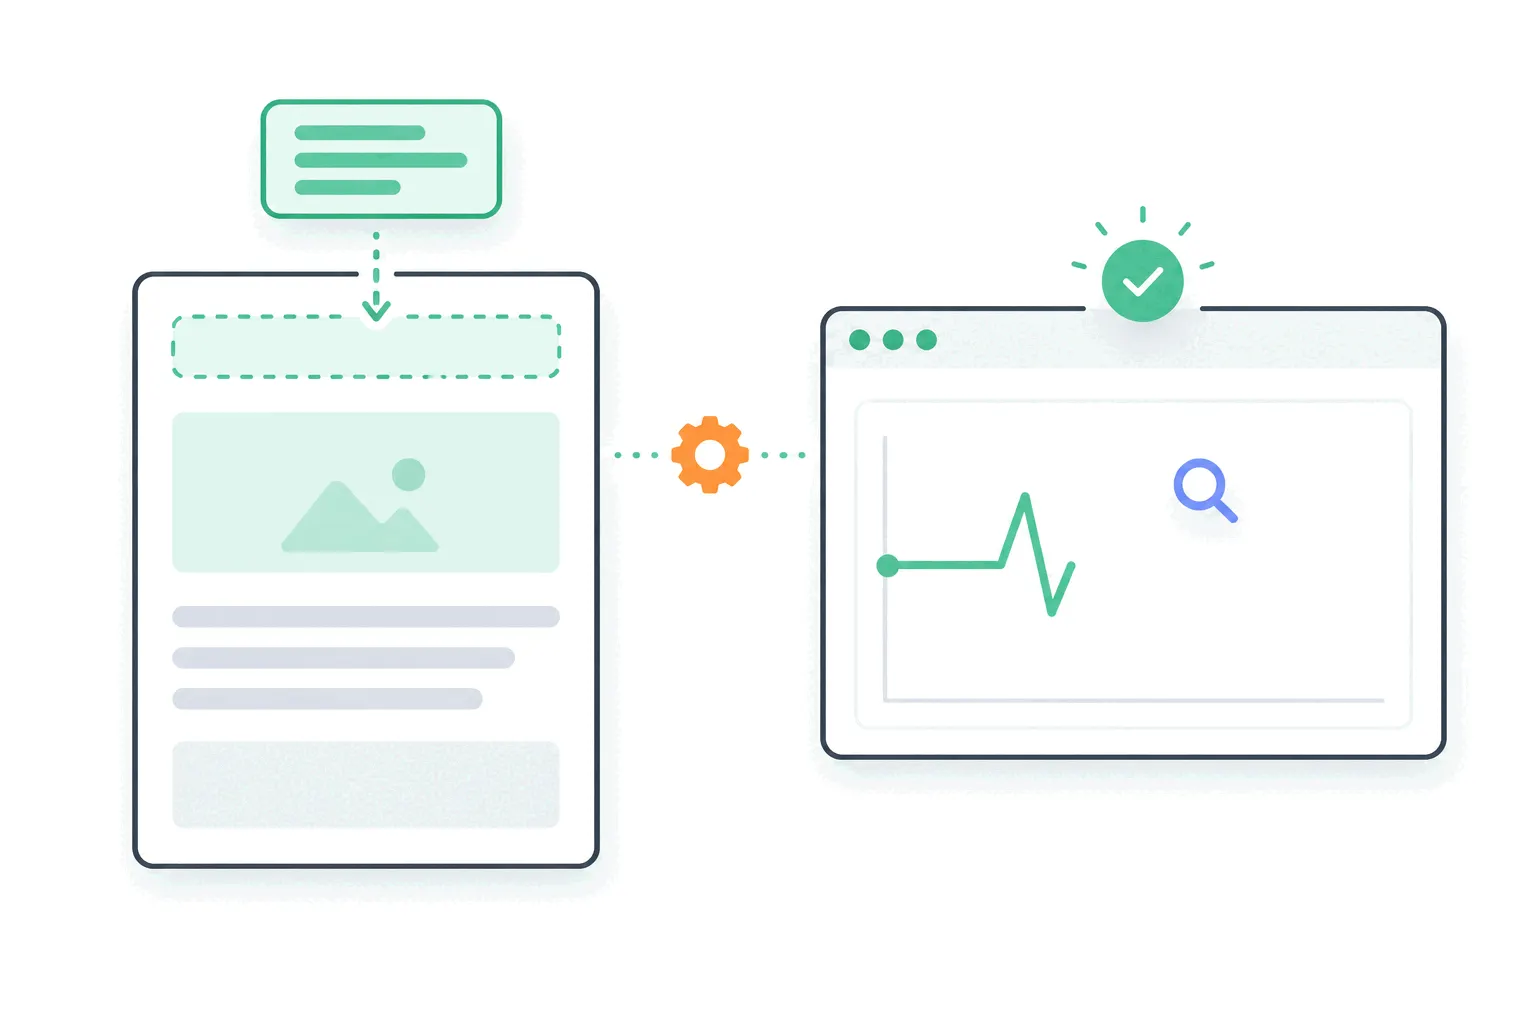
How to set up Google Analytics on your website
Account, property, data stream, one tag in the head - the whole install is about fifteen minutes. The exact steps, how to check it's actually collecting, and the five settings worth changing before you close the tab.
How to reduce checkout abandonment
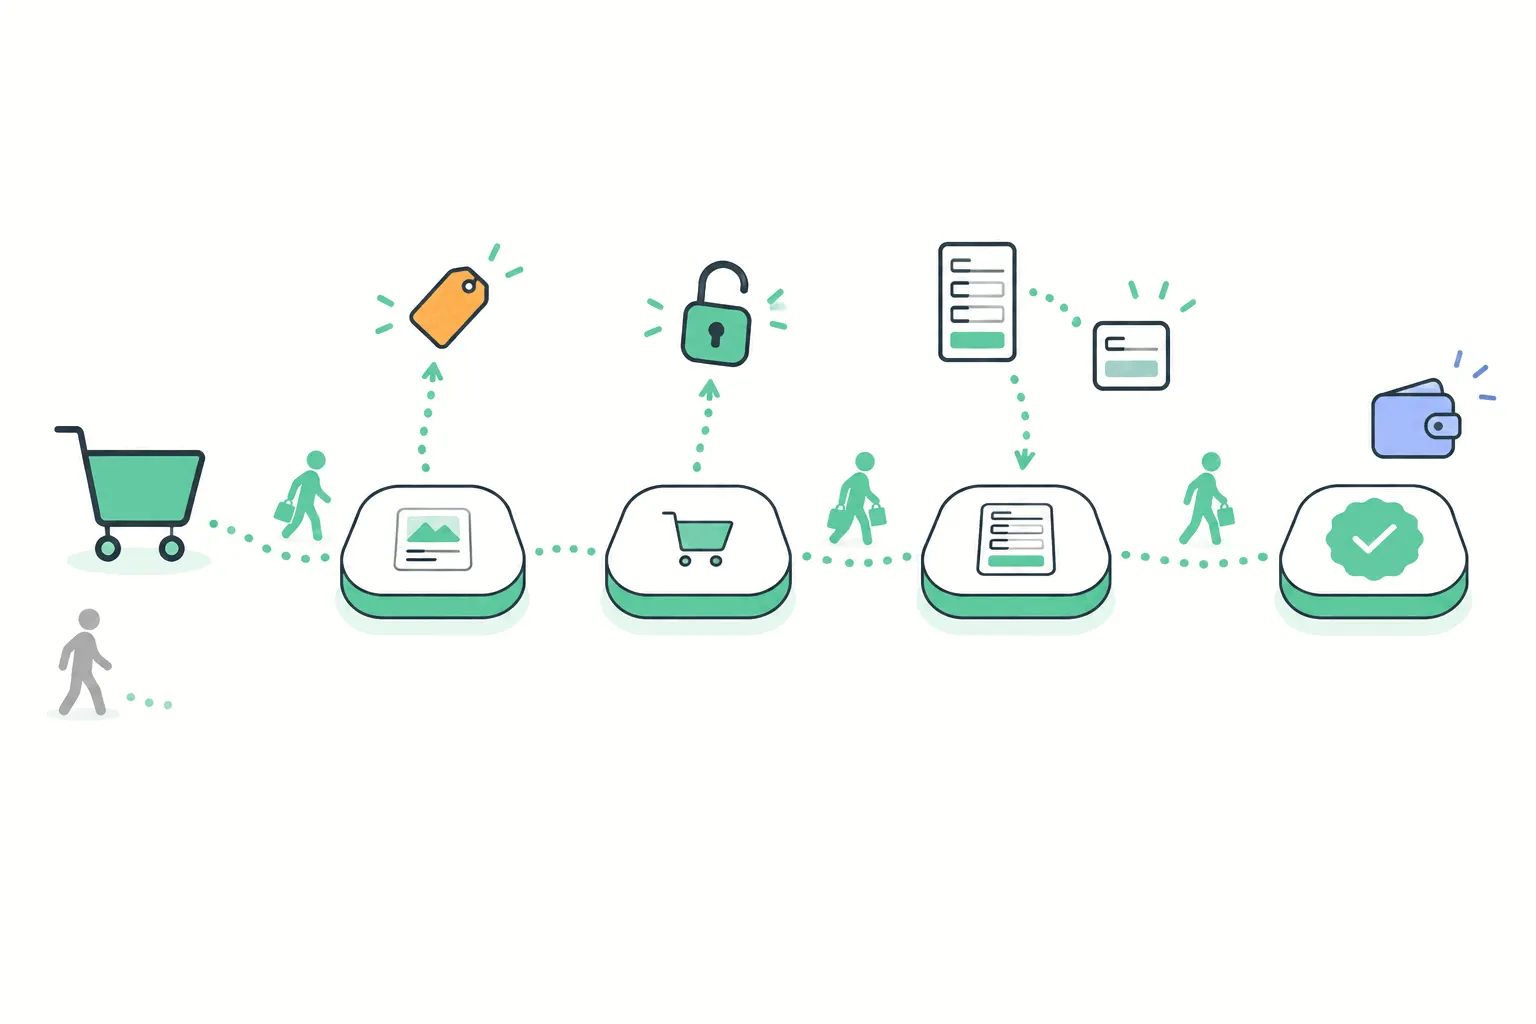
Most abandoned checkouts die for reasons shoppers will happily name: surprise costs, forced accounts, forms that ask too much. The fixes, in the order the evidence supports them - and how to find which one your checkout needs.
How to use Google Analytics 4
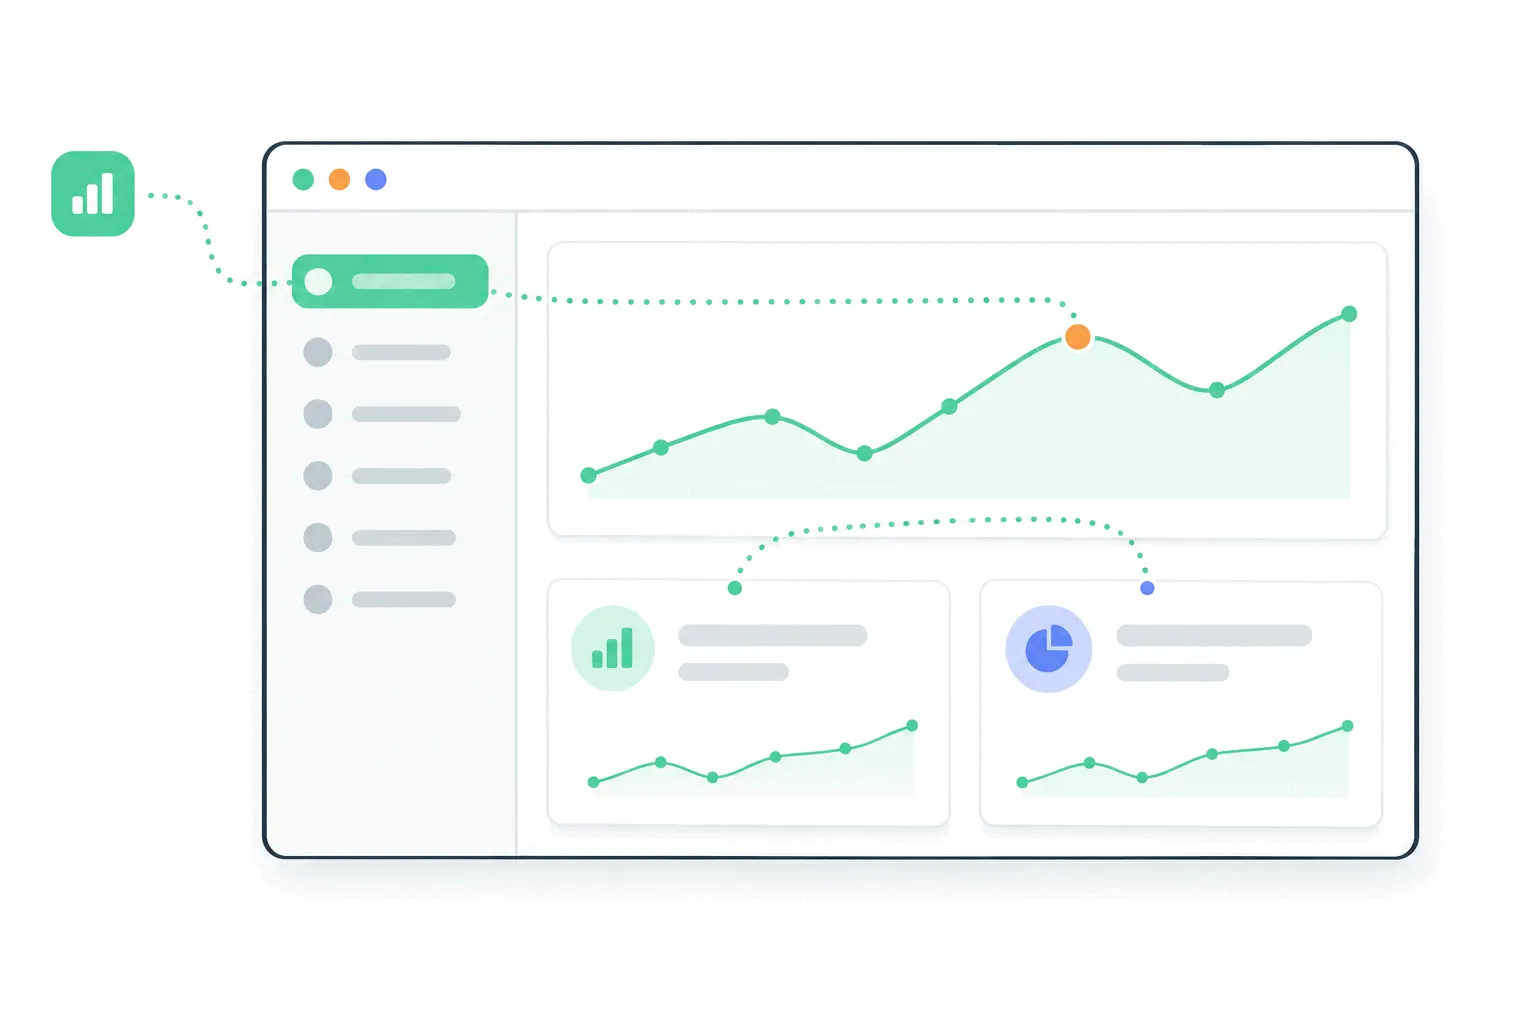
GA4 answers most questions a site owner has - once you know its five odd concepts and the six click-paths that reach the numbers. A tour of the tool as it actually is in 2026, including what it hides and where it stops.

How to identify companies visiting your website
Reverse-IP tools can put company names on part of your anonymous B2B traffic - genuinely useful for sales, structurally incapable of naming everyone. How the identification works, what coverage really looks like, and the legal lines.
How to analyze session recordings
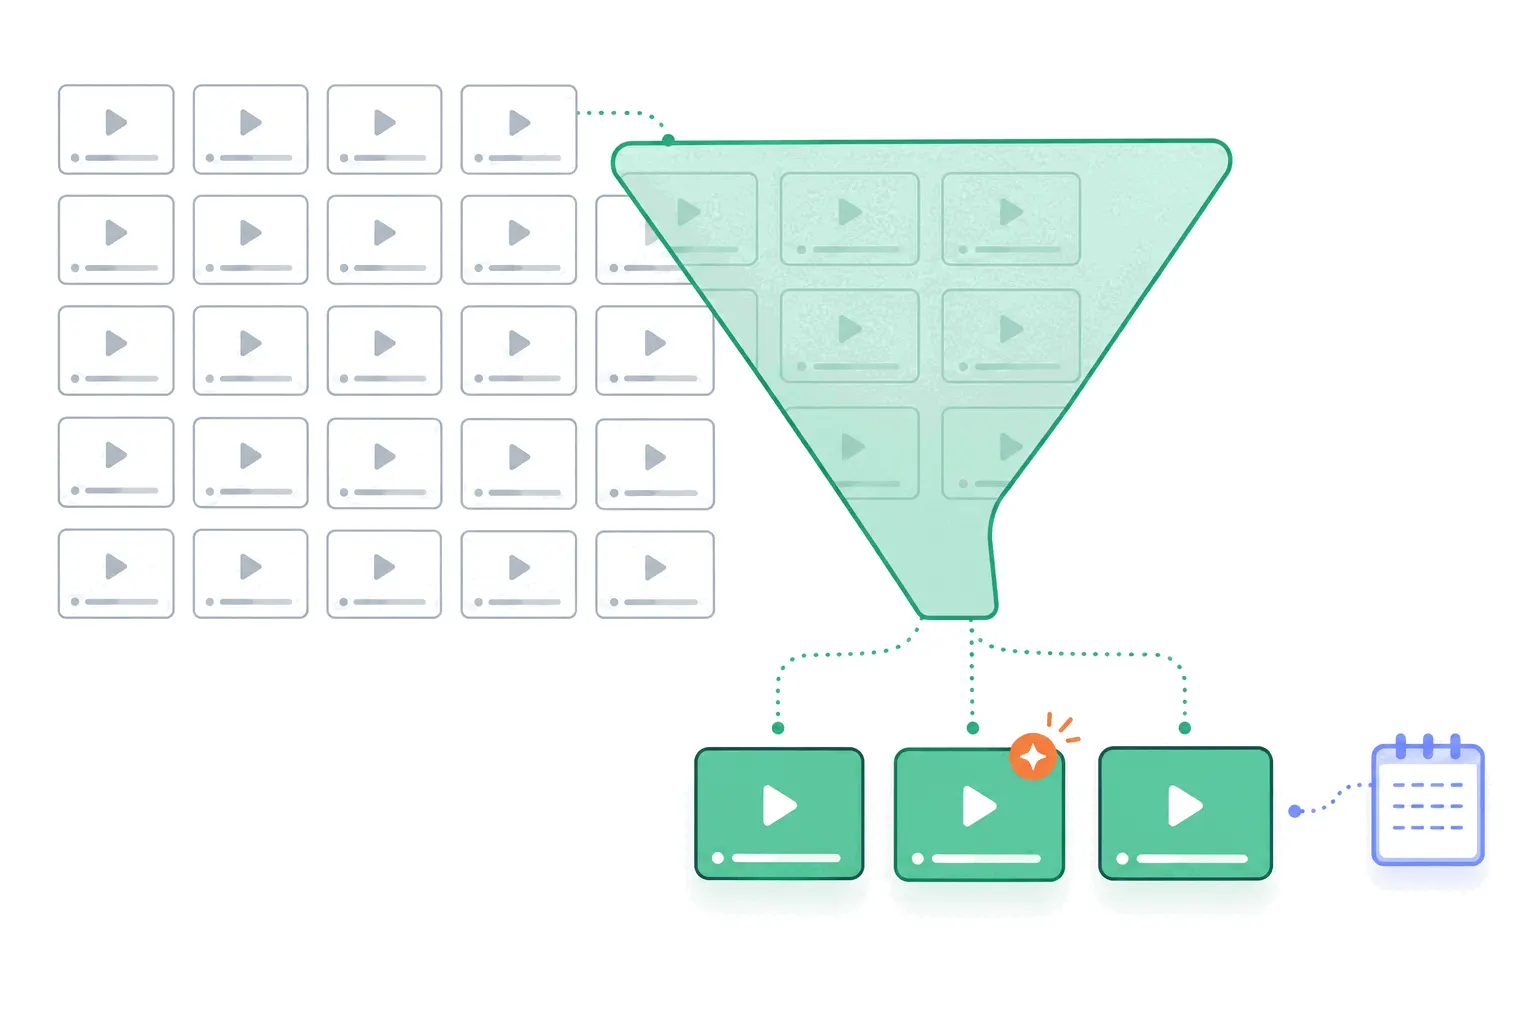
A replay tool piles up hundreds of recordings a week, and watching them in order teaches you nothing. The workflow that extracts answers: filter to the sessions that matter, watch a handful with one question, stop when patterns repeat.
How to forecast website traffic
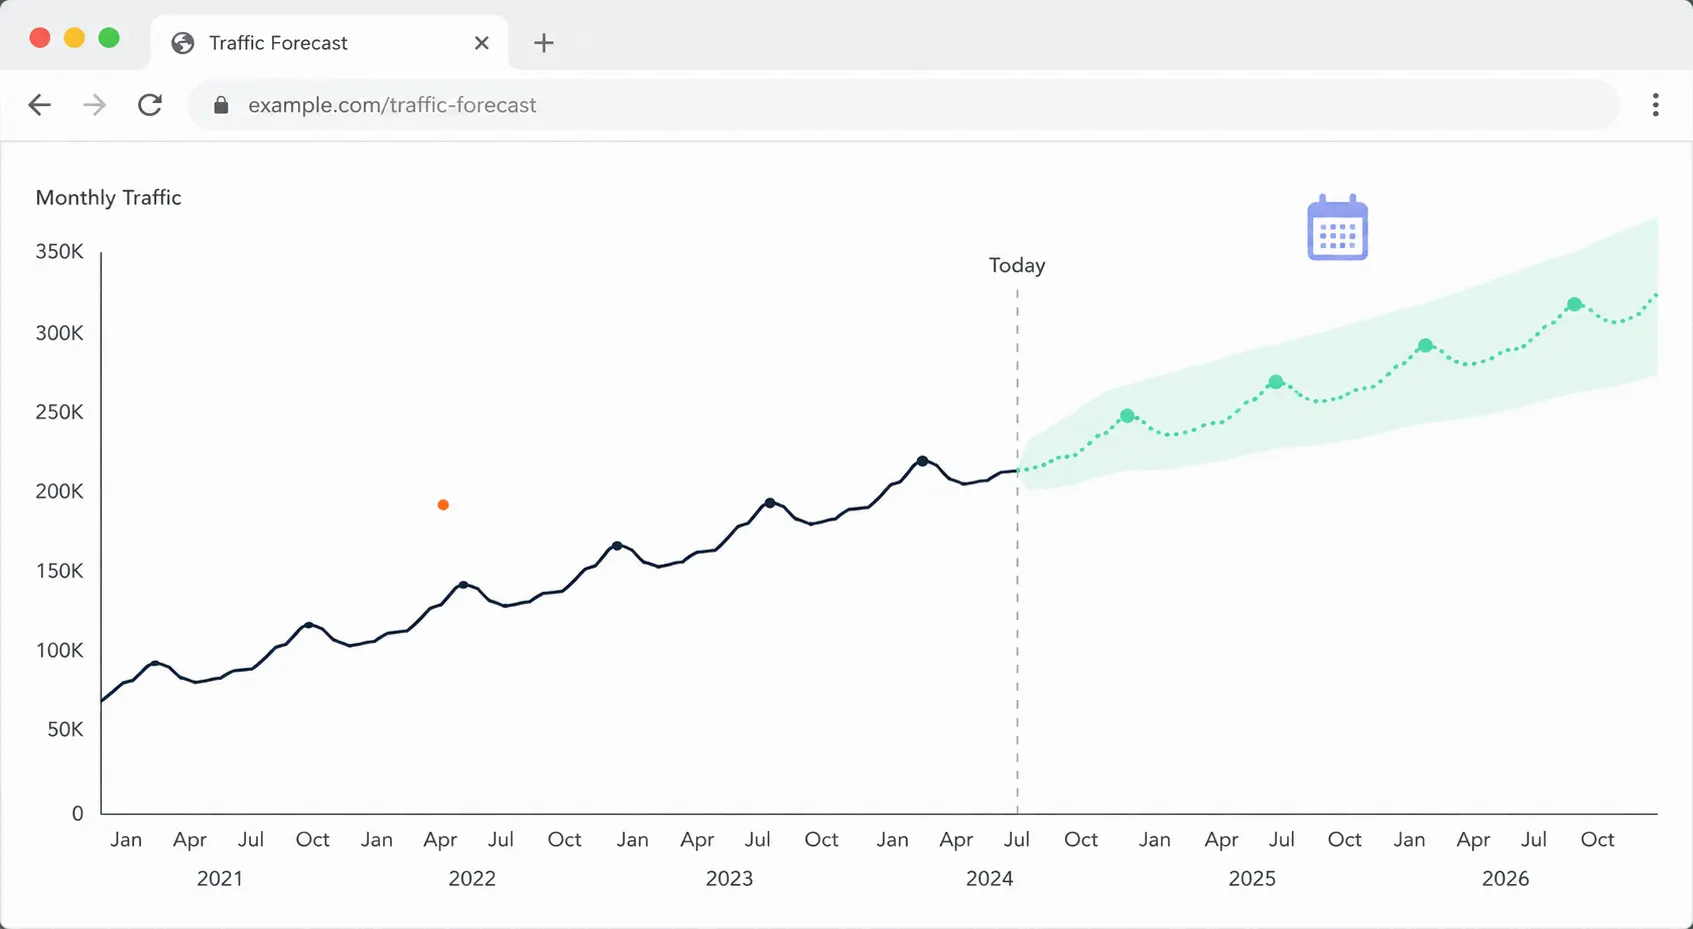
Next quarter's traffic is more predictable than it feels - if you forecast from your own data, keep the method simple, and attach a range instead of a single number. Here's how, with nothing more advanced than a spreadsheet.
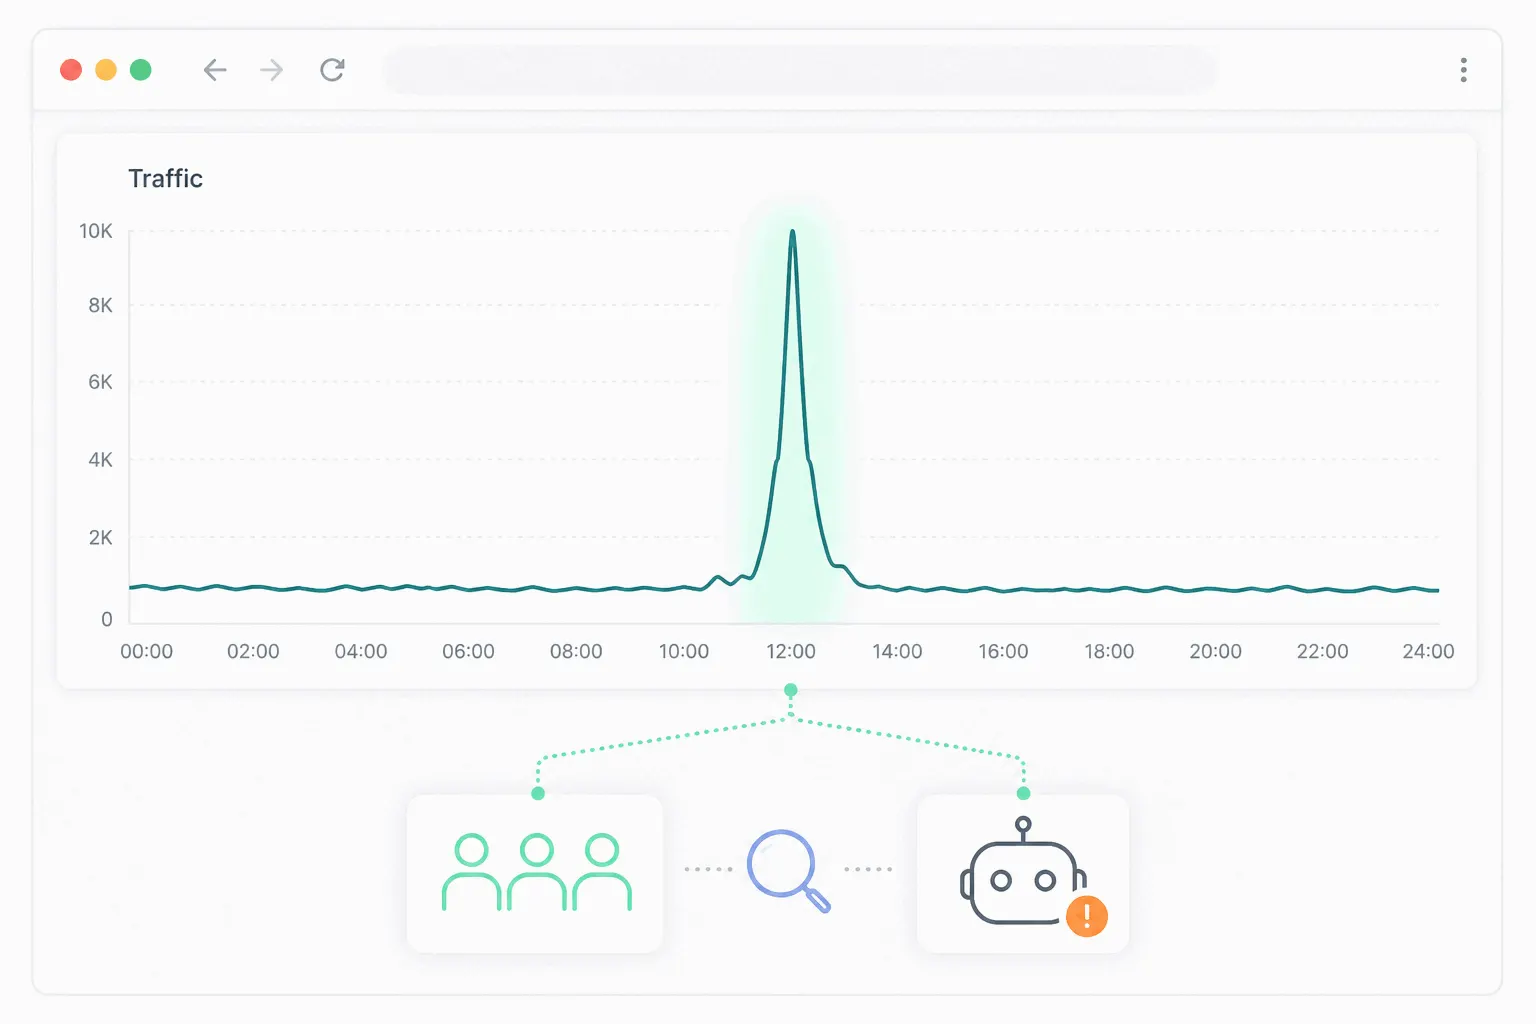
Why did my website traffic spike?
A sudden jump in visitors is either very good news or nothing at all - bots, spam and your own team produce spikes too. A short diagnosis that separates the two, finds the source, and tells you what to do before the wave passes.
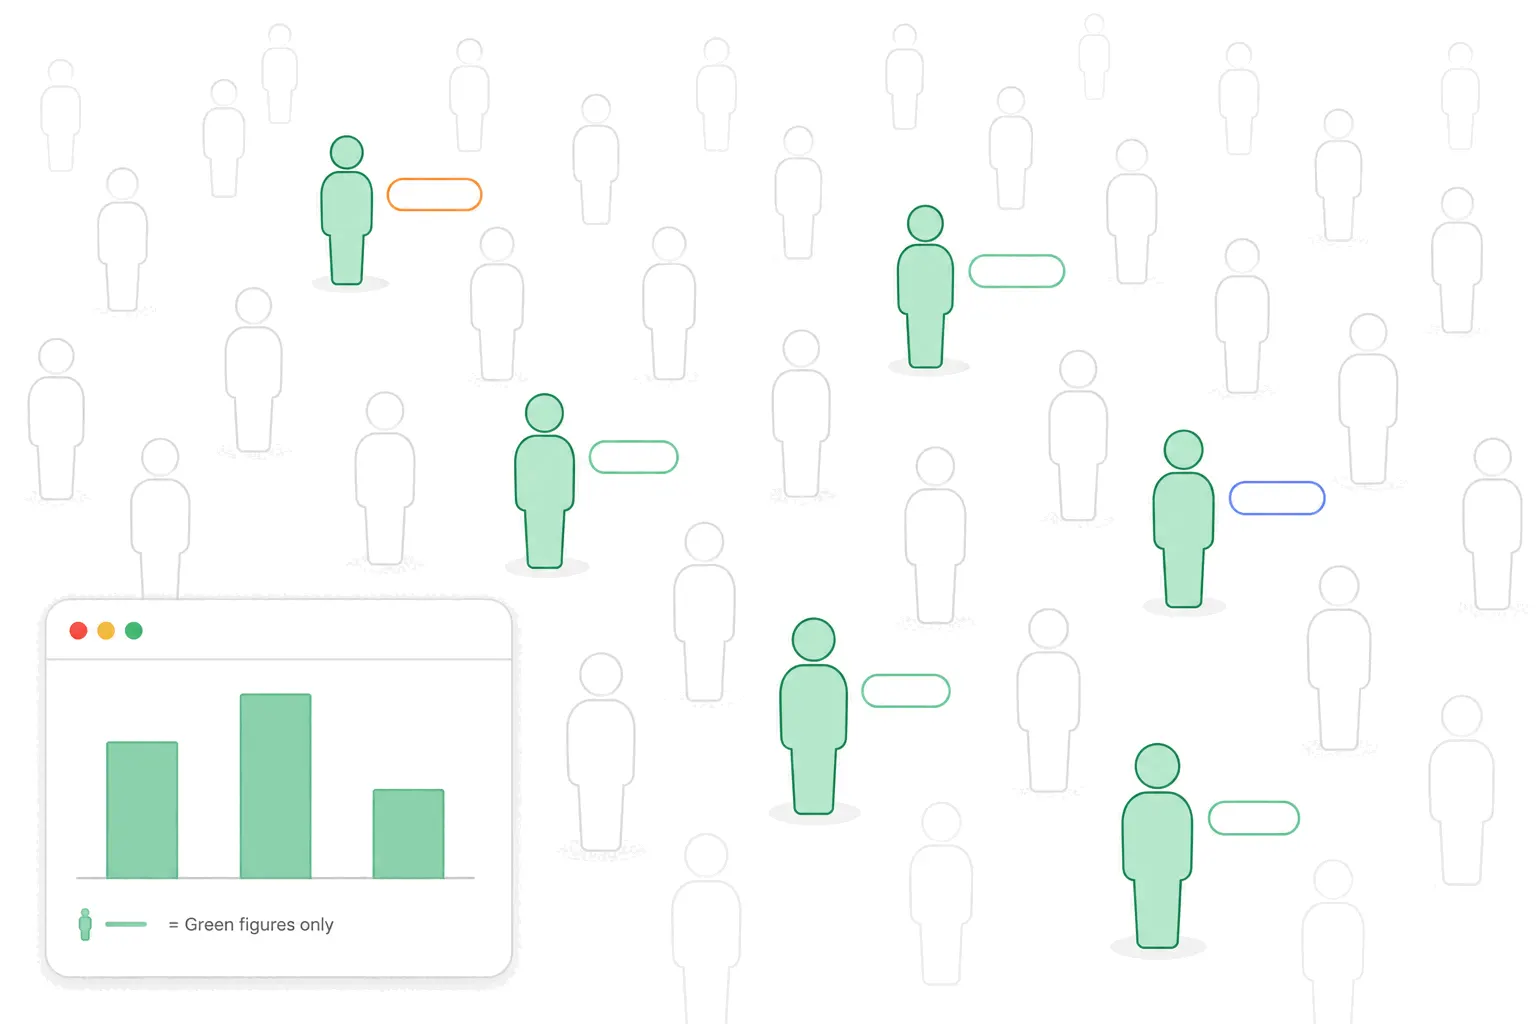
How to see the demographics of your website visitors
Age, gender, interests - analytics tools promise the who behind your traffic, and deliver less than the reports imply. What your analytics genuinely knows, where GA4's demographics come from, and the honest ways to learn more.
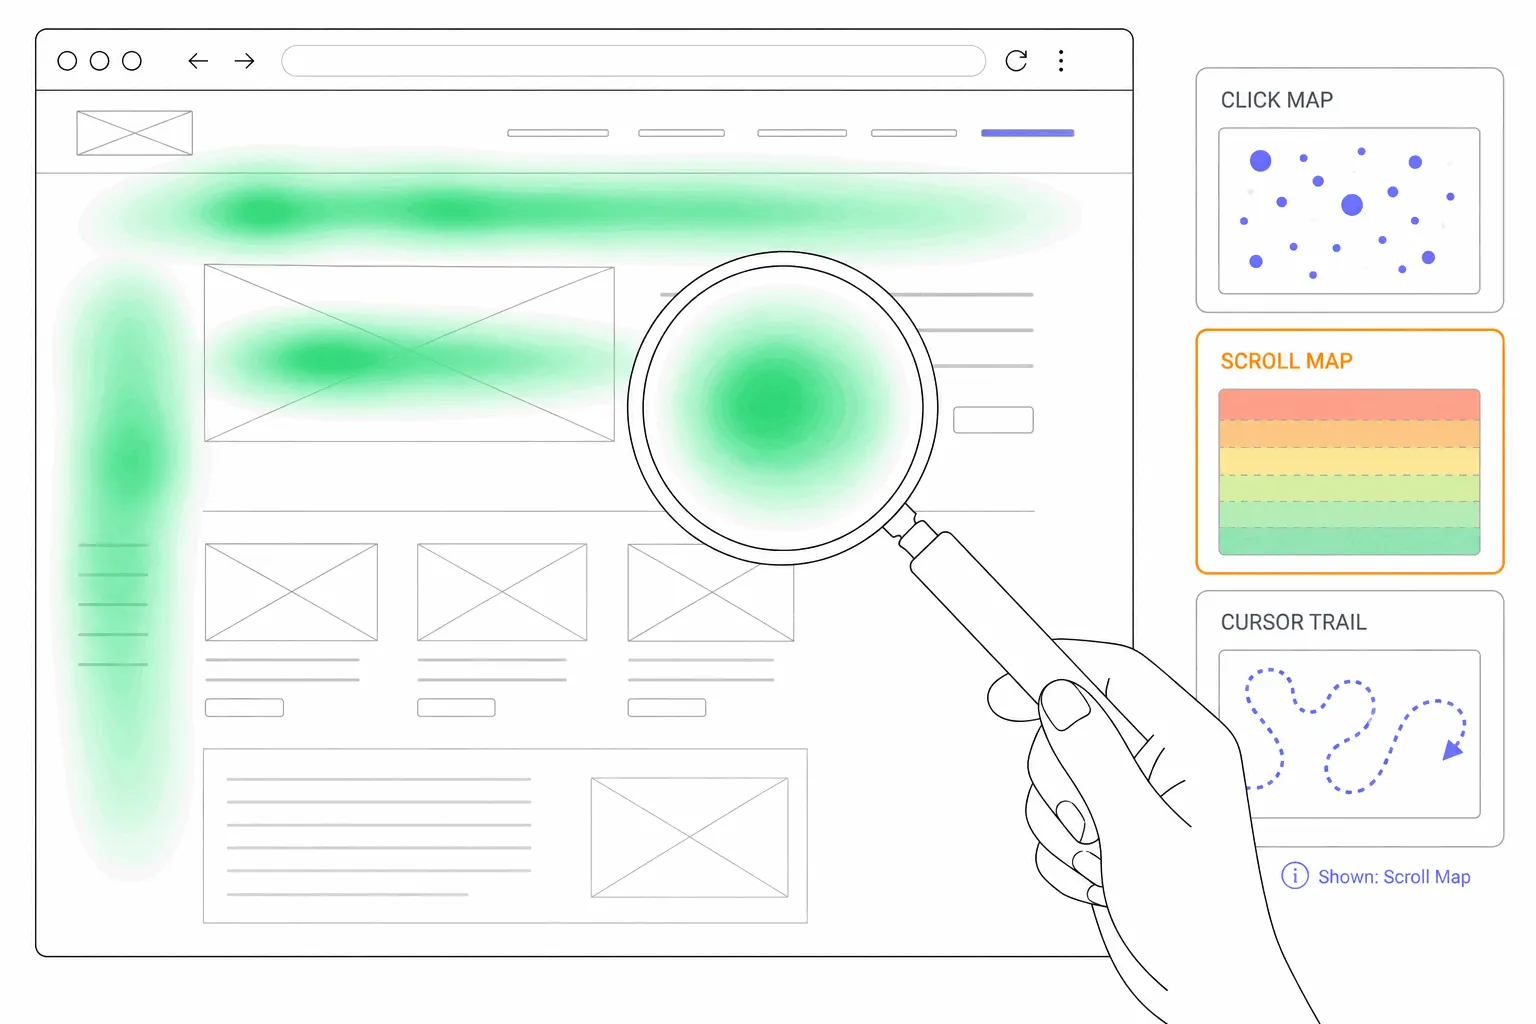
How to analyze a heatmap
The colors are the easy part. Reading a heatmap well means checking the sample, knowing the scanning patterns behind the hot spots, splitting by device before concluding anything - and knowing when the map has told you all it can.
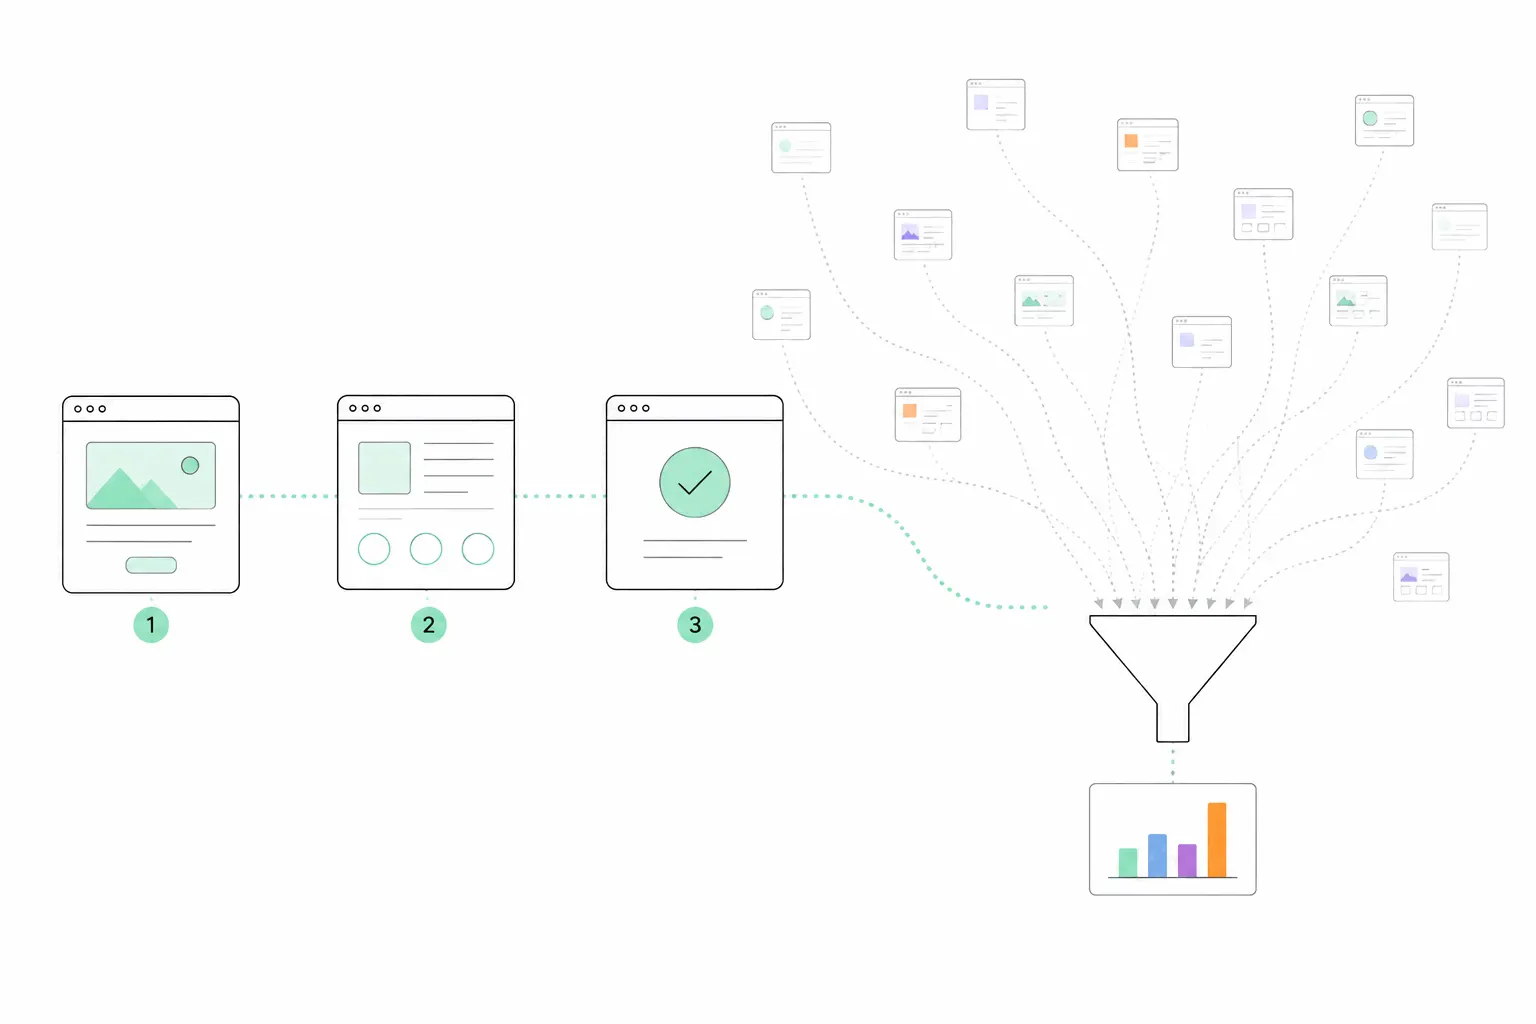
What is clickstream data?
Every visitor leaves a trail of pages and clicks. Your analytics records the trail on your site, and a quieter industry collects trails across the whole web to sell in aggregate. Both are called clickstream data, and the difference matters.
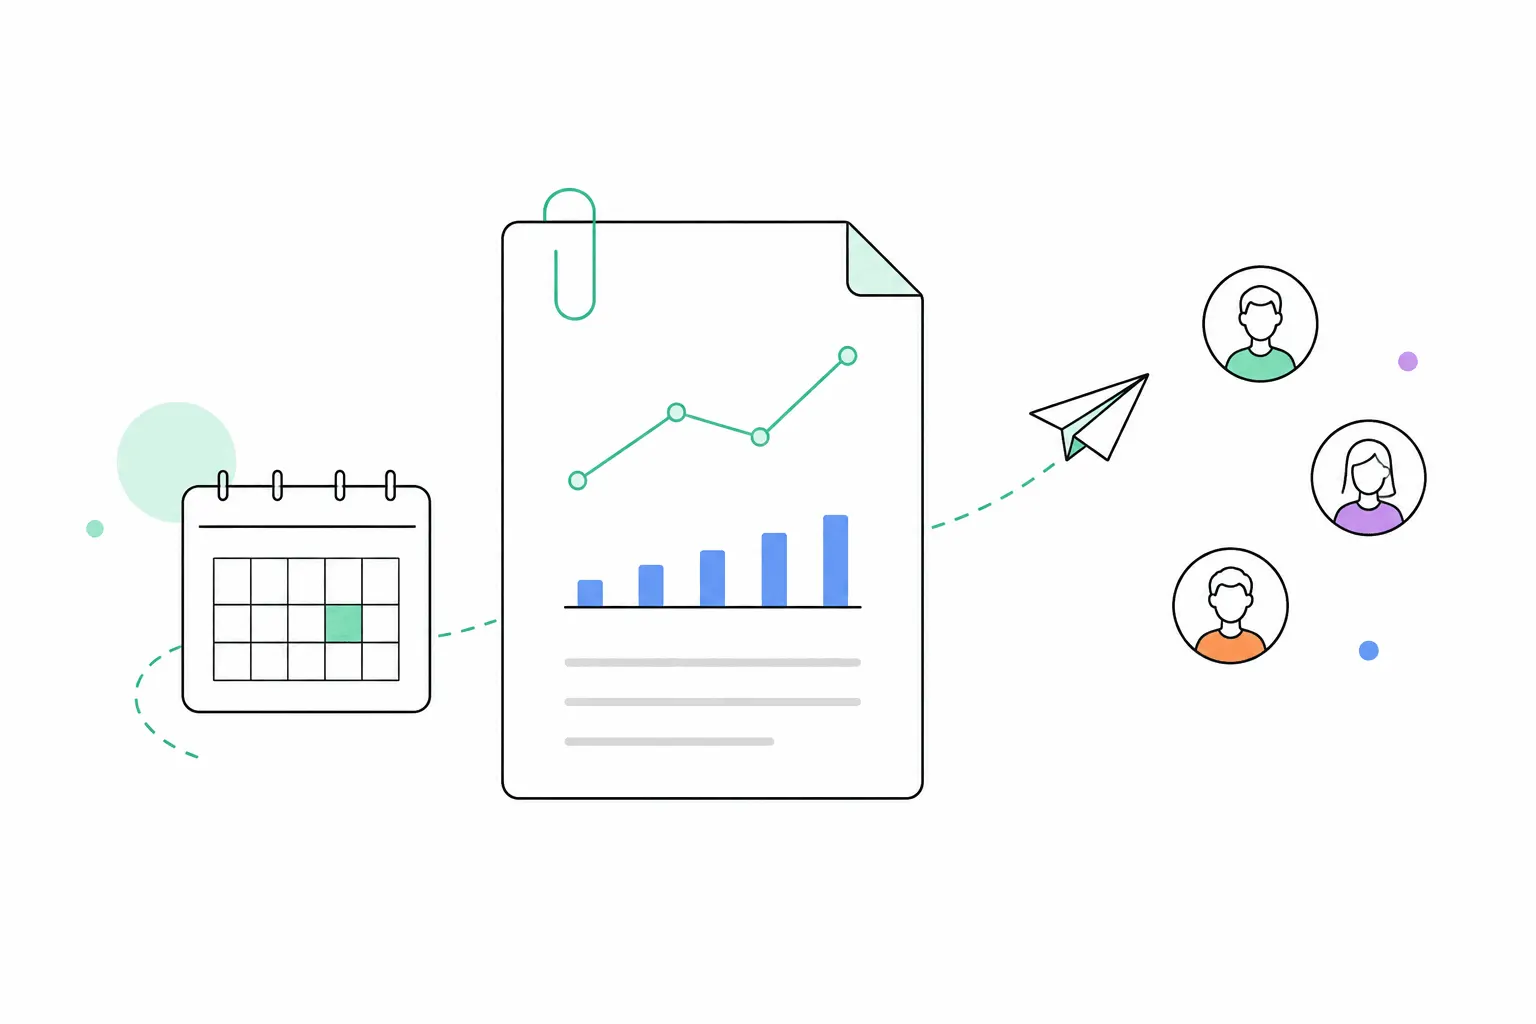
How to build a web analytics report
The periodic report is the analytics habit that reaches people who never log in: a one-page snapshot with the numbers, what they mean, and what to do next. What goes in one, and the free tools that send it for you.
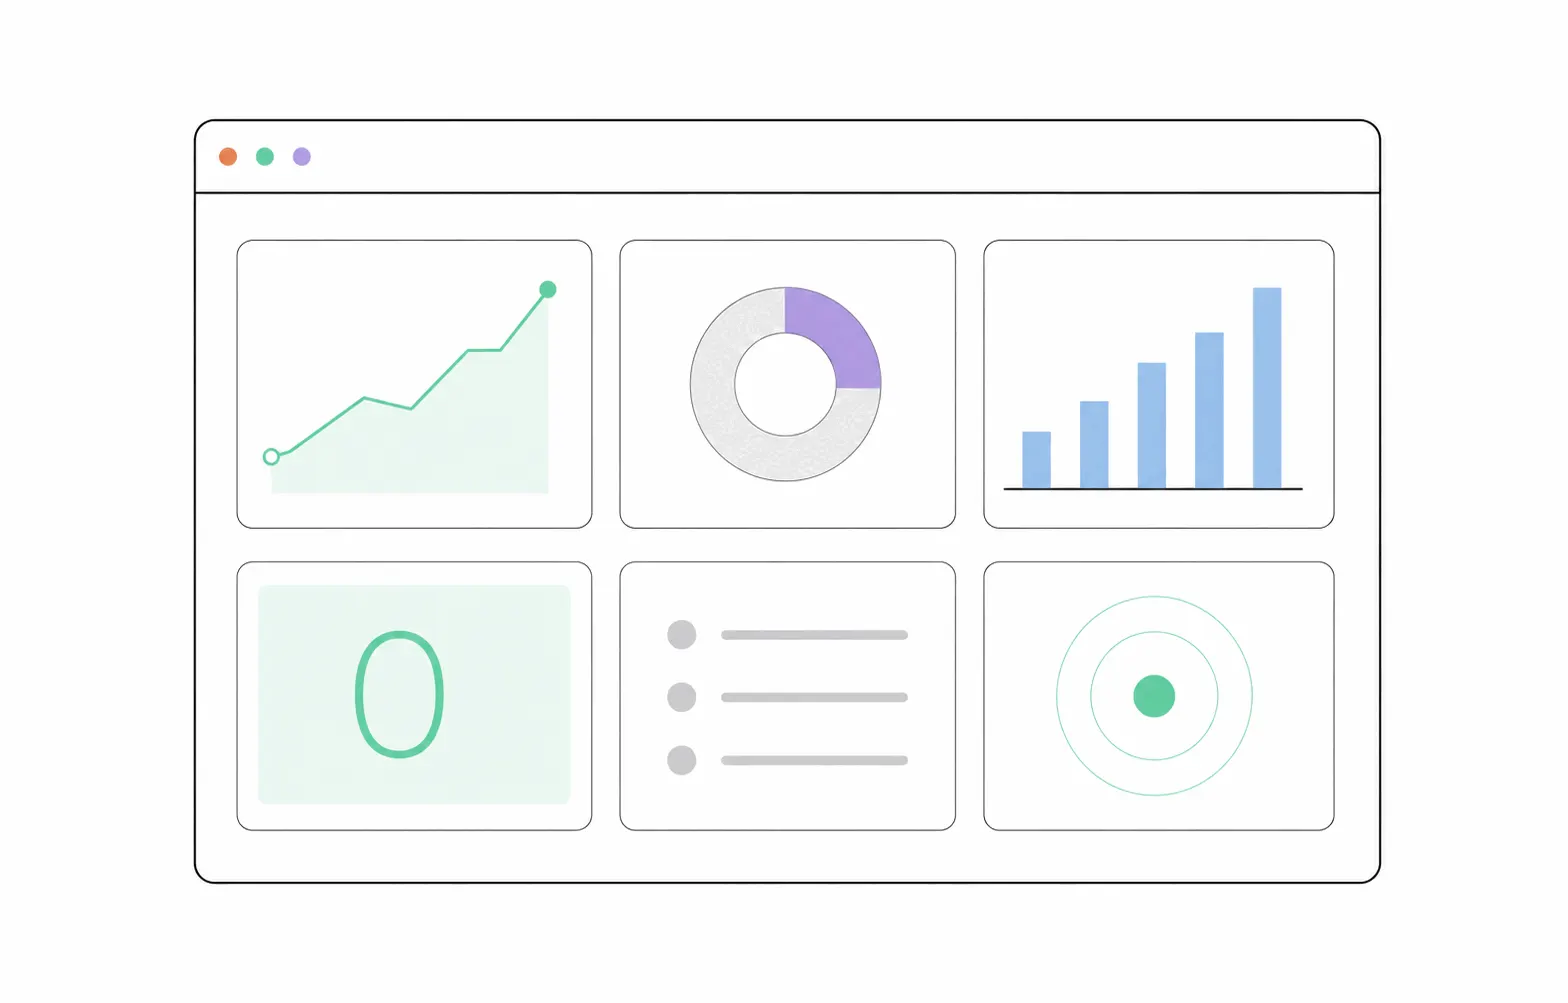
What is a website analytics dashboard?
The always-on view of your website's numbers. What a good dashboard shows, why most hold too many tiles, and the free routes to one - from GA4's built-in snapshot to a custom Looker Studio page.
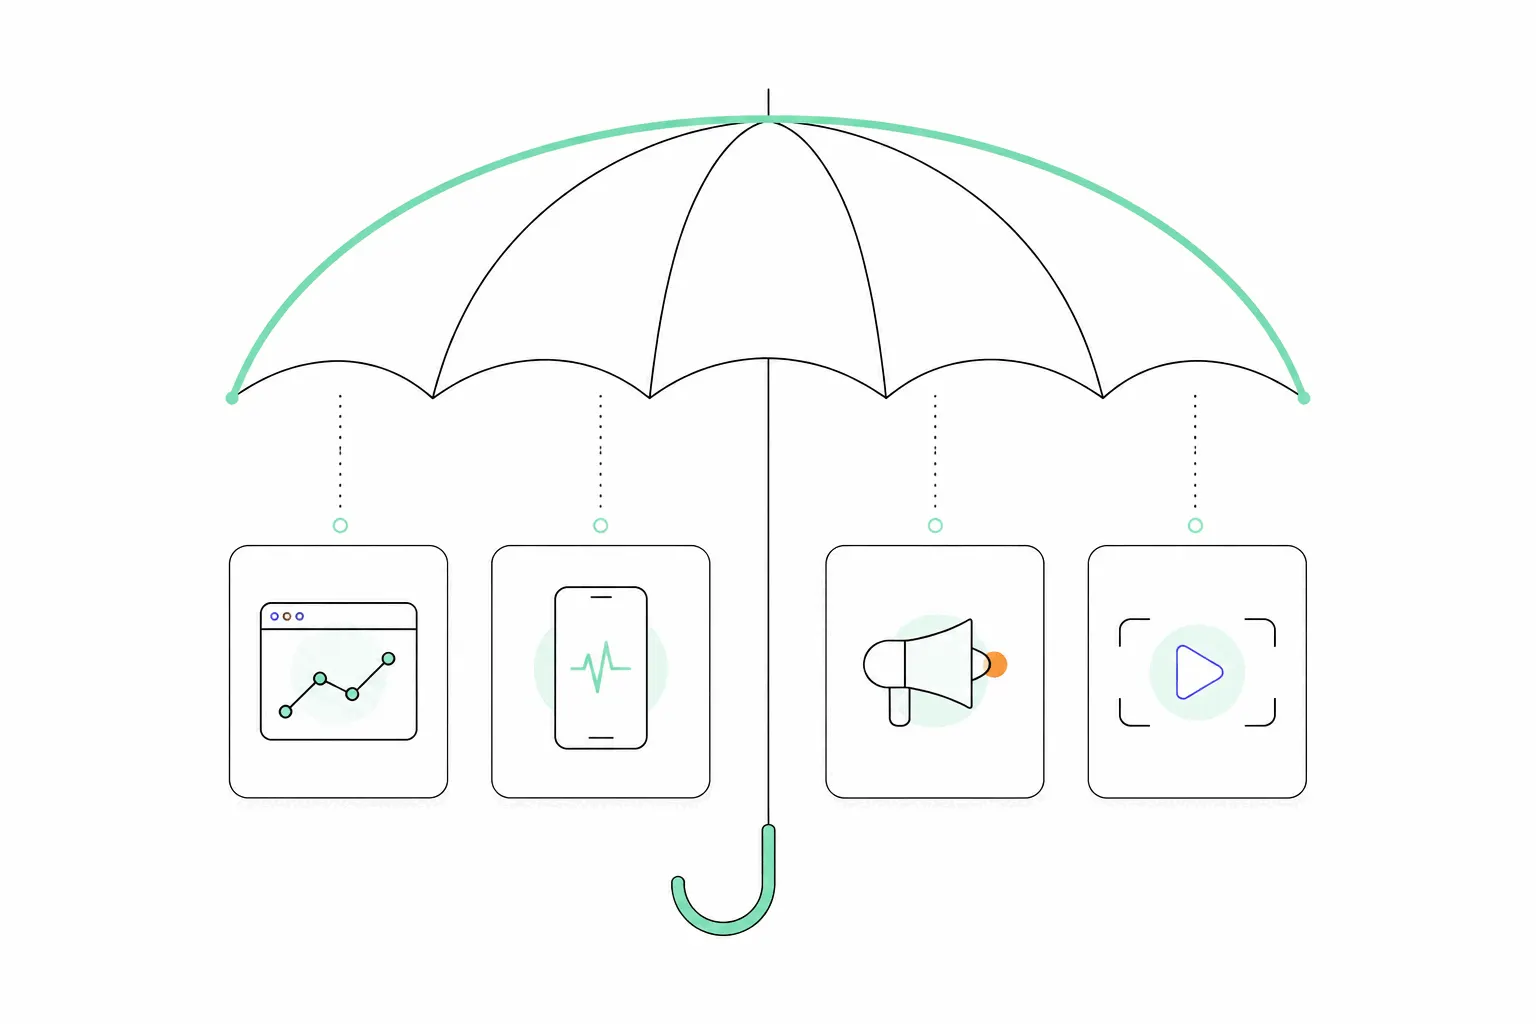
What is digital analytics?
The umbrella over web, product, marketing and experience analytics - what the term actually covers, why the field renamed itself, and which of the four you need for the problem in front of you.
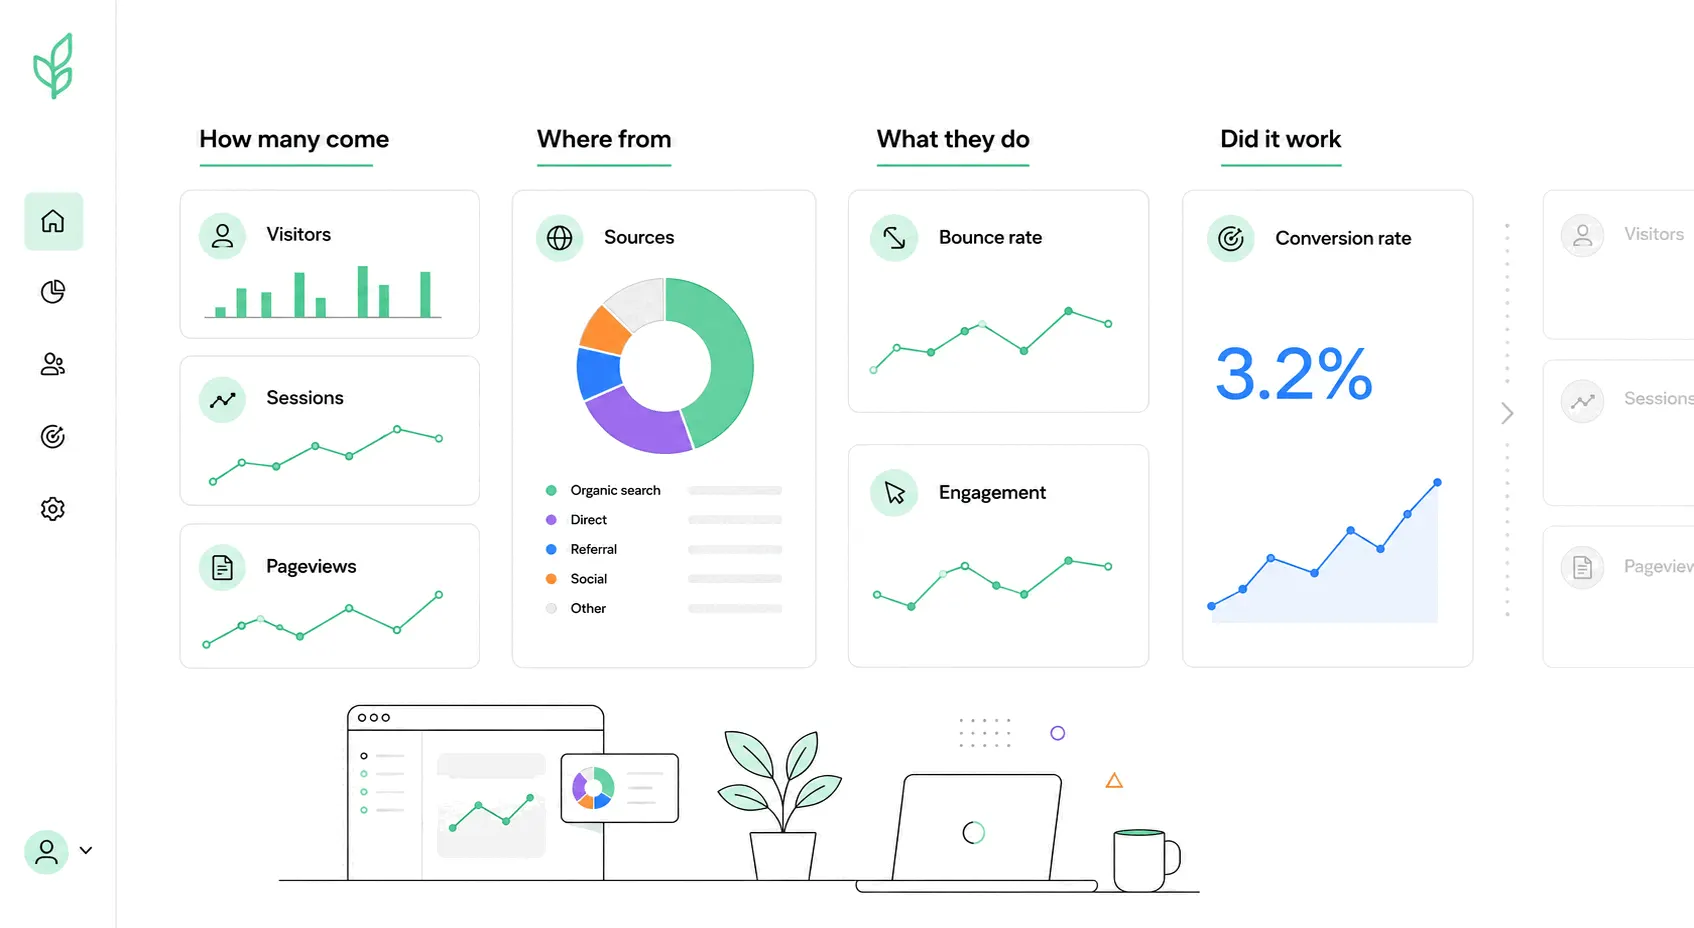
Website metrics to track (and the ones to skip)
Every analytics tool offers forty numbers; a working dashboard needs about a dozen. The metrics worth a regular look, sorted by the question each one answers.
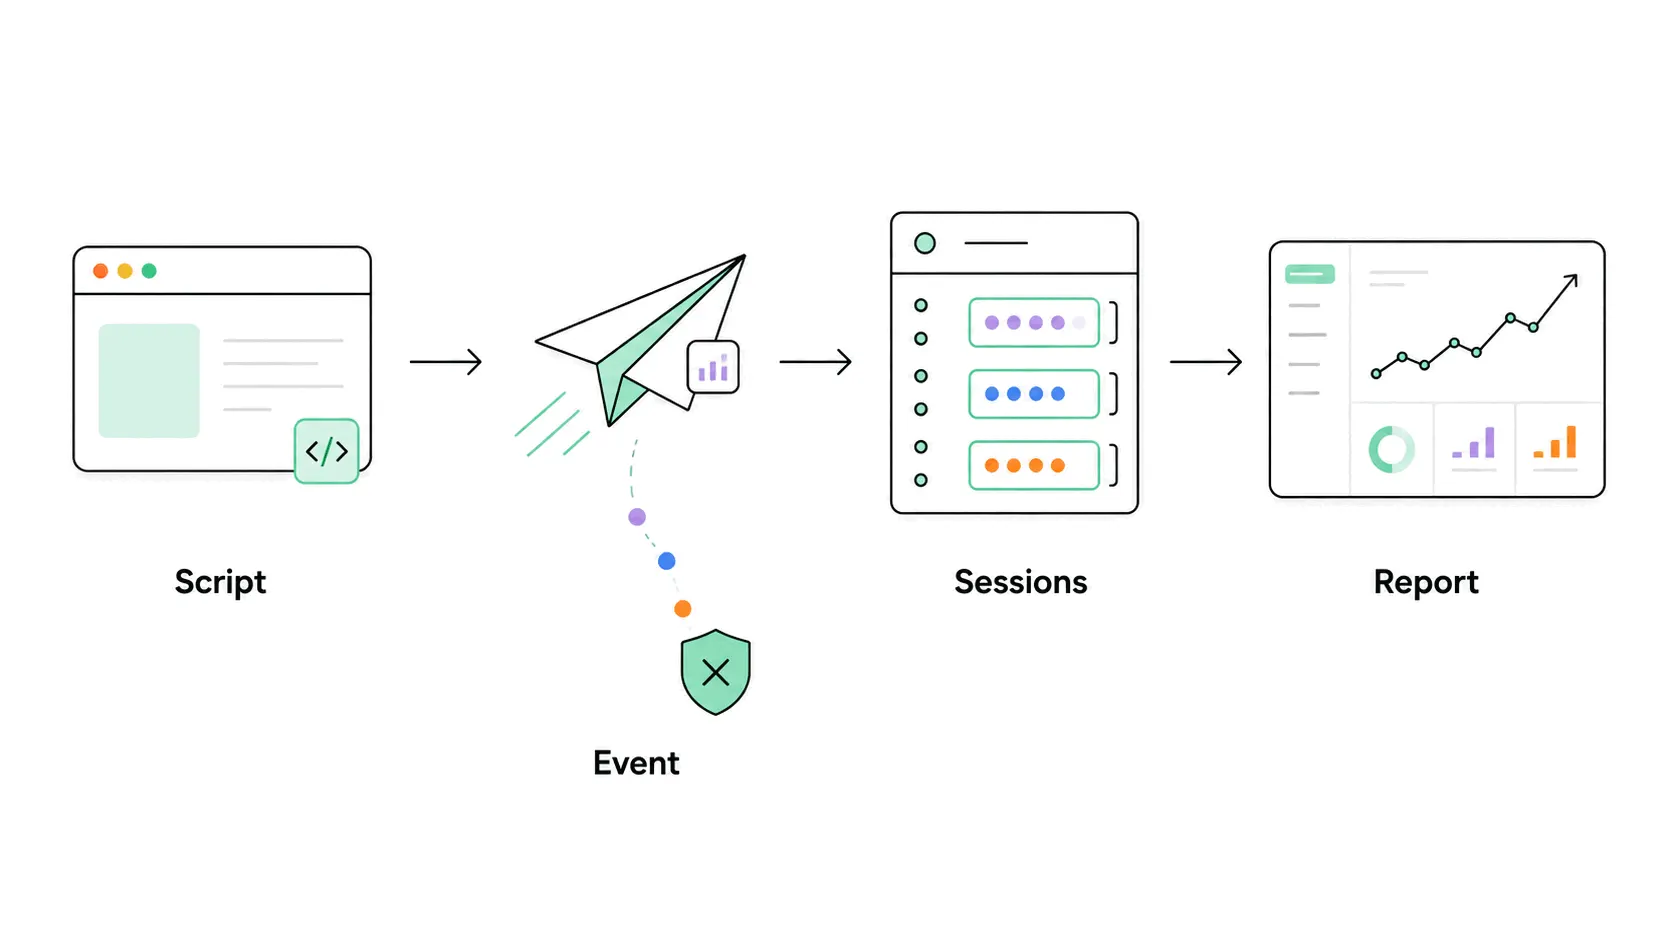
How does web analytics work?
What happens between a visitor opening your page and a number changing on your dashboard - the whole pipeline in plain English, including the steps where counting goes wrong.
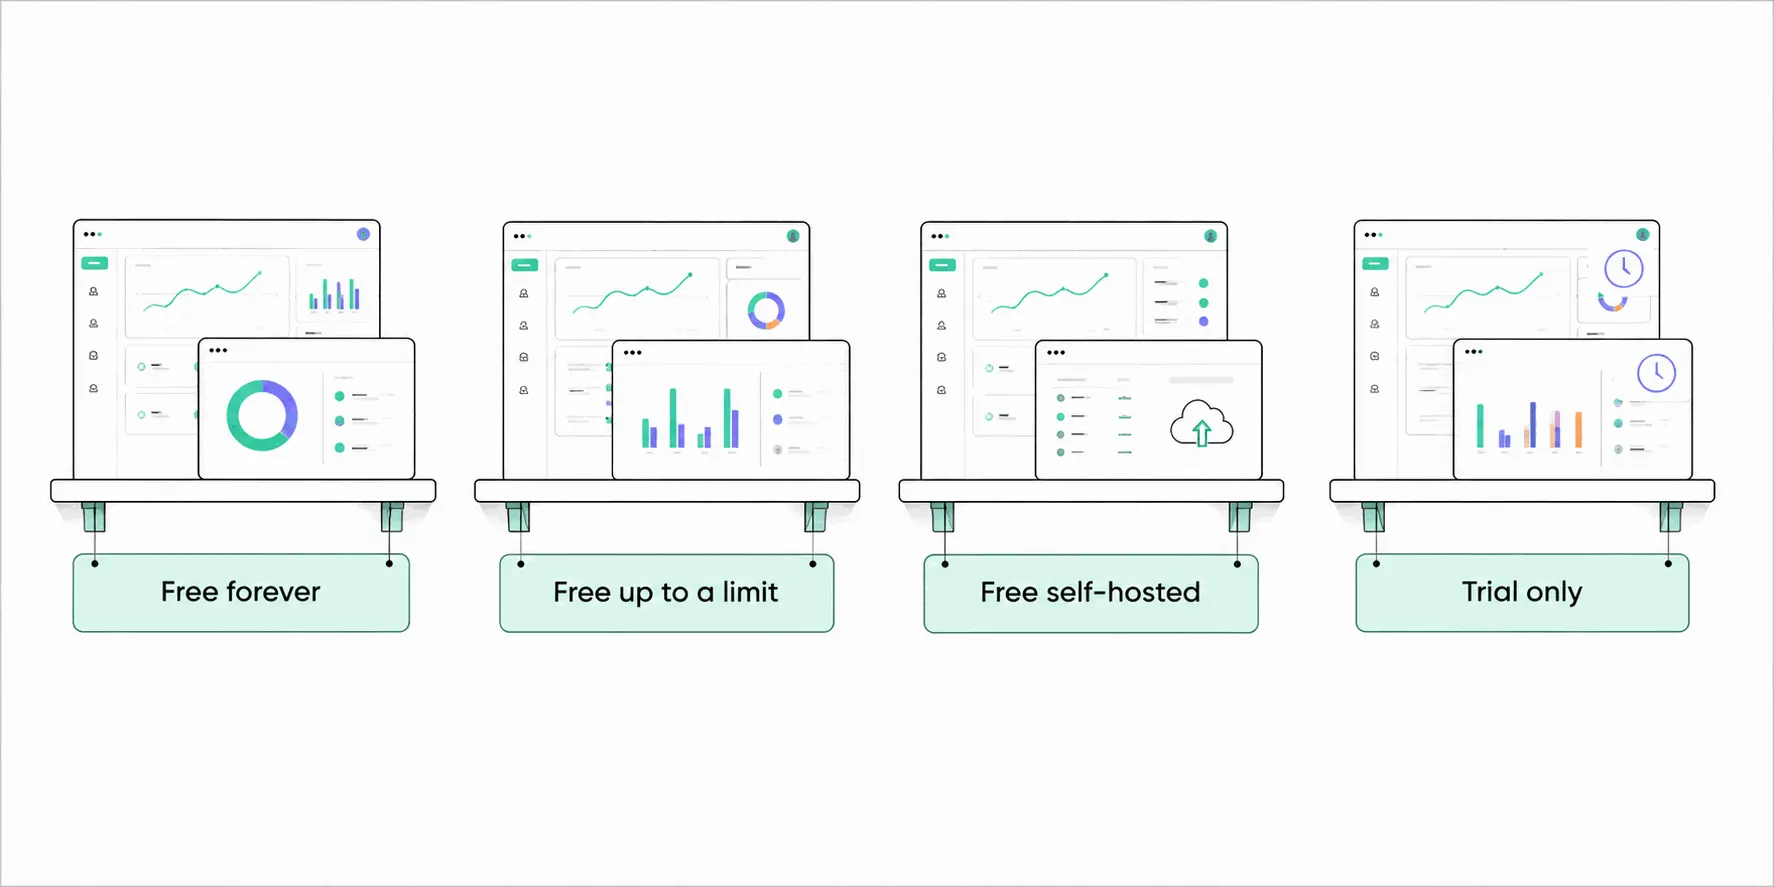
Free website analytics tools that are actually free
"Free" means different things in analytics: free forever, free to a ceiling, free if you host it yourself, or a trial in a costume. Eight tools, sorted honestly by which one they are.
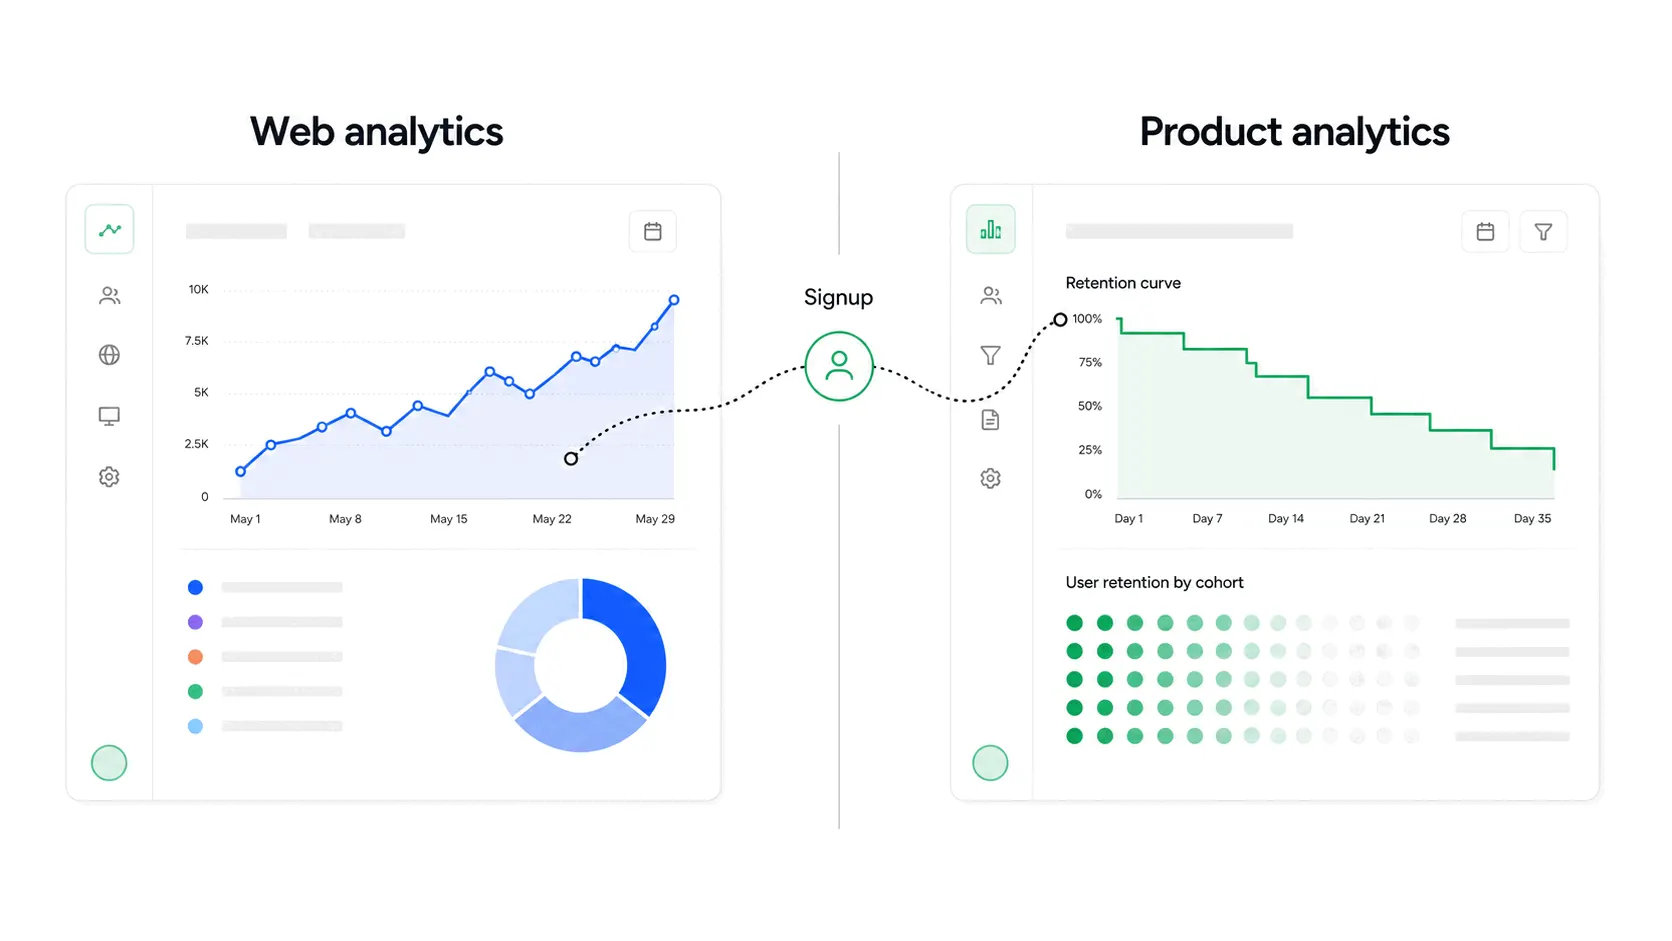
Web analytics vs product analytics: which one do you need?
One watches strangers arrive at your site, the other watches signed-in users stay or leave. Where the line between the two actually sits - and how to tell which side your questions live on.
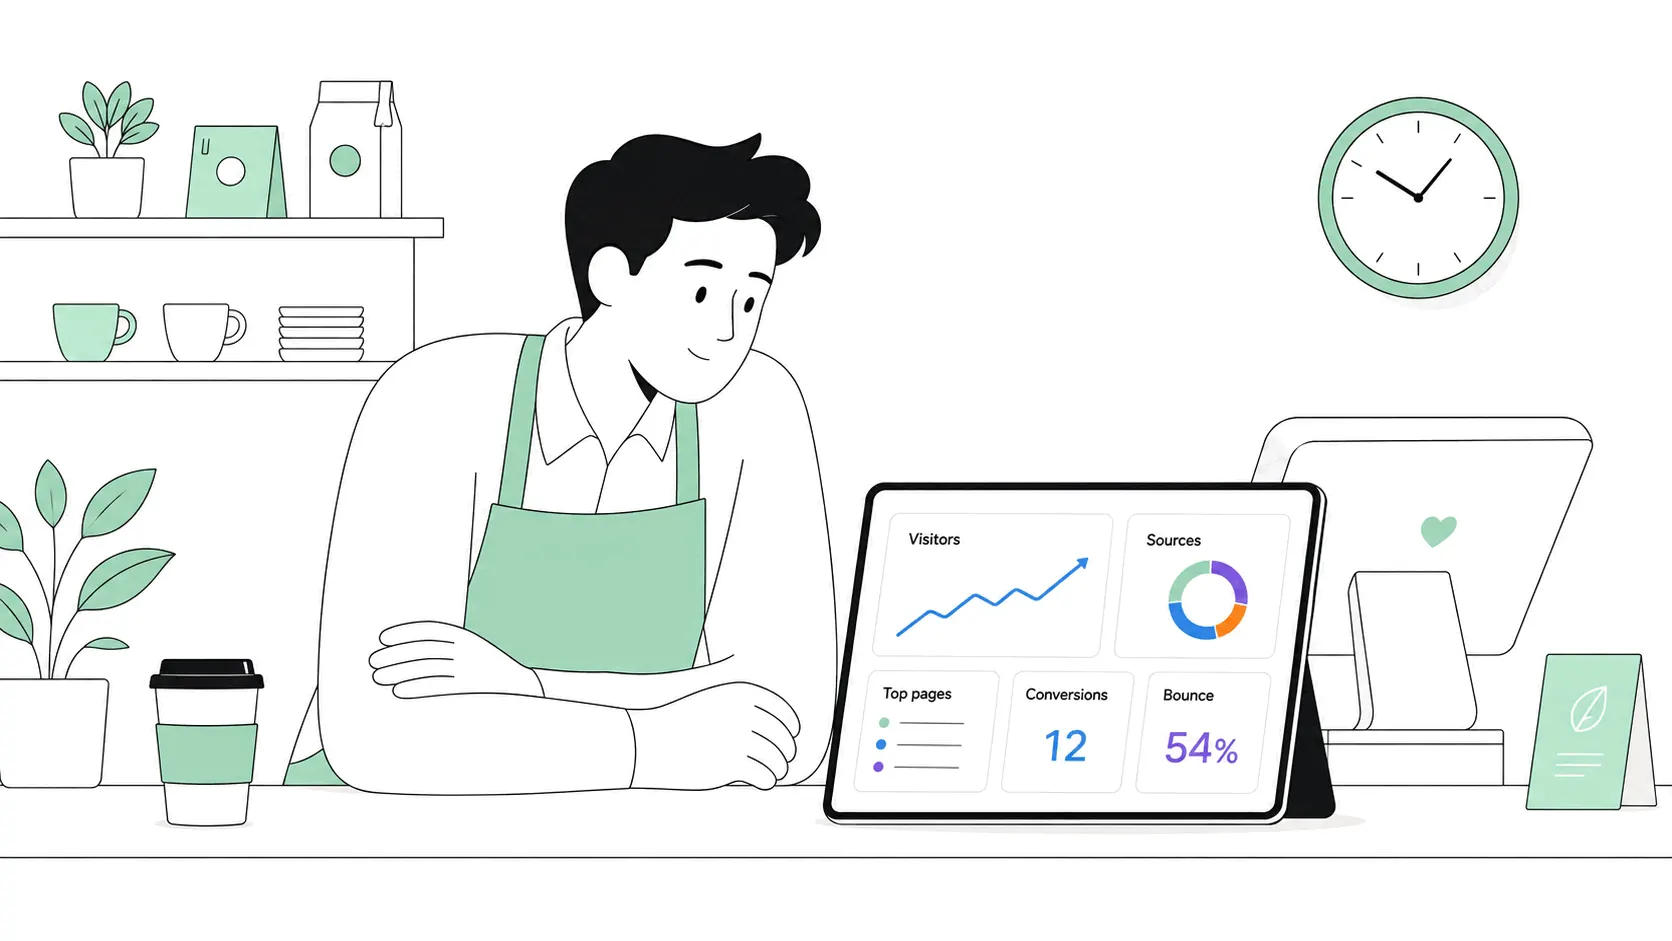
Website analytics for small business, without the analyst
Most small businesses have analytics installed and nobody who reads it. The handful of numbers worth an owner's time, a twenty-minute weekly routine, and how to pick a tool that doesn't fight back.

What is organic traffic?
Unpaid clicks from search results. The referrer check behind the label fails often enough that some organic gets filed as direct, the search terms moved to Search Console years ago, and AI answers are now cutting into the clicks themselves.

How to track website visitors
Four ways to count the people on your site - the snippet, the cookieless hash, the server log and Search Console - how each one works, and what each one misses.

What is a click map?
Every click and tap on a page, painted onto one picture of it. What dead clicks and rage clicks diagnose, and when a hotspot means nothing at all.

Best heatmap tools in 2026 (free and paid)
Six heatmap tools compared on the limits that decide the experience: free tiers, retention windows, pricing models - and one popular tool that's shutting down.

What is website behavior analytics?
The analytics layer that watches what visitors do on the page - heatmaps, replays, funnels, frustration signals - rather than counting how many arrived. What it covers, and what the security industry means by the same phrase.
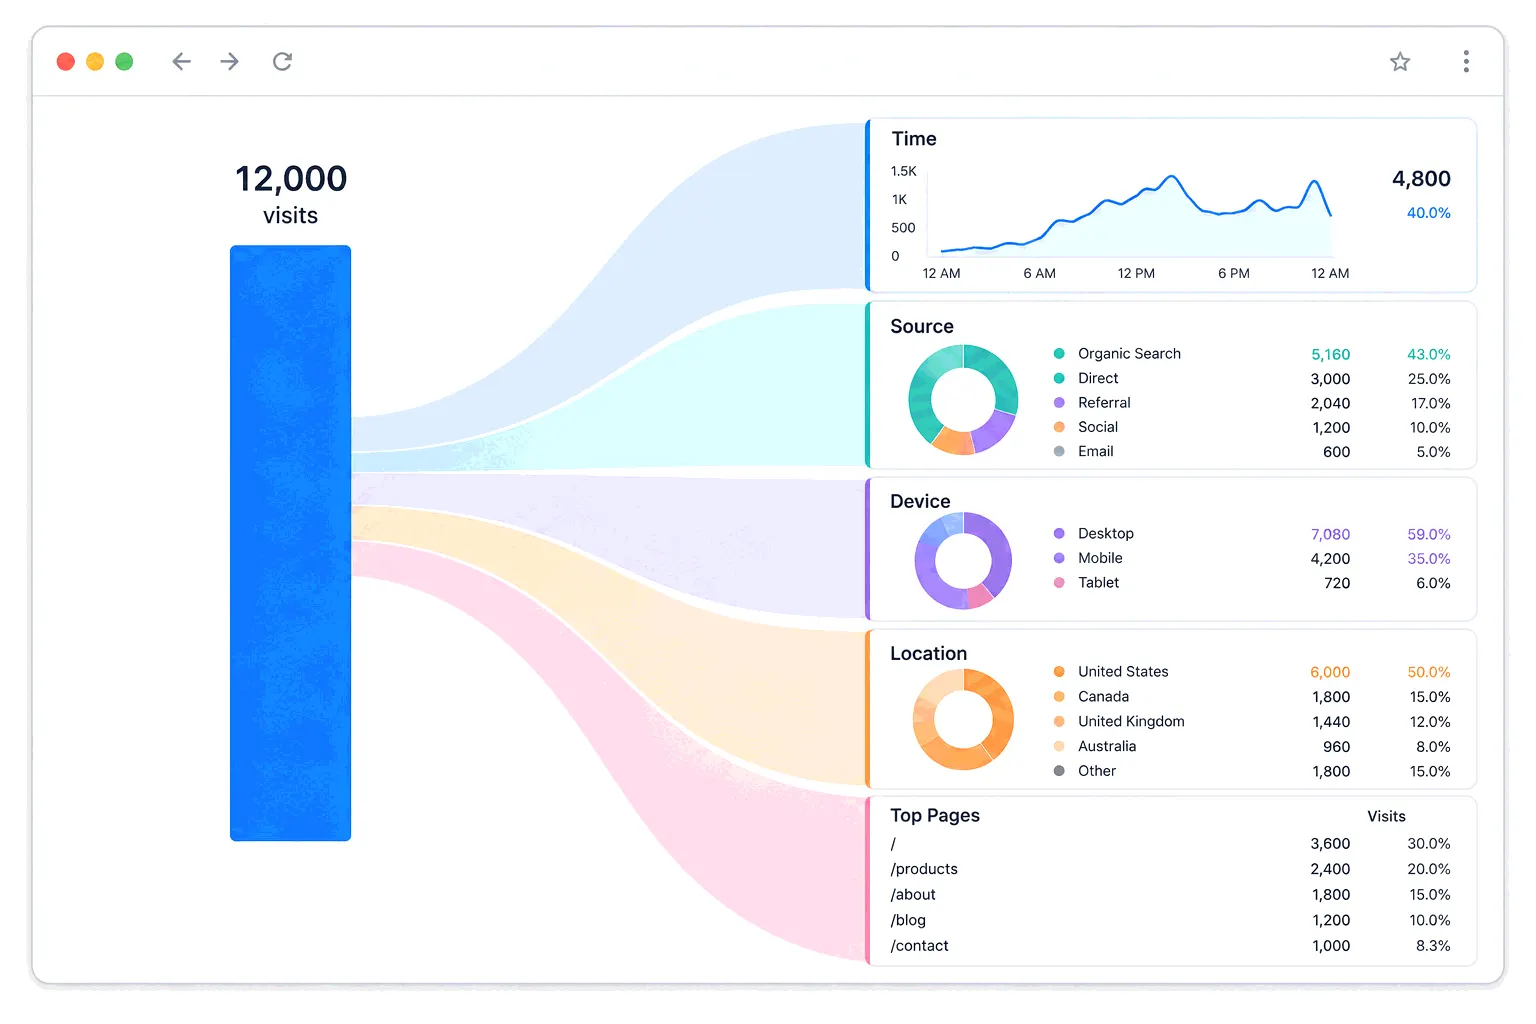
How to analyze website traffic
Checking your numbers takes a minute; making them say something is the actual work. A method for traffic analysis - the splits that matter, honest comparisons, and the junk to subtract first.
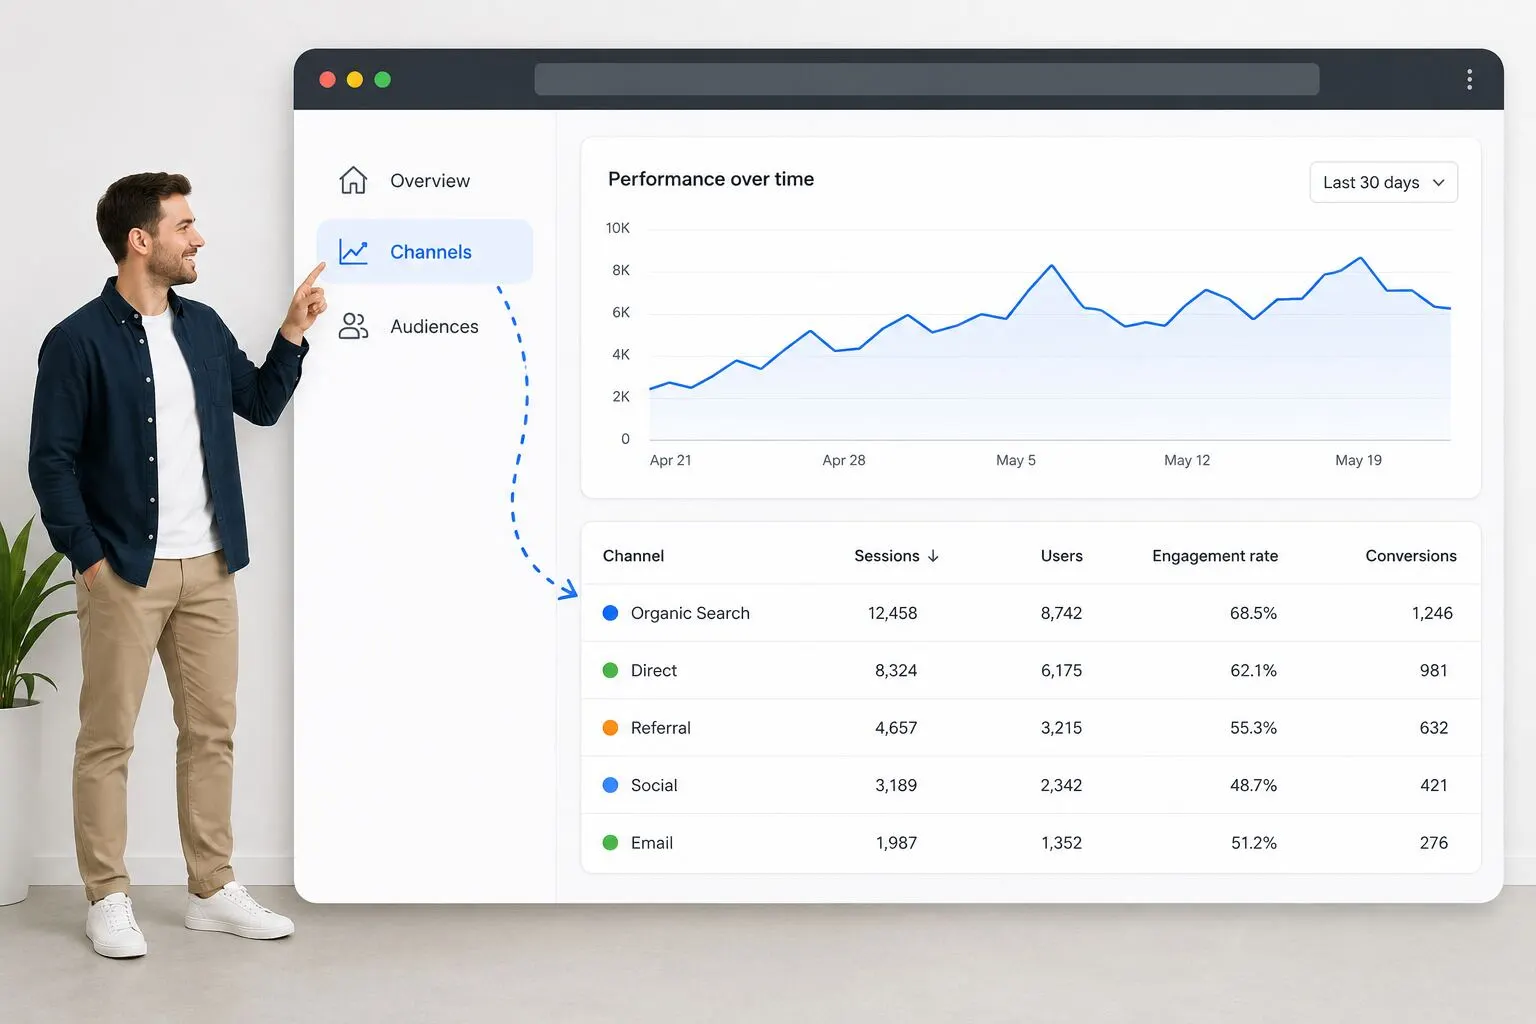
How to check website traffic in Google Analytics
Where the traffic numbers actually live in GA4 - the one report that answers most questions, what the metrics mean, and the delays and gaps to know about before you trust the numbers.
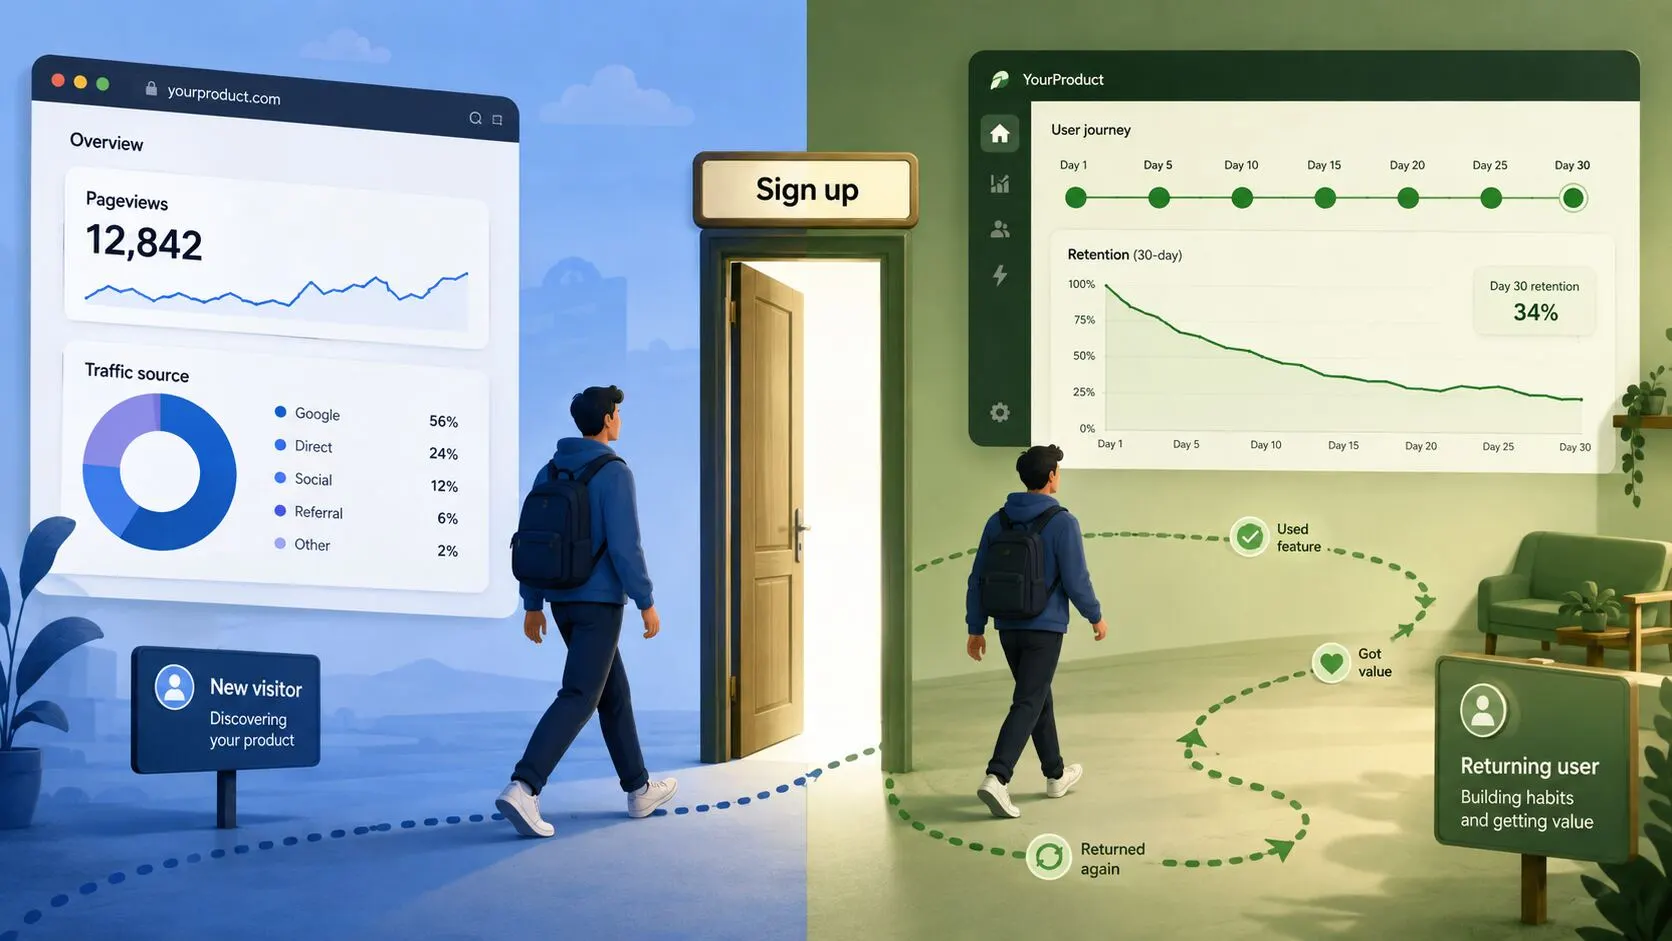
What is product analytics? A plain-English guide
Web analytics watches how strangers find your site; product analytics watches whether signed-in users stay. What the term covers, the concepts behind it, and when a site actually needs it.
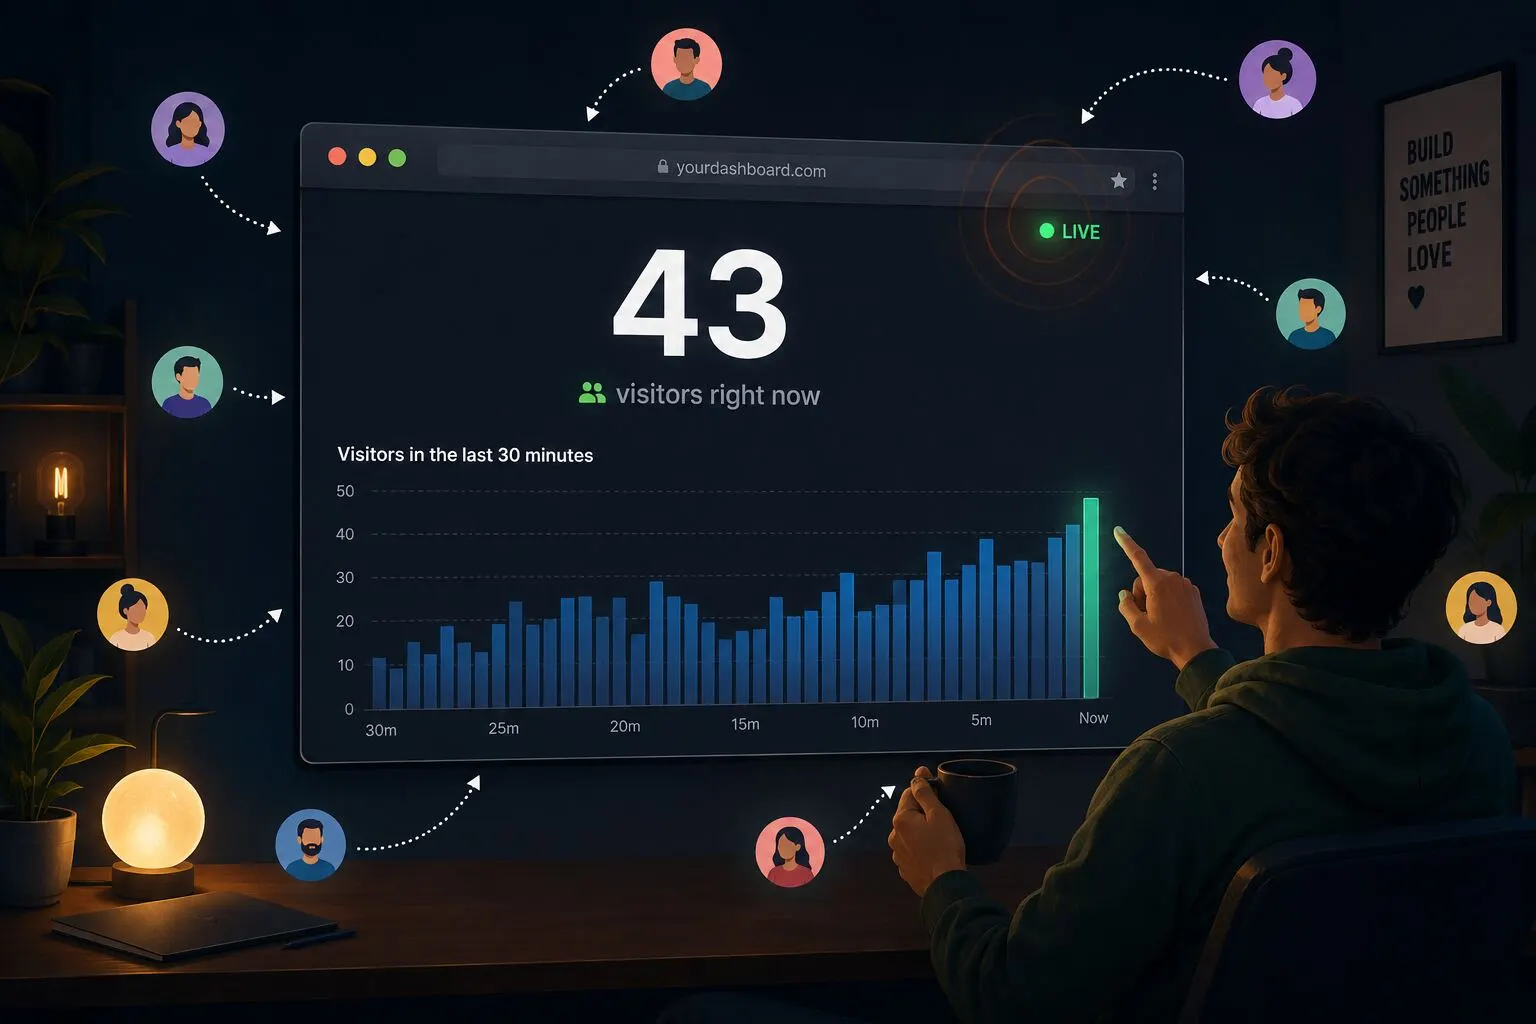
How to see live traffic on your website
Watching visitors move through the site as it happens - where GA4 hides its live view, how fresh "real time" actually is, and the few moments when watching live genuinely helps.
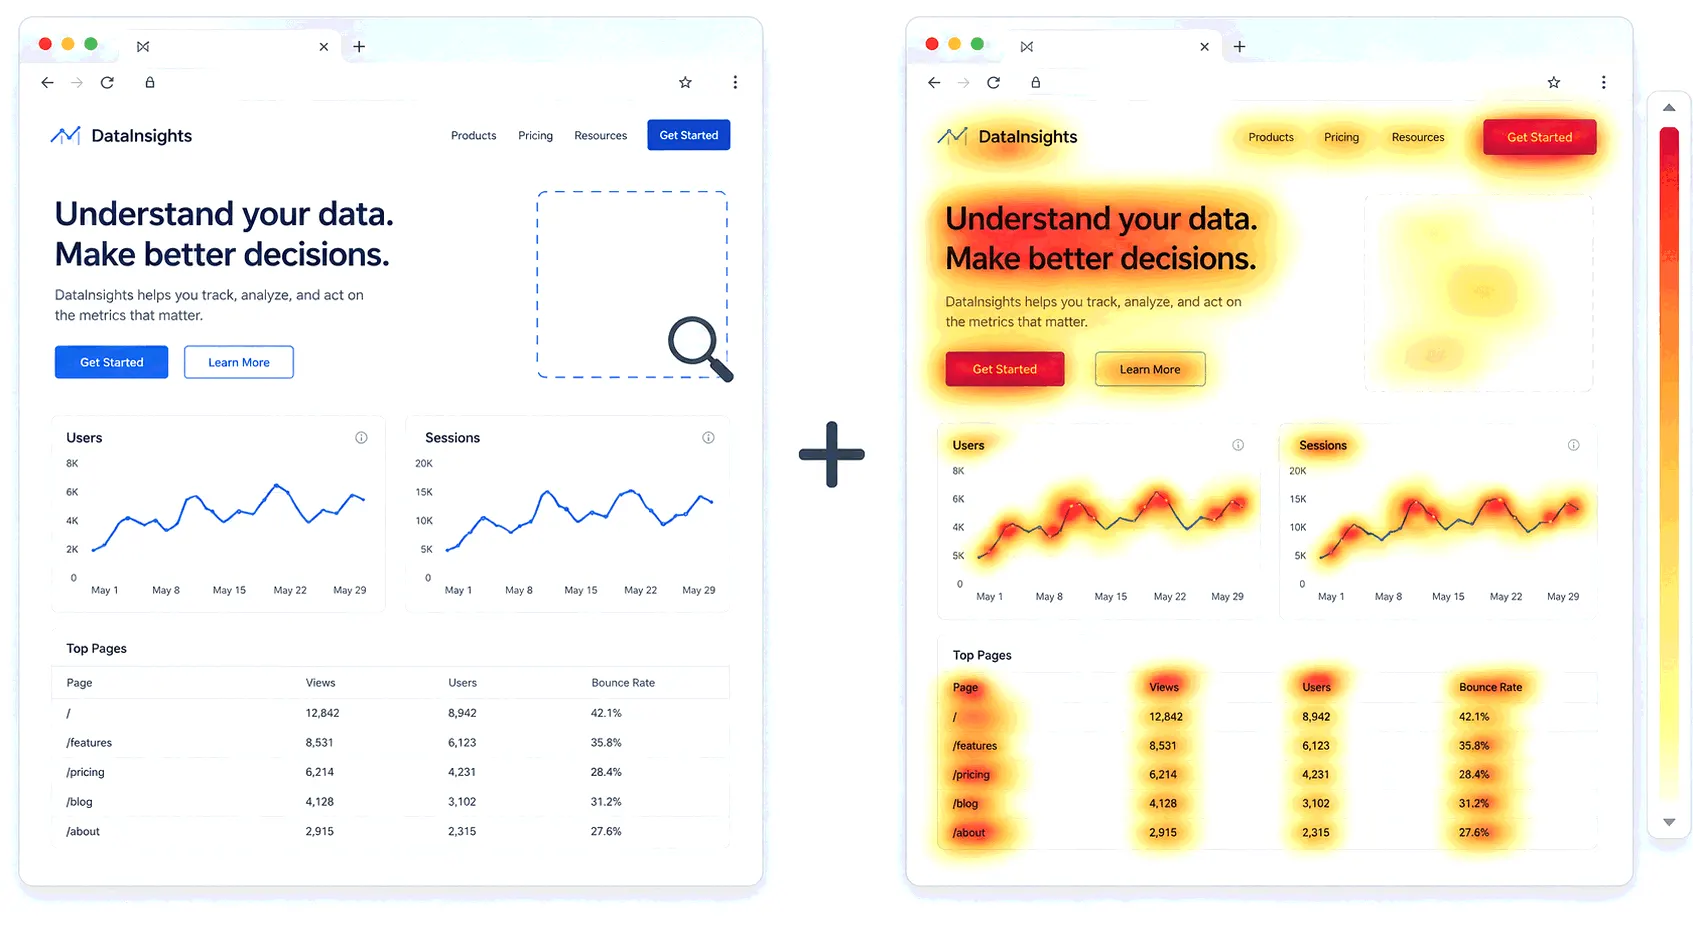
Does Google Analytics have heatmaps?
No - GA4 ships no heatmap, and Google retired its last click-overlay years ago. What GA4's own events can approximate, and how sites actually get heatmaps alongside it.

Form abandonment: why visitors quit your forms
Roughly half the people who start filling in a form never send it. What makes them quit, which fields scare them off, and how to find the exact question where your form dies.

What is ecommerce analytics?
Ecommerce analytics ties every visit to what it was worth in orders and revenue. Which numbers matter for a store, where the data comes from, and how to read it without a data team.
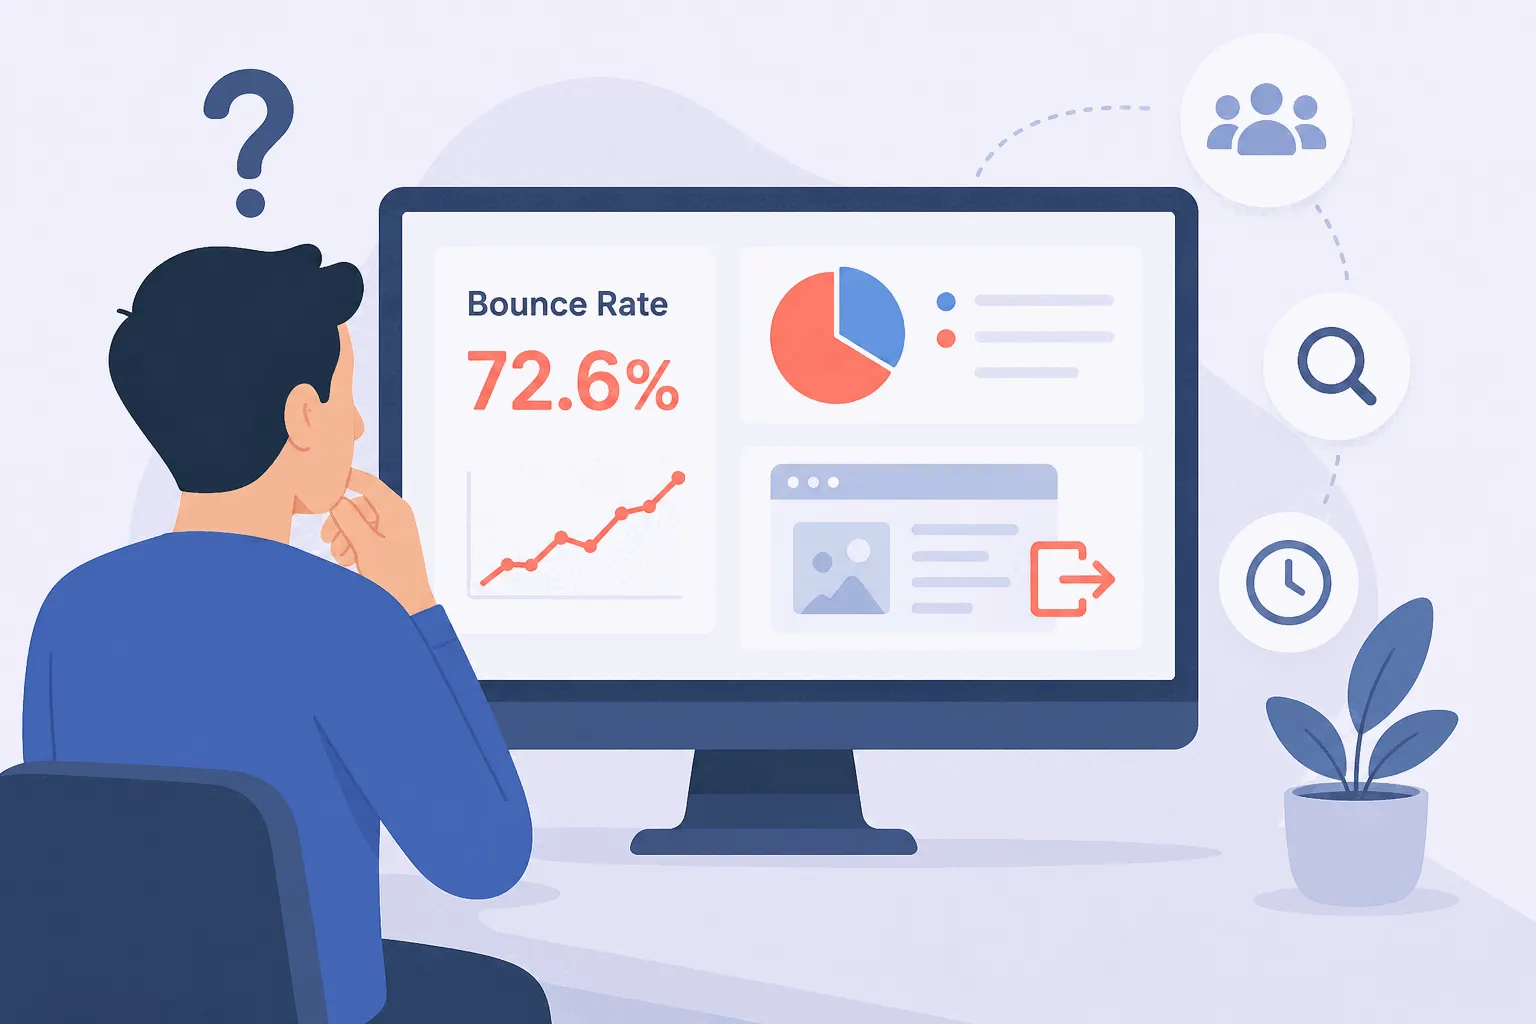
Why is my bounce rate so high?
A high bounce rate is a symptom with four common causes, and two of them are measurement problems rather than visitor behavior. How to work out which one you have before you redesign anything.

Is session replay GDPR-compliant? A practical checklist
Replay can be run legally in Europe — with consent before the script loads, masking on by default, and a retention period you can defend. What the rules actually require, and the checklist that covers you.
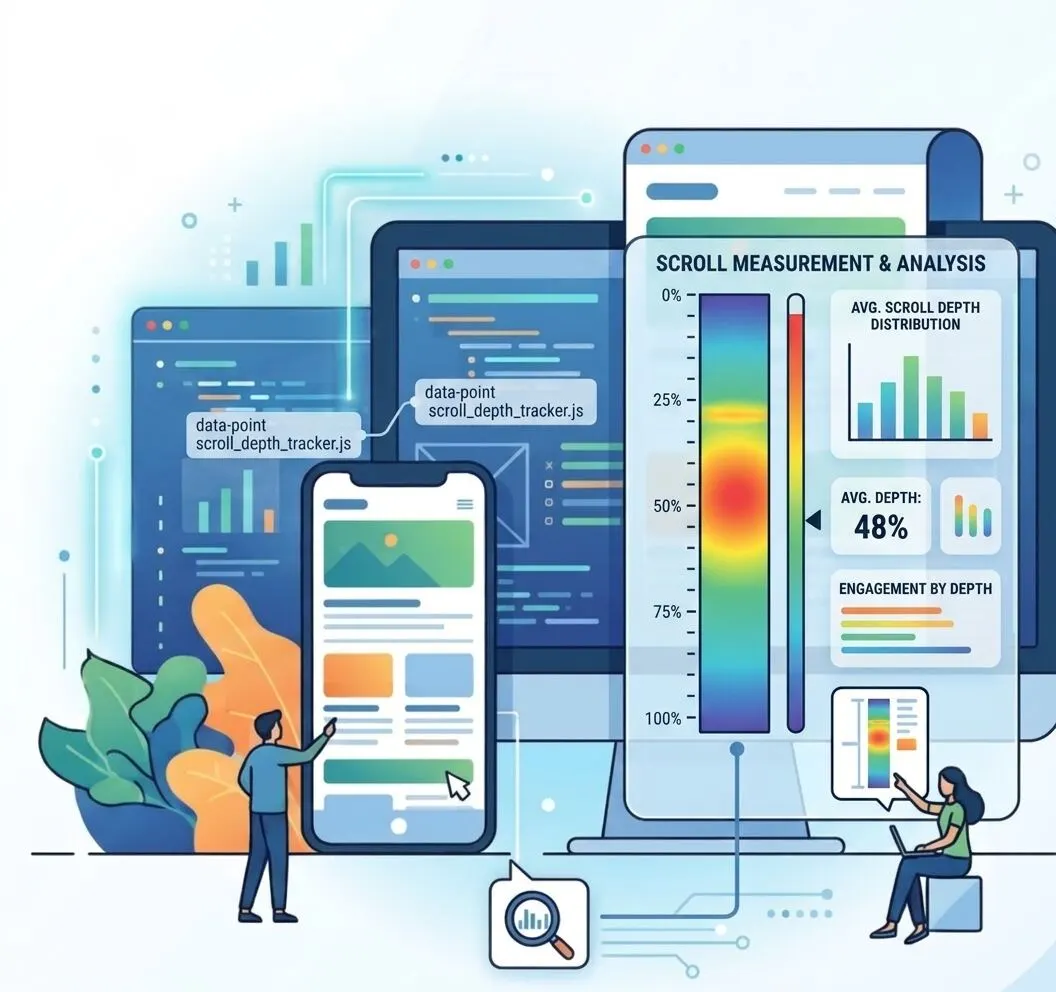
Scroll depth: what it tells you and how to track it
How far down the page visitors actually get, how to record it in GA4 and elsewhere, and why "90% scrolled" can mean less than it seems.
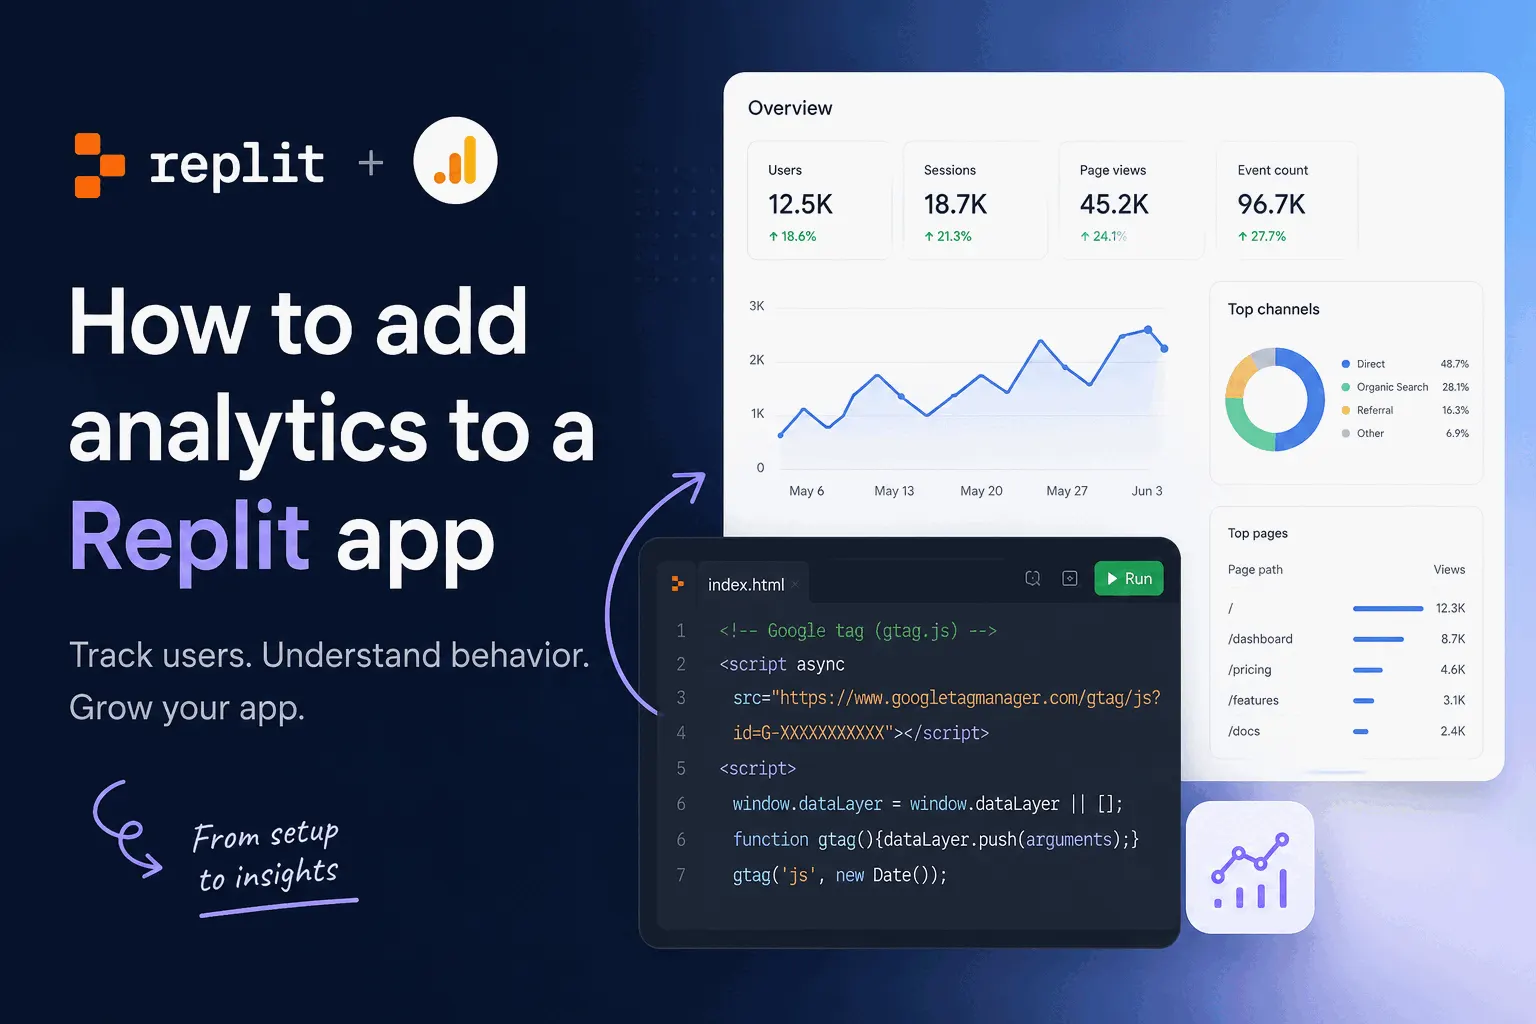
How to add analytics to a Replit app
The built-in telemetry, Google Analytics, or a lighter tool — three ways to see what people actually do in a Replit app, with the exact steps for each.
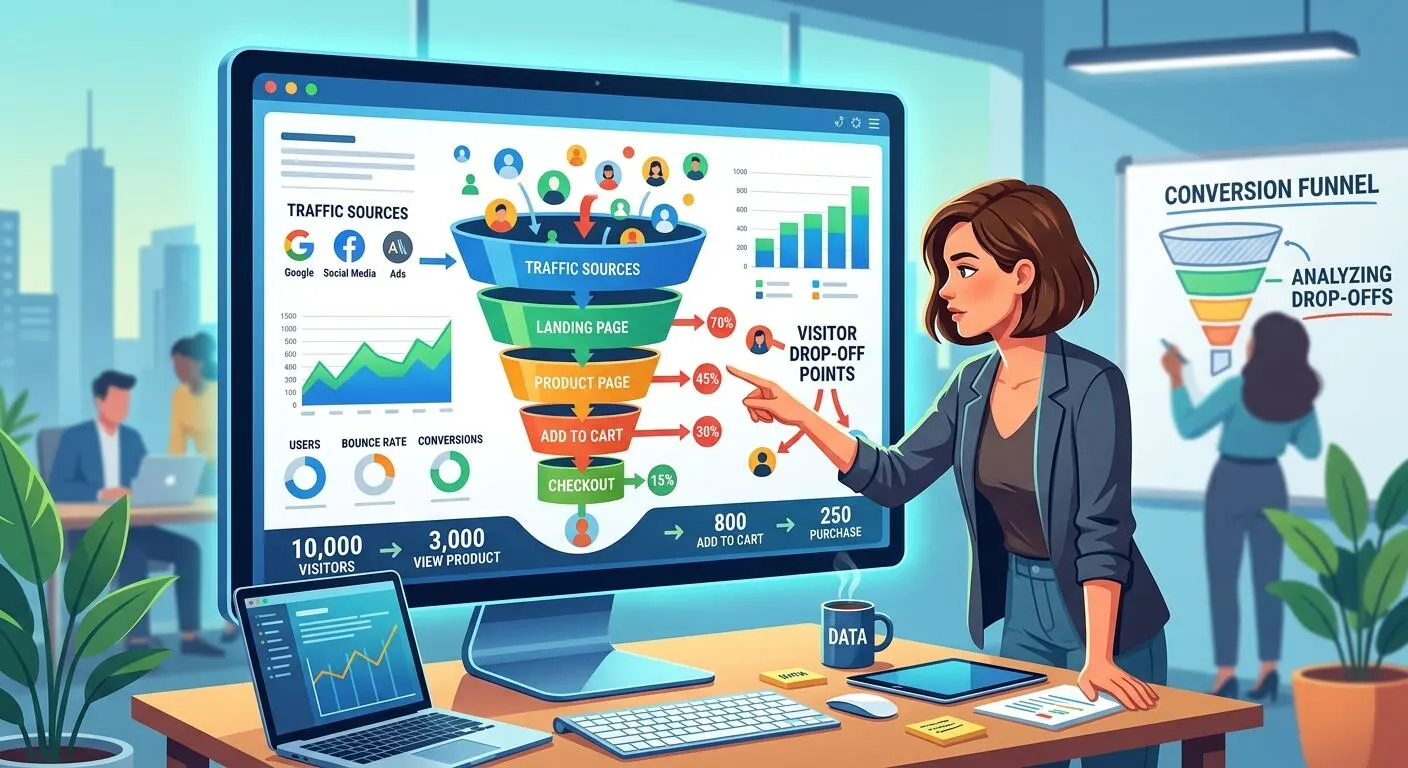
What is a conversion funnel? Finding where visitors drop off
The path a visitor takes from arriving to converting, and the report that shows where they quit. How to pick the steps, build the funnel, and read the drop-offs honestly.

The August 2026 Google spam update, explained
Google rolled out its third spam update of the year between August 18 and 21. If your organic traffic moved that week, here's how to tell whether this was the cause — and what to do about it either way.
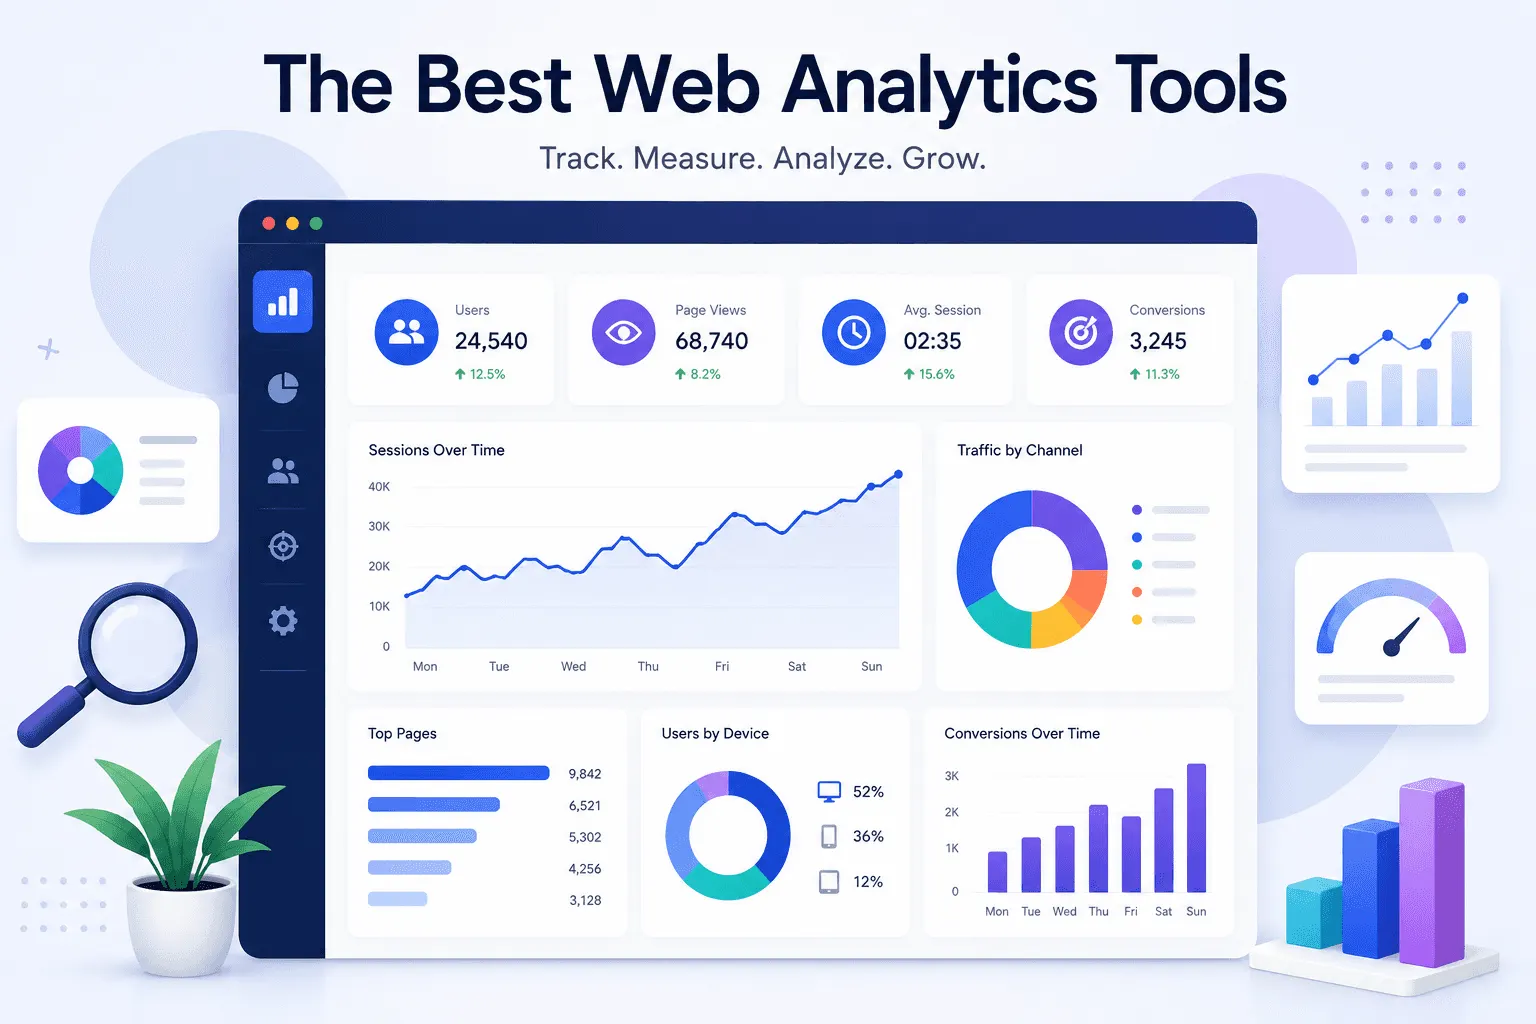
The best web analytics tools in 2026 (and how to actually choose)
Six tools that answer 'who visits my site and what do they do' — from GA4 to the lightweight cookieless generation. What each one is actually good at, where each one stops, and a decision rule that's shorter than any feature table.
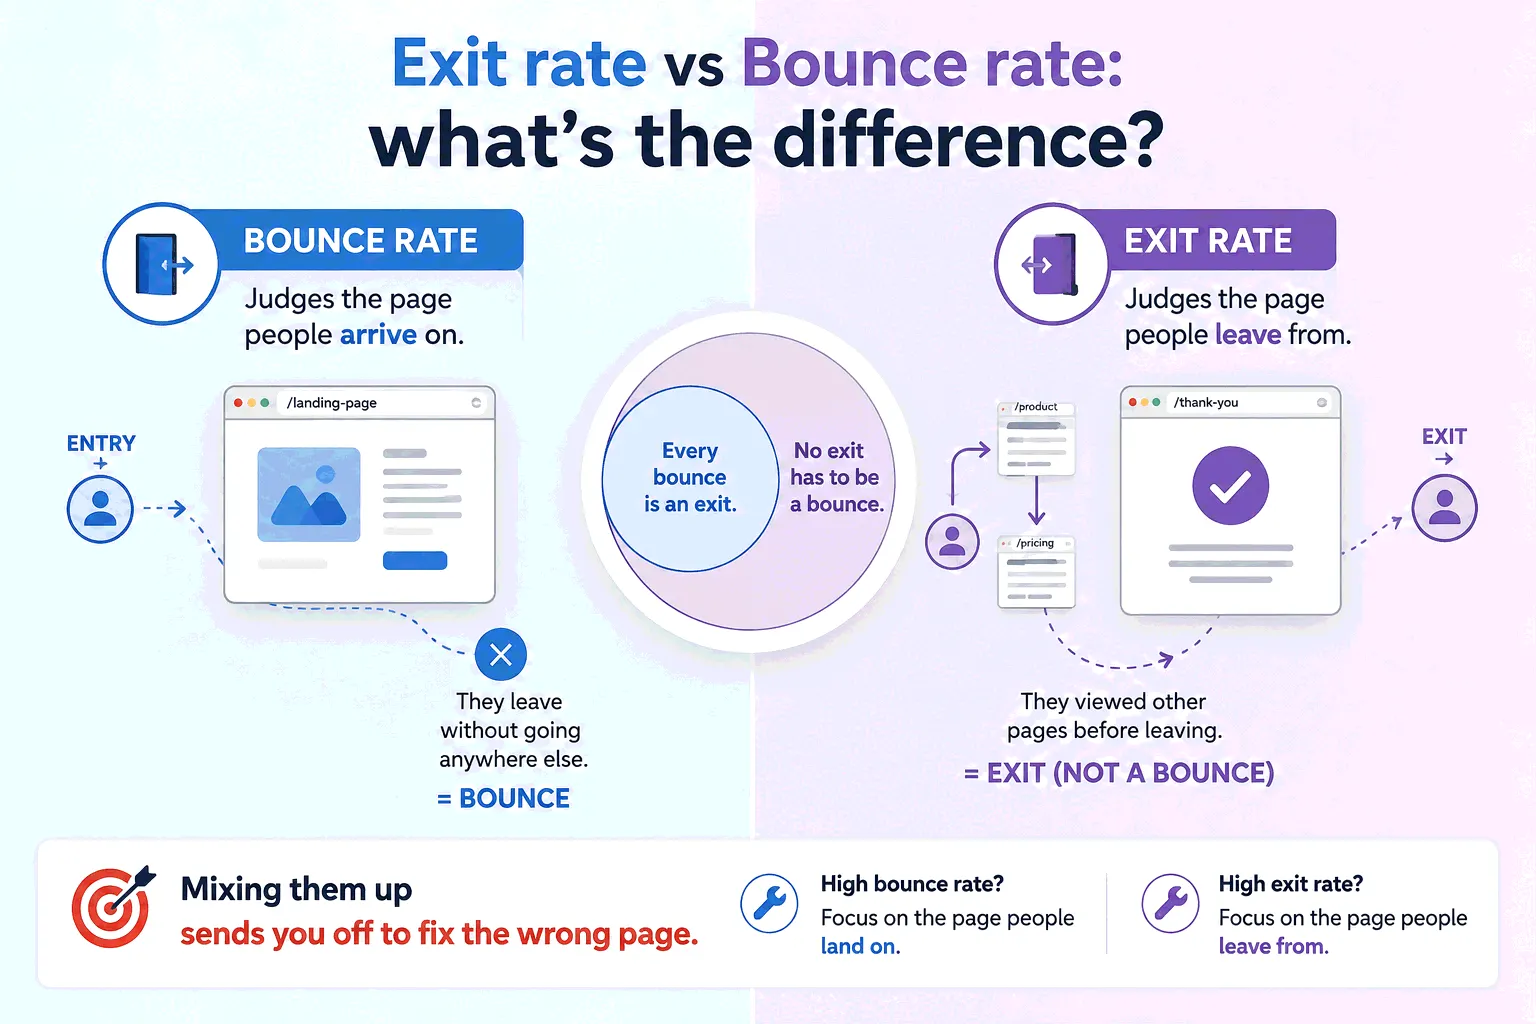
Exit rate vs bounce rate: what's the difference?
One judges the page people arrive on, the other the page they leave from. Every bounce is an exit, no exit has to be a bounce, and mixing them up sends you off to fix the wrong page.

What is direct traffic? (And why it's overcounted)
Direct is supposed to mean 'typed your URL or clicked a bookmark'. In practice it's the label a visit gets when its real origin got lost in transit — which is why the bucket is bigger than it should be, and why yours deserves an audit.
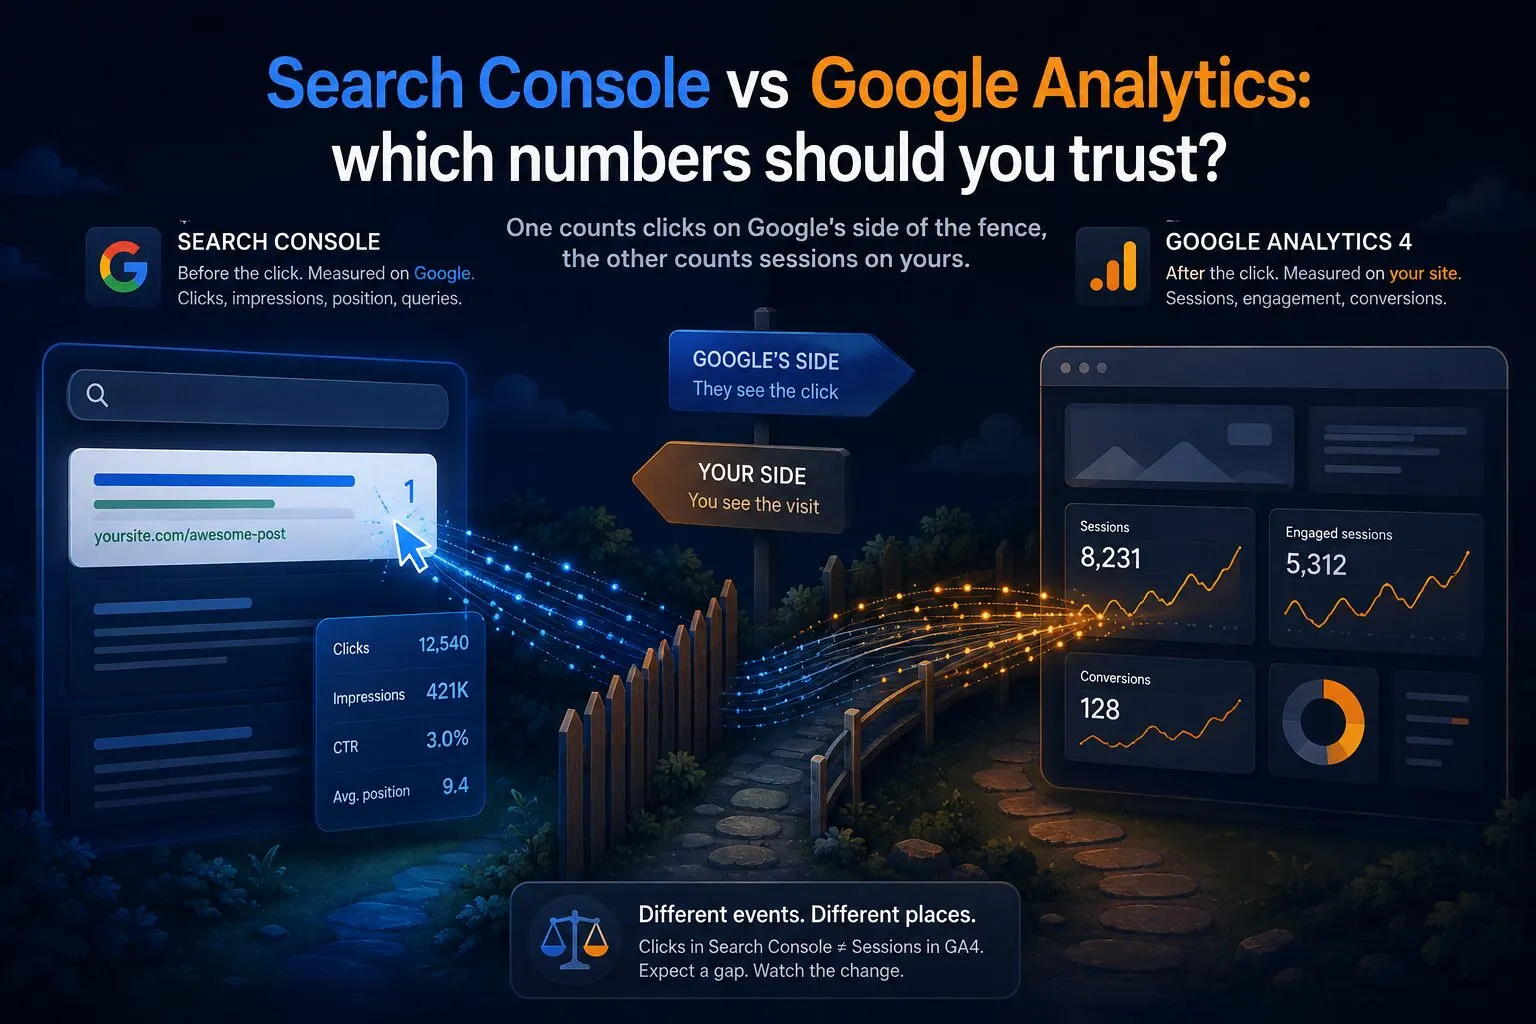
Search Console vs Google Analytics: which numbers should you trust?
One counts clicks on Google's side of the fence, the other counts sessions on yours, and they have never once agreed. Where each number comes from, the documented reasons for the gap, and when a mismatch actually means something broke.
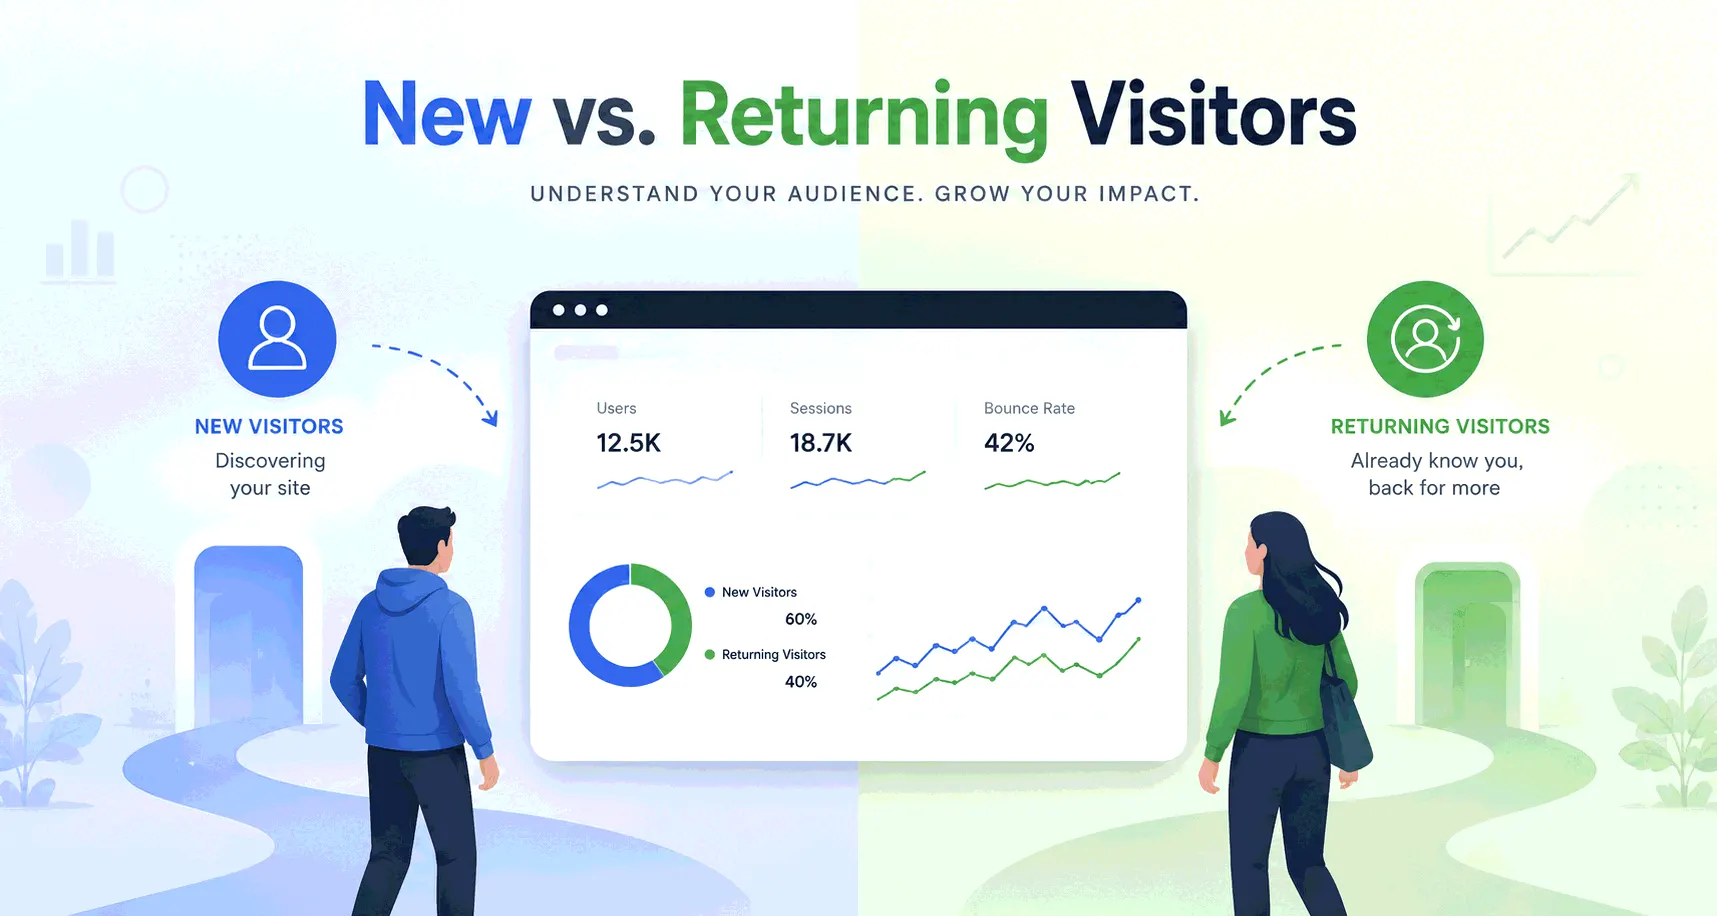
New vs returning visitors: what the split tells you
Every analytics tool splits your audience into first-timers and regulars, and every one of them gets it wrong in the same direction. How the split is measured, why 'new' is inflated, and what the ratio is still good for.
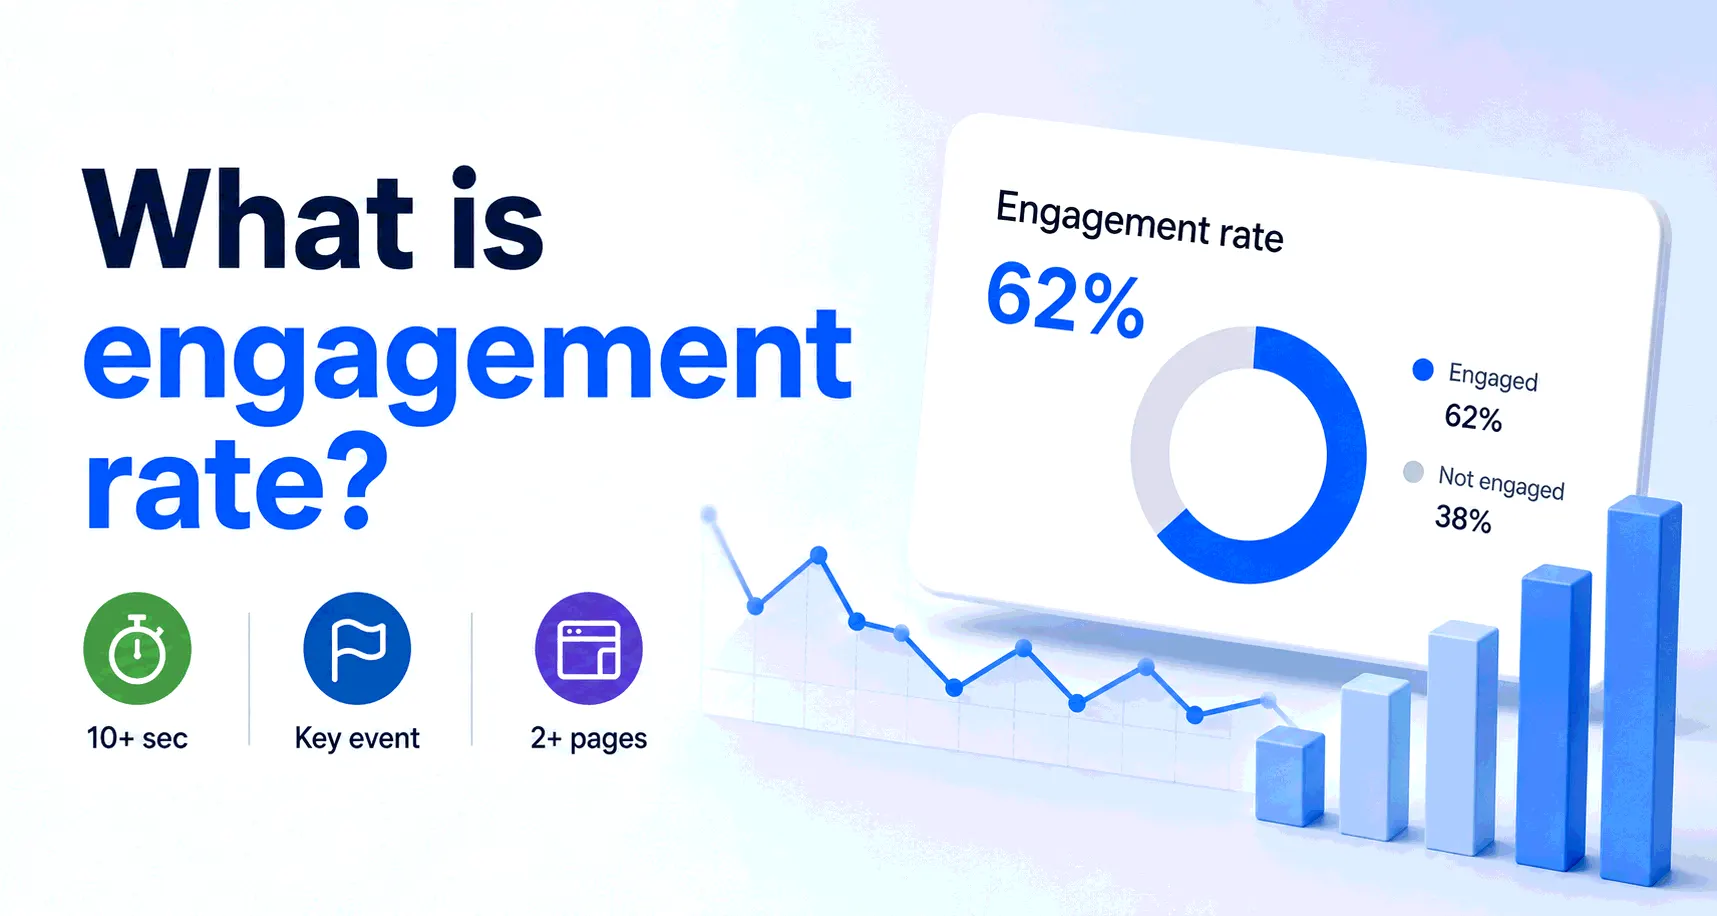
What is engagement rate? GA4's replacement for bounce rate
GA4 retired bounce rate from the default reports and put engagement rate in its place. What clears the bar, why there's no trustworthy industry average, and the two ways the number quietly lies.
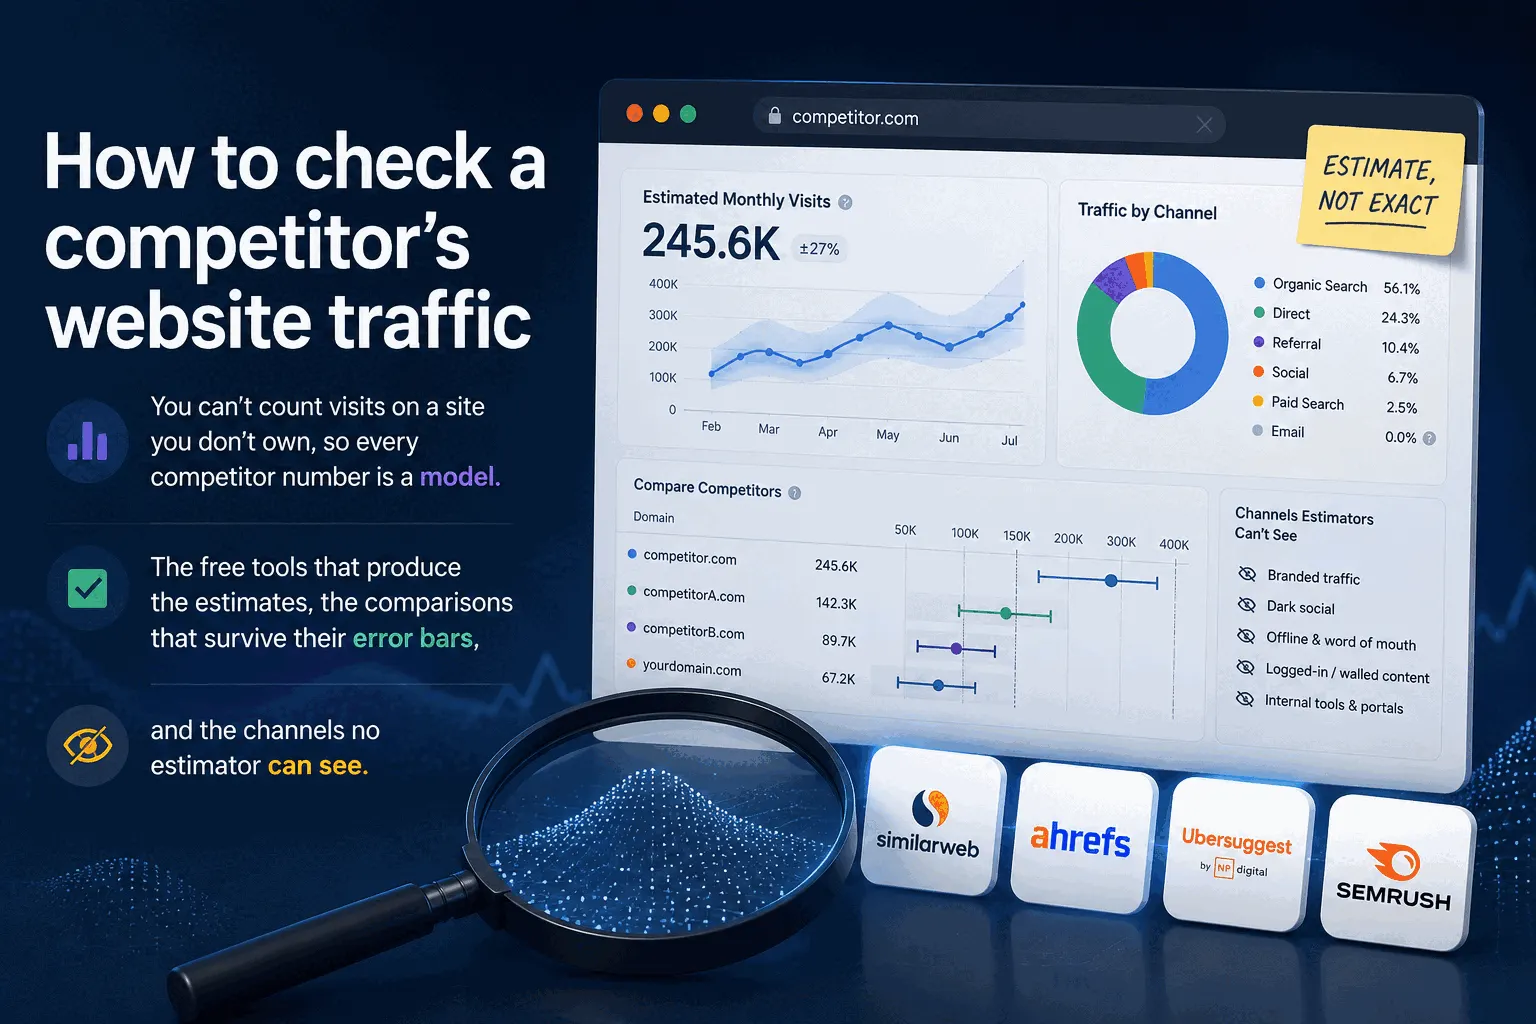
How to check a competitor's website traffic
You can't count visits on a site you don't own, so every competitor number is a model. The free tools that produce the estimates, the comparisons that survive their error bars, and the channels no estimator can see.
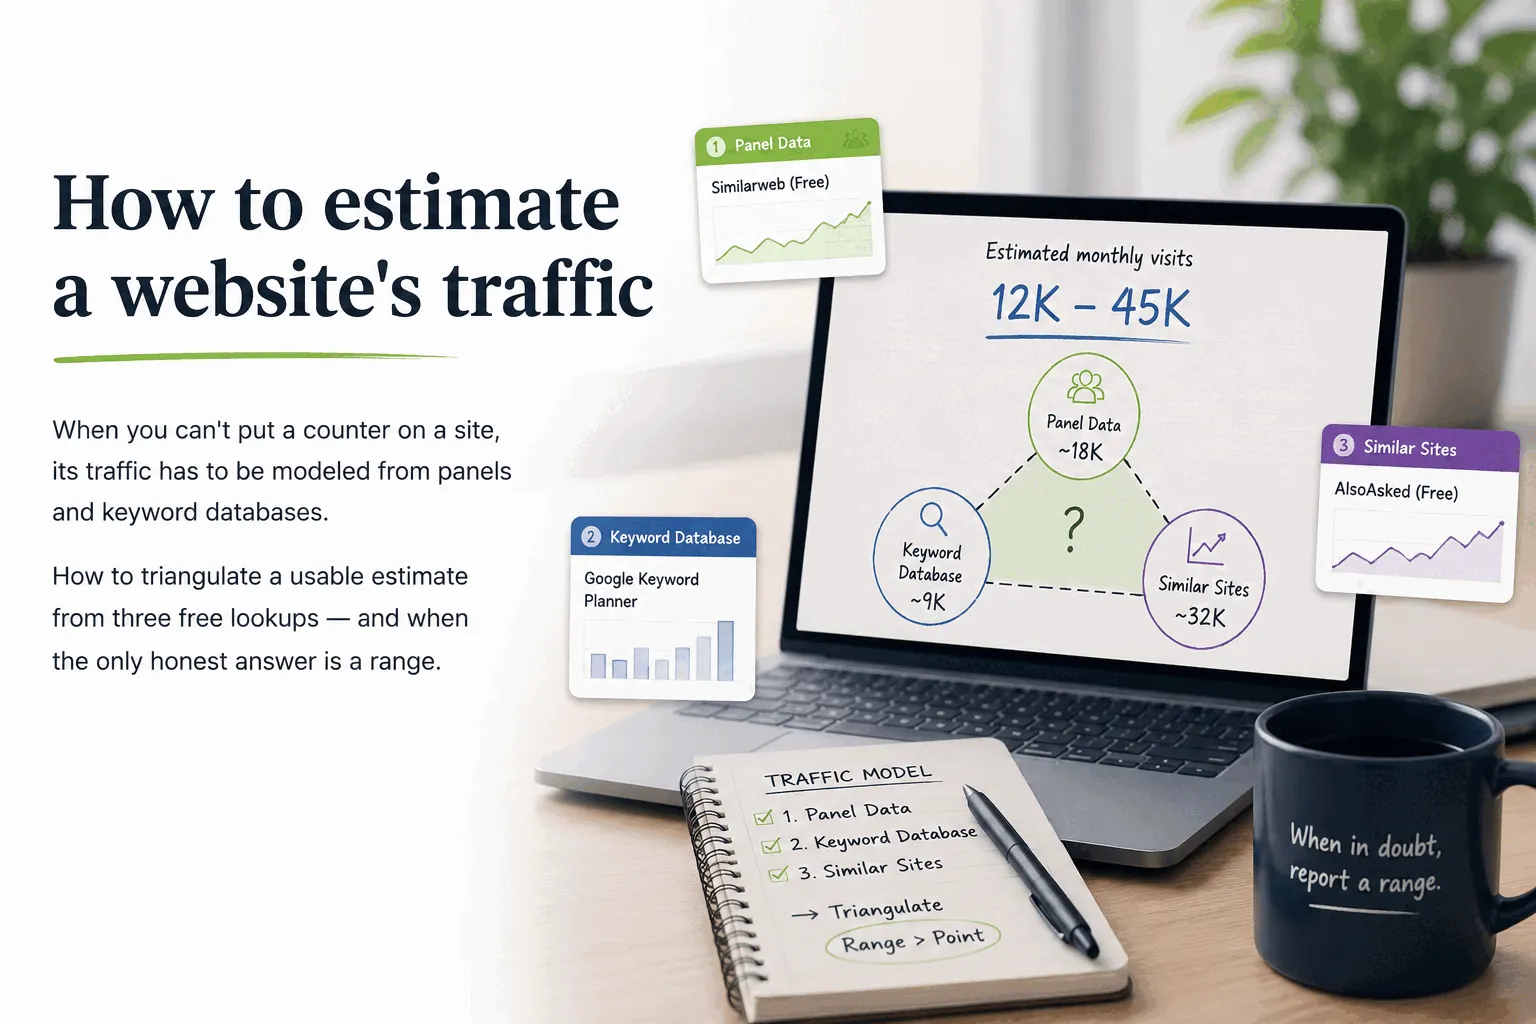
How to estimate a website's traffic
When you can't put a counter on a site, its traffic has to be modeled from panels and keyword databases. How to triangulate a usable estimate from three free lookups — and when the only honest answer is a range.
How to check website traffic without Google Analytics
GA4 is the default, not a requirement. Lightweight cookieless counters, Search Console and server logs all measure visitors without it — what each route shows, what it misses, and what leaving GA4 actually costs.
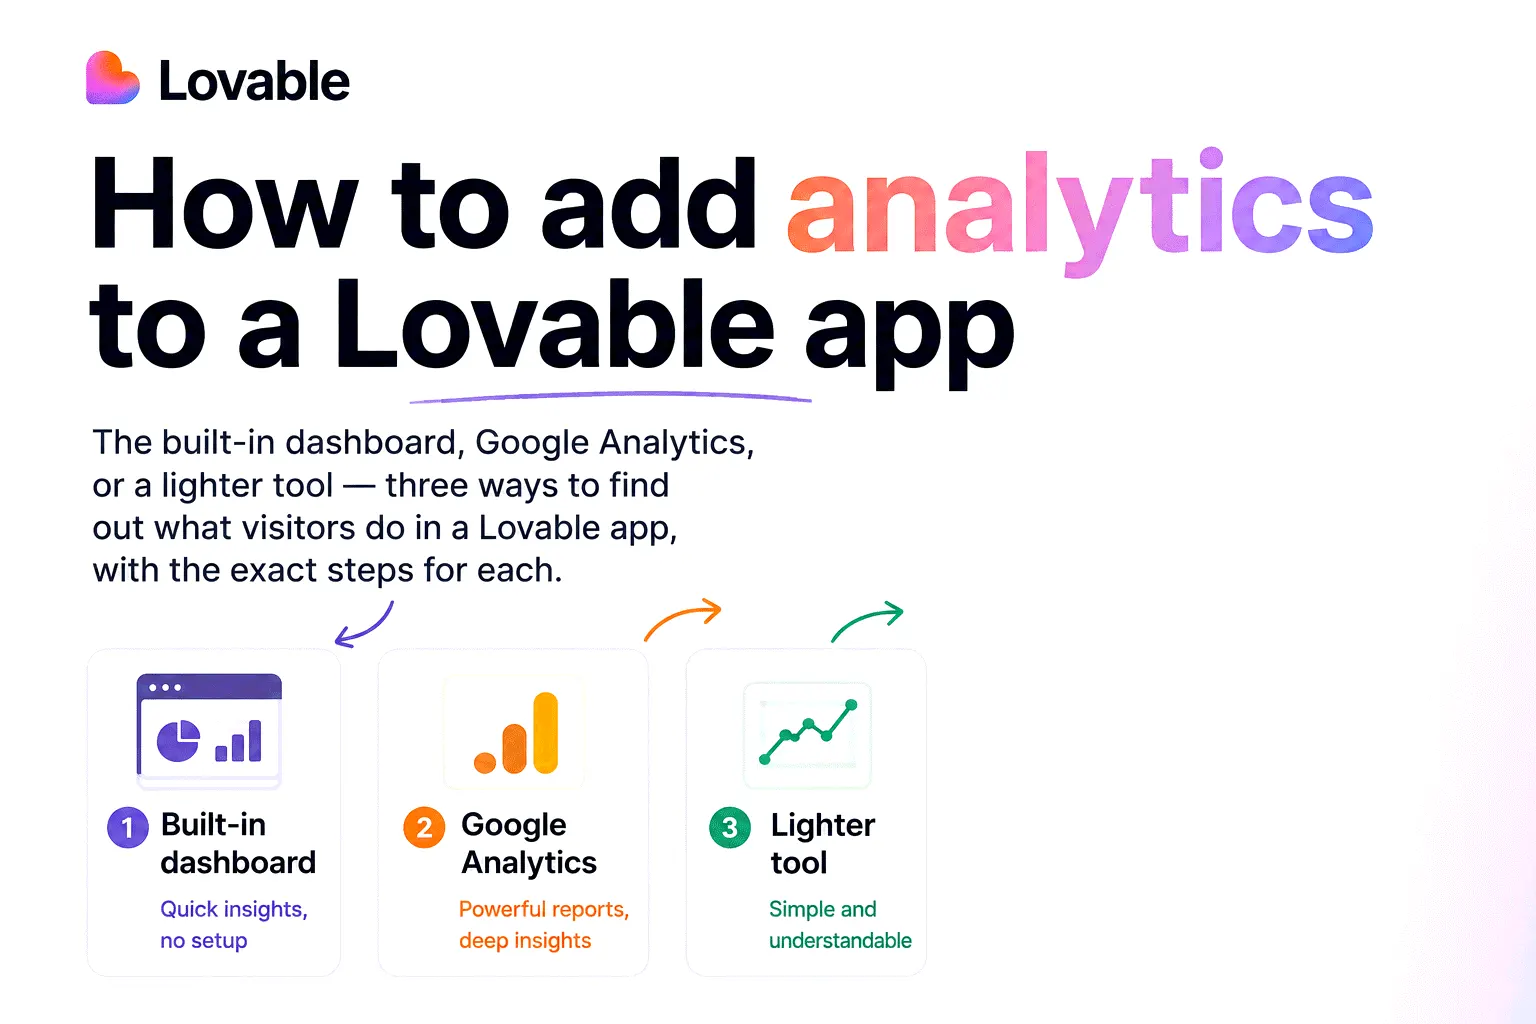
How to add analytics to a Lovable app
The built-in dashboard, Google Analytics, or a lighter tool — three ways to find out what visitors do in a Lovable app, with the exact steps for each.

What is a website heatmap? The four types, explained
Click maps, scroll maps, movement maps and attention maps answer different questions, and none of them show what people are looking at. What each type is good for, and the reading mistakes that lead to bad redesigns.
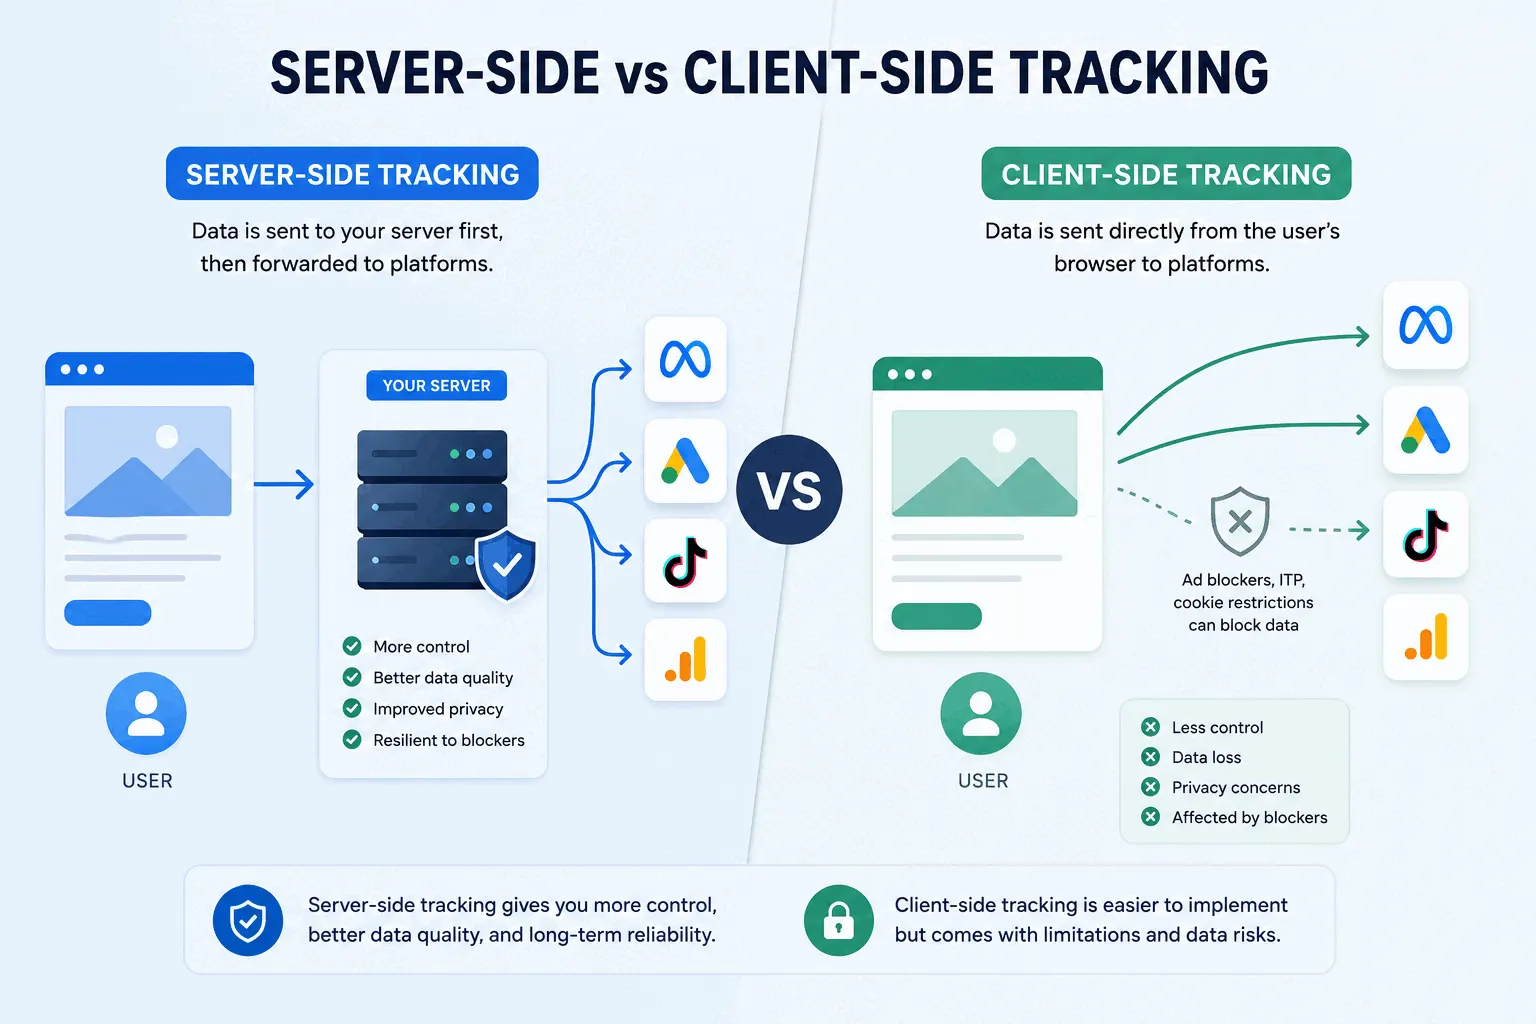
Server-side vs client-side tracking, explained without jargon
Almost every analytics tool works the same way: a script in the visitor's browser reports back what happened. Server-side tracking moves that reporting to a computer you control — which is why ad blockers can't stop it, and why it costs real money to set up. Here's how both work, what switching actually recovers, and when it's worth it.
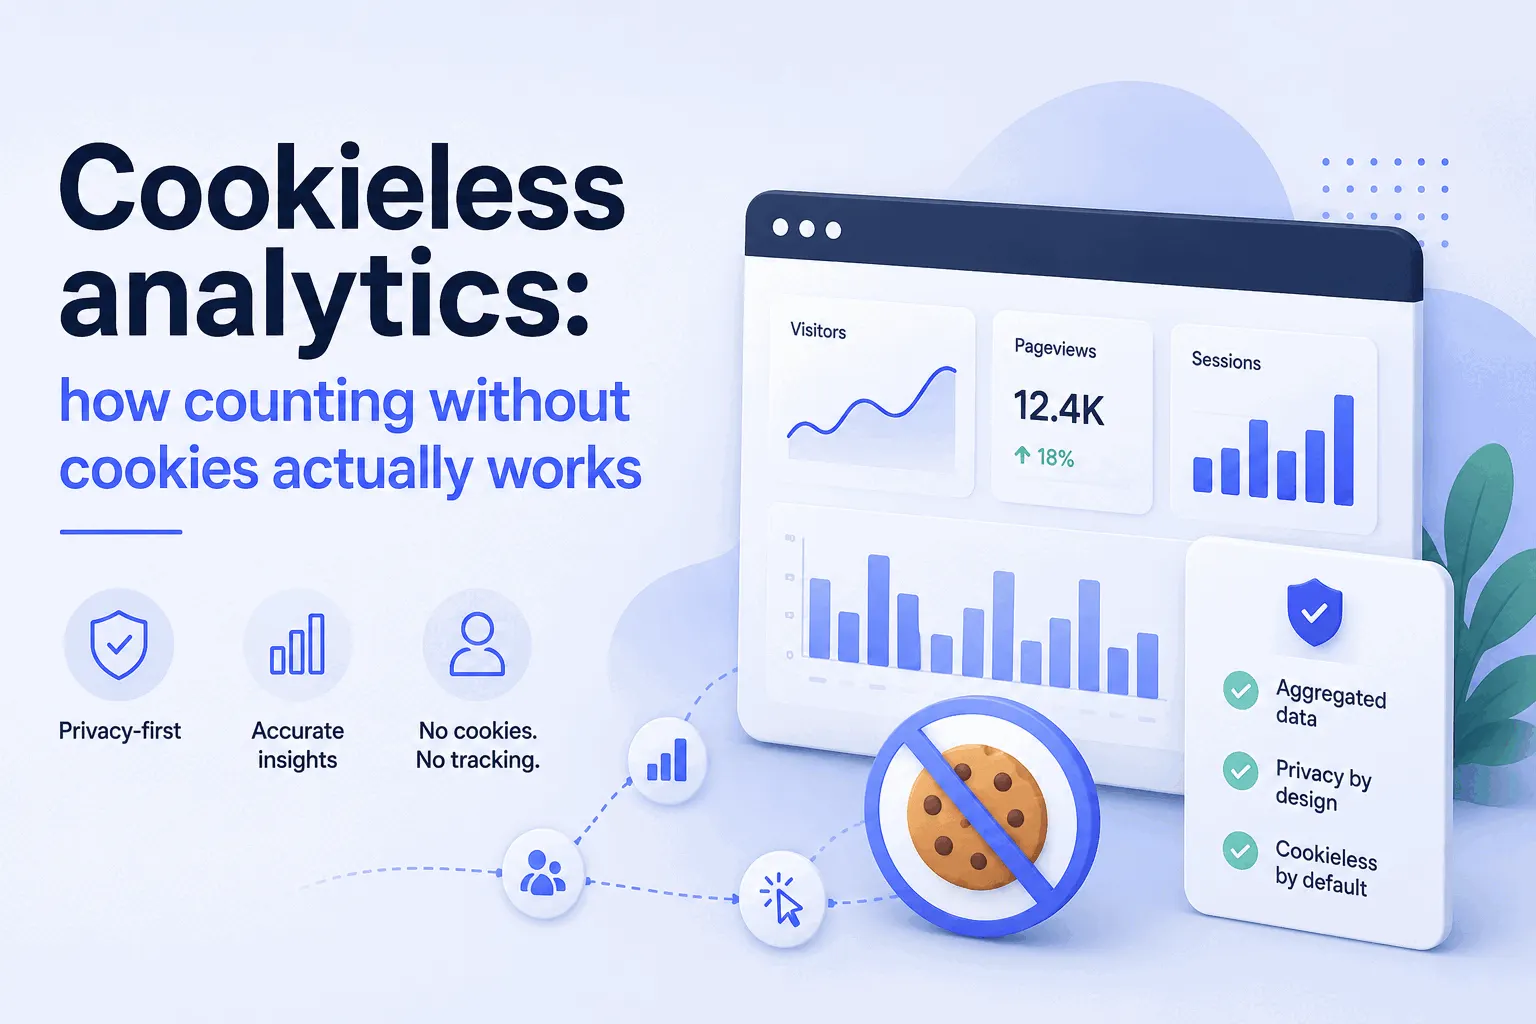
Cookieless analytics: how counting without cookies actually works
'Cookieless' is a single label covering at least three different techniques, and they trade away different things — mostly the ability to recognize a visitor who comes back tomorrow. Here's how each approach counts people, why cookieless tools often show more traffic than Google Analytics, and where the no-banner-needed claims actually stand in 2026.

Session replay lawsuits, explained for site owners
Thousands of websites have received wiretapping lawsuits or demand letters for running session replay and tracking pixels — under a California law written in 1967. Most of them could have avoided it with one change: nothing records until the visitor clicks Accept. Here's what the lawsuits actually claim, what the courts have decided so far, and what to check on your own site.

Dark traffic: the visitors your analytics can't see
Ad blockers stop the analytics script for roughly a third of the web. Privacy browsers strip referrers and cap cookies. Consent banners never get an answer from half of desktop visitors. And most private shares arrive with no referrer at all, landing in Direct. Your dashboard shows a sample, not the universe.

Why your analytics numbers never match: GA4 vs ads platforms
Your Google Ads campaign reports 150 conversions. GA4 reports 80. The gap exists because each system answers a different question and counts conversions by different rules — attribution windows, view-through credit, modeled conversions, click dates. Here's why, and which number to use for what.
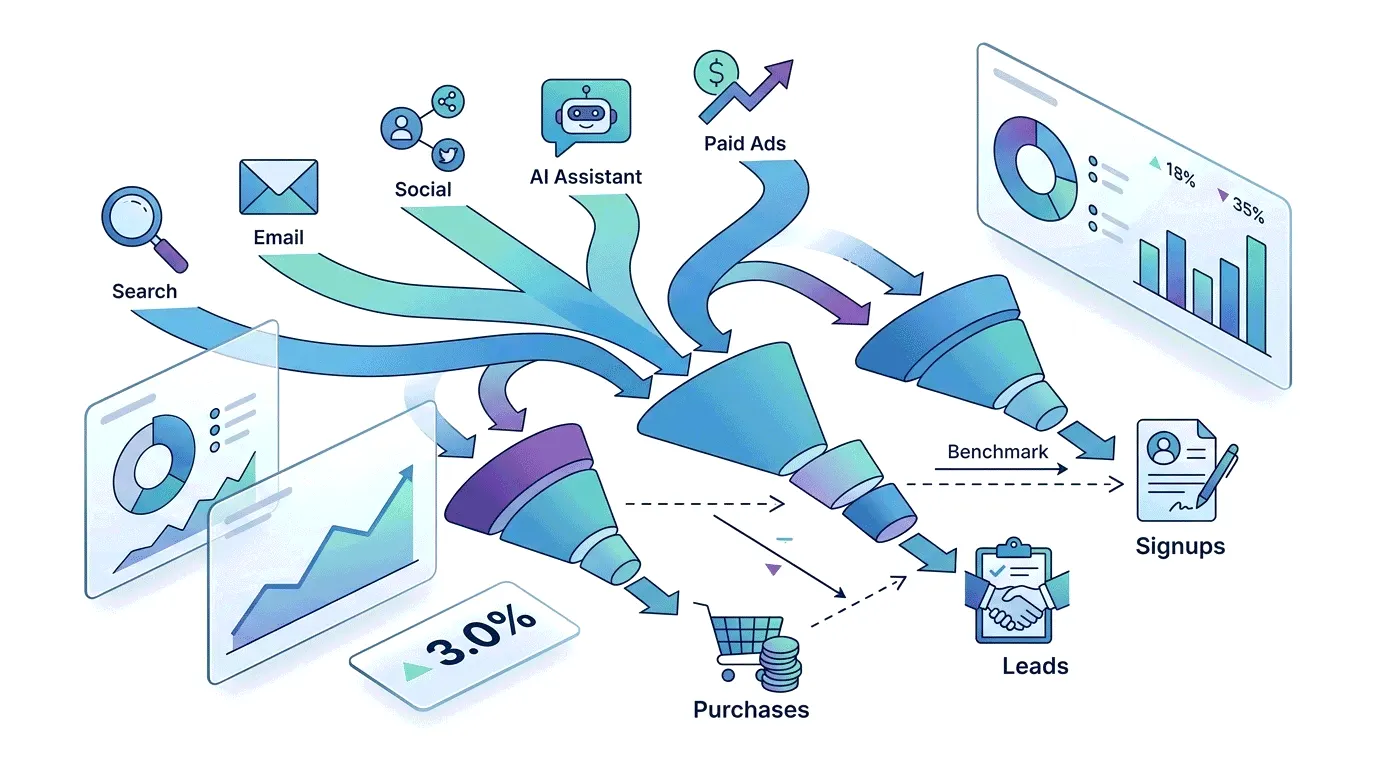
What's a good conversion rate? Benchmarks by industry and traffic source
Around 2% for an online store, 3–6% for a lead-gen site, and 6%+ for a dedicated landing page — the 'average conversion rate' depends entirely on what's being counted. Here are the 2026 numbers from sources that publish their methodology, and how to read them without fooling yourself.
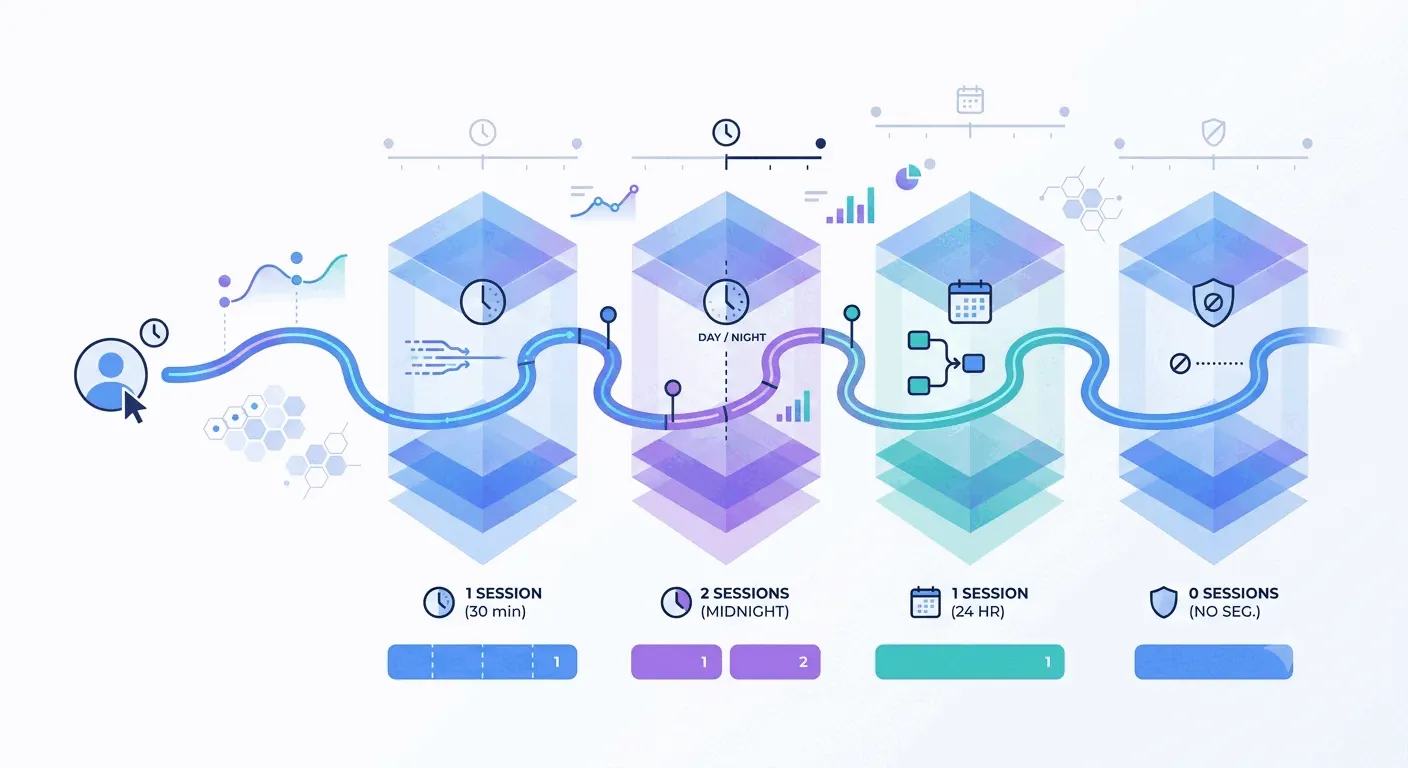
What counts as a “session”? Every tool defines it differently
Most analytics tools end a session after 30 minutes of inactivity — but GA4 stopped splitting sessions at midnight, Matomo still does, Fathom uses a 24-hour window, and some privacy tools don't count sessions at all. Same traffic, different numbers, and almost nobody discloses which rules they're playing by.
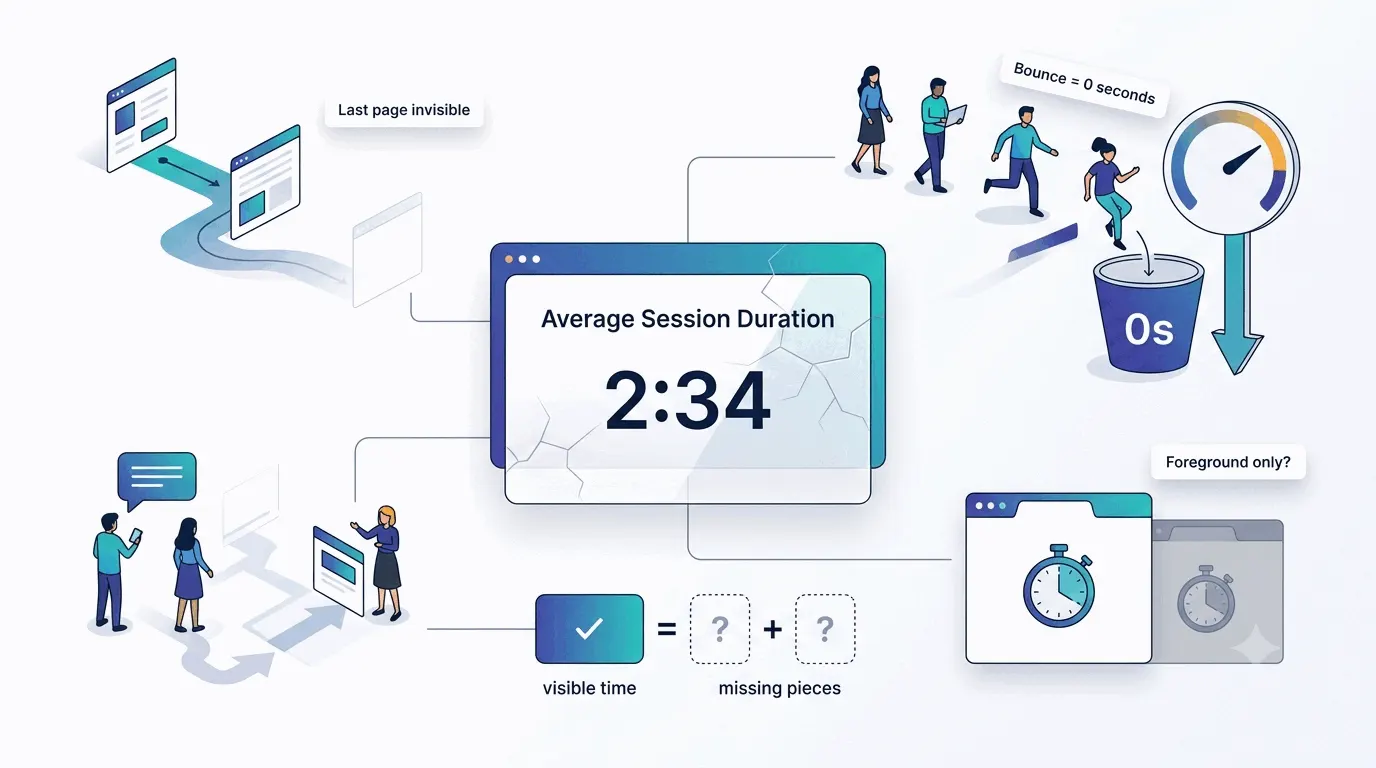
Average session duration is lying to you
The last page of every visit contributes zero seconds, bounces drag the average toward nothing, and whether the clock keeps running while a tab sits in the background depends on which tool you ask. Here's how the number is actually computed, why it fell when you switched to GA4, and what to look at instead.
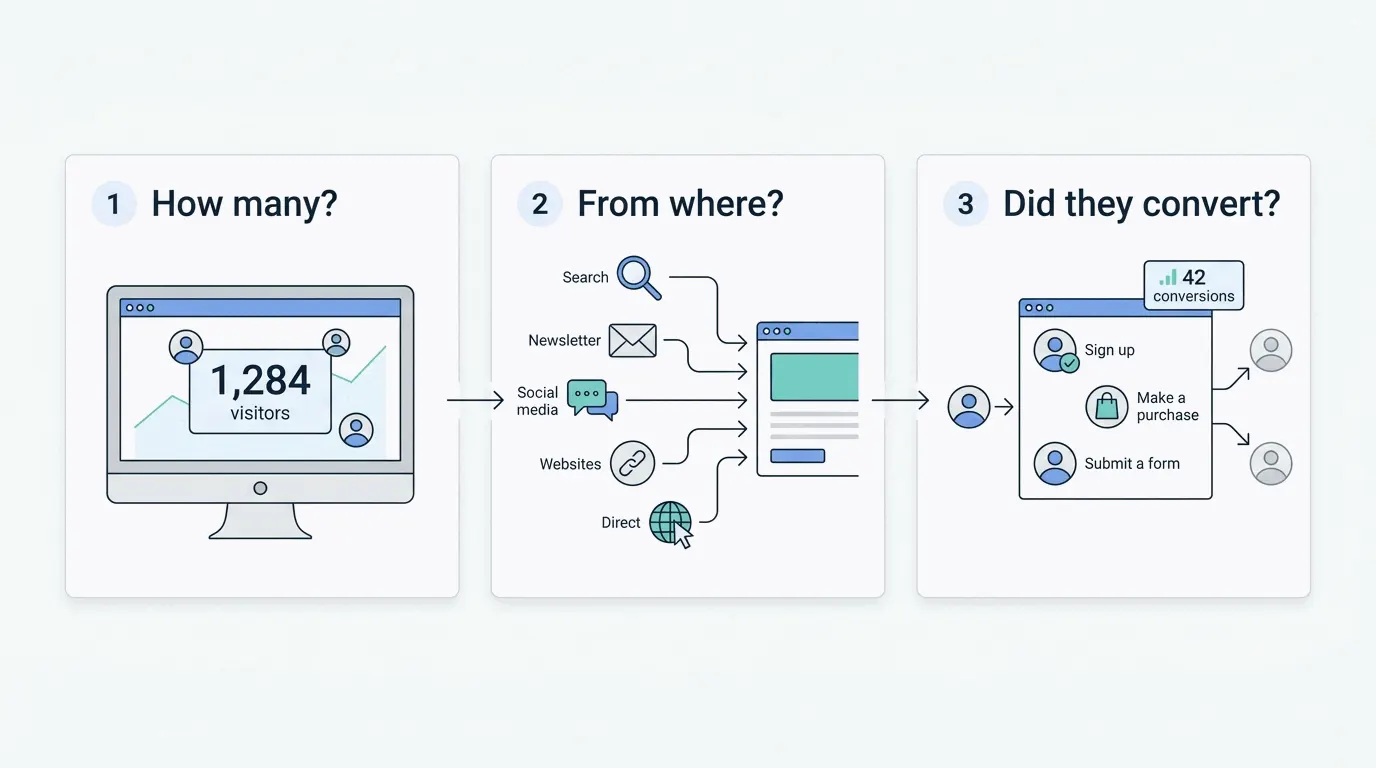
What is web analytics? A plain-English guide
You add one small script to your site and it starts counting: how many people visited, which search or link brought them, and whether any of them signed up. This guide explains how that works, what the terms on the dashboard mean, and how much to trust the numbers.
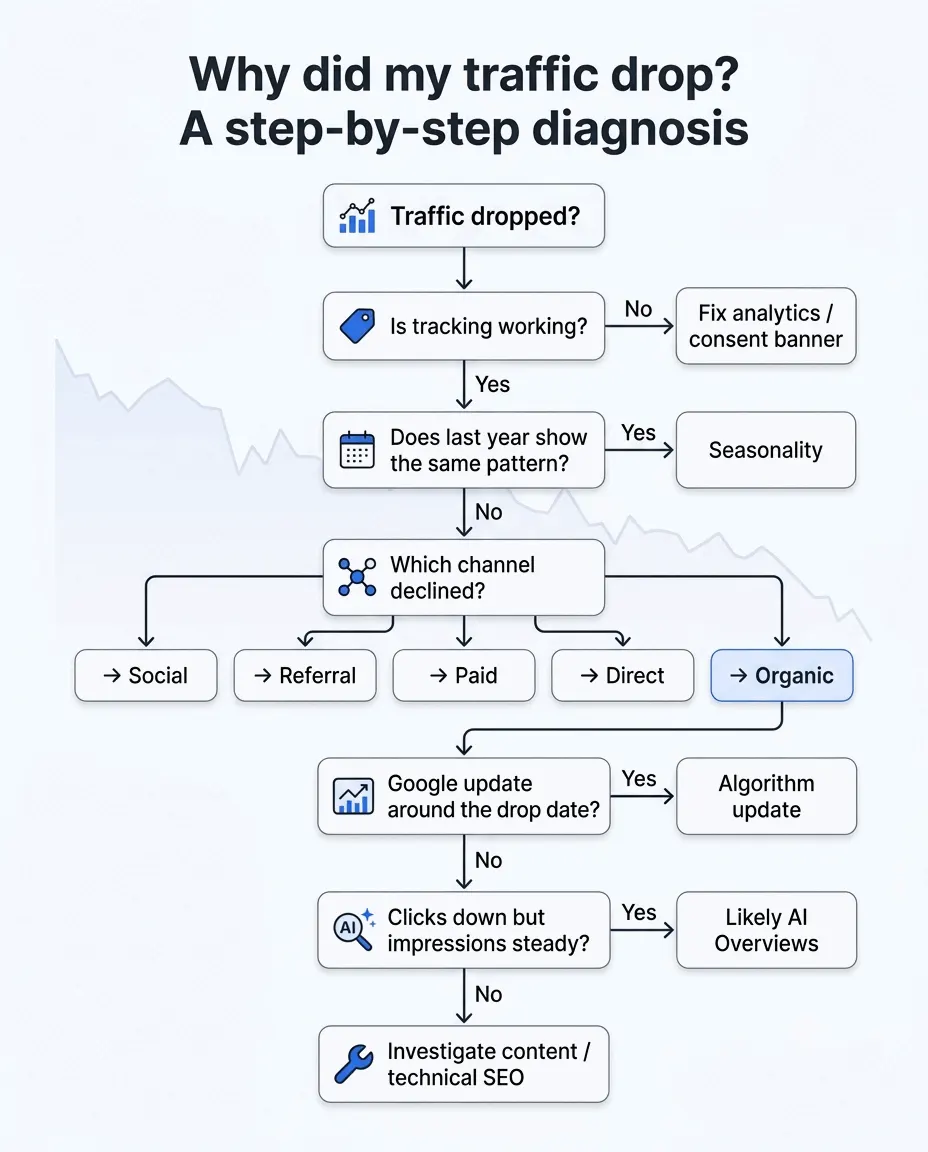
Why did my traffic drop? A step-by-step diagnosis
Most traffic drops have one of five causes: broken tracking, seasonality, a channel-specific problem, a Google update, or AI Overviews eating your clicks. Check them in that order — the common causes are also the fastest to rule out.

How to track website conversions
A conversion is just the action you want a visitor to take. Which action it is, is your call — and the choice decides everything the number is worth.
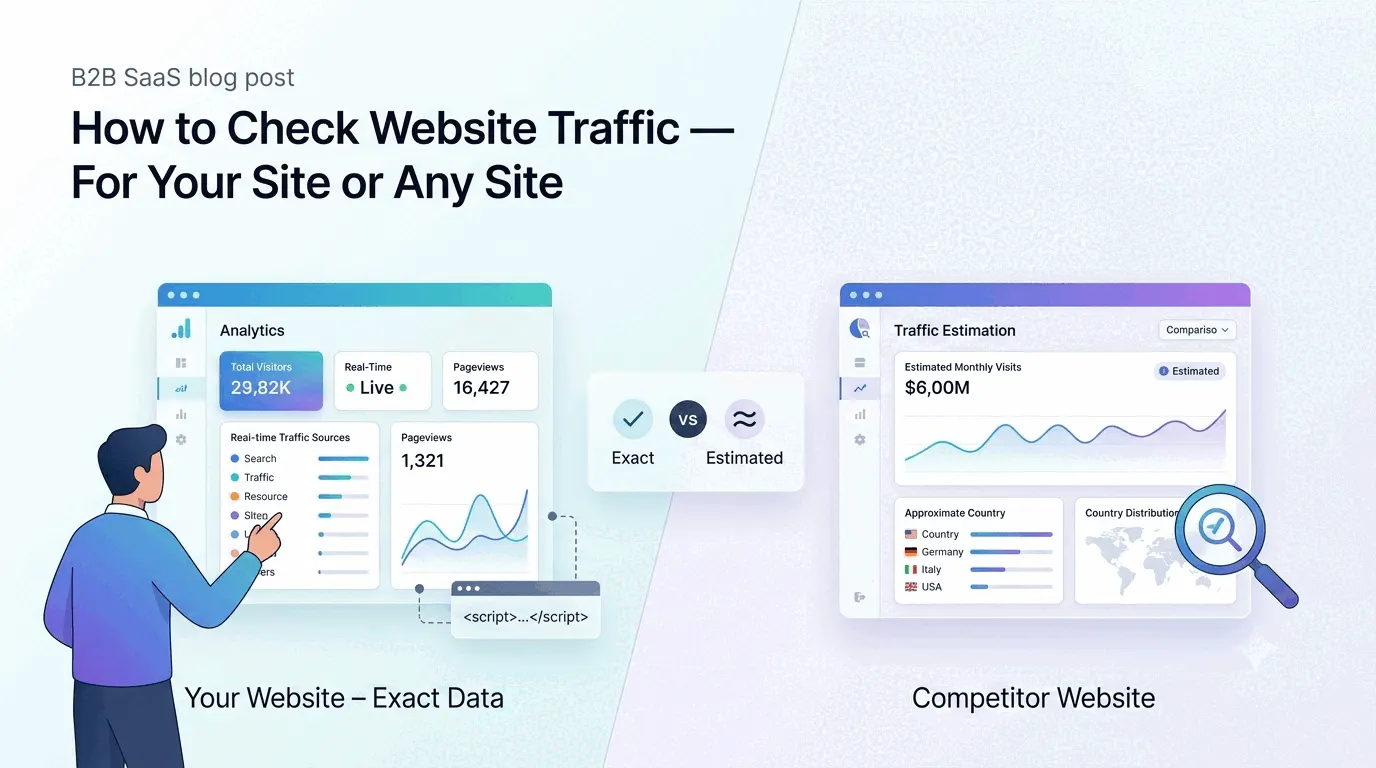
How to check website traffic — for your site or any site
Checking your own site takes one snippet and two minutes for exact numbers. Checking someone else's takes an estimator and a grain of salt. Both routes, free — and the accuracy data the tool pages don't mention.
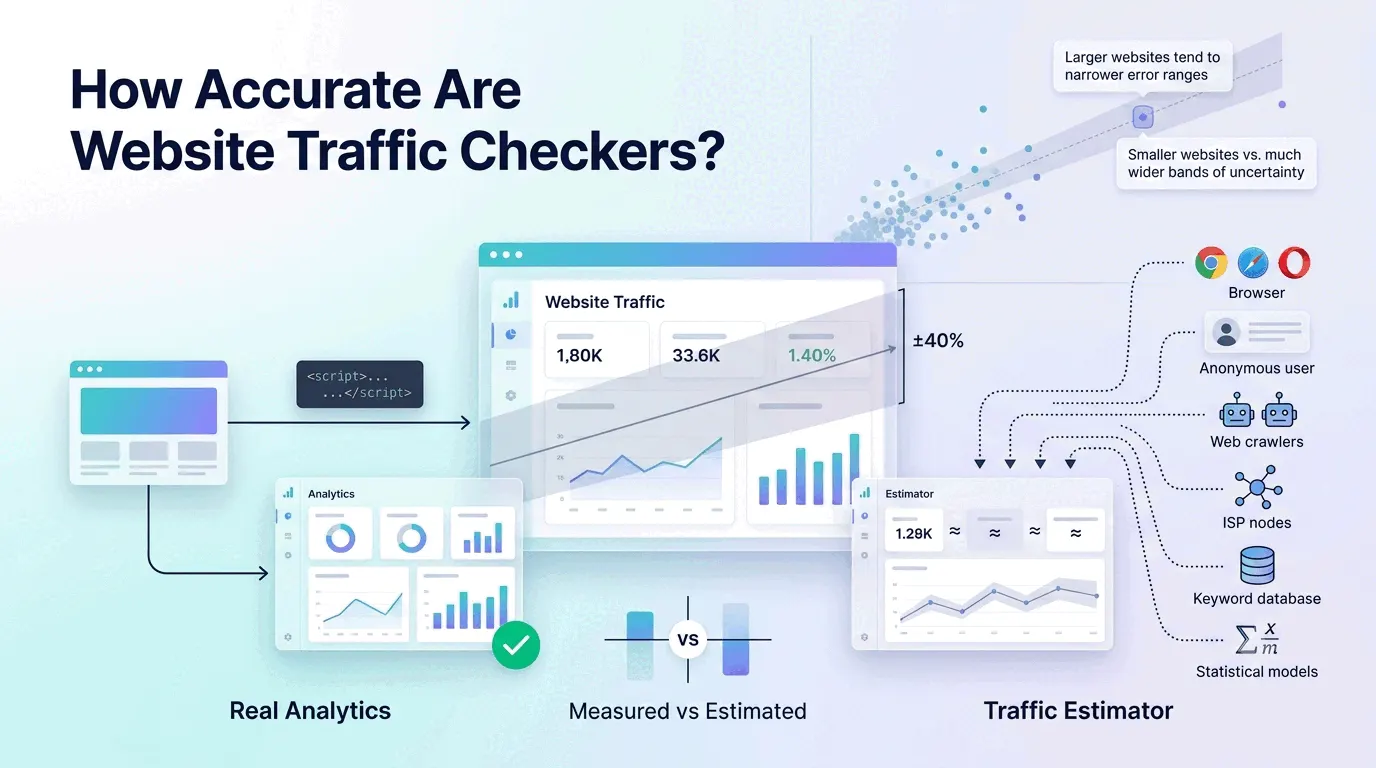
How accurate are website traffic checkers?
Screaming Frog compared estimators against real analytics on 25 sites: Semrush ran about 42% low, Ahrefs 36%, and SimilarWeb averaged closest with the wildest variance. Where the numbers come from, and when to trust them.
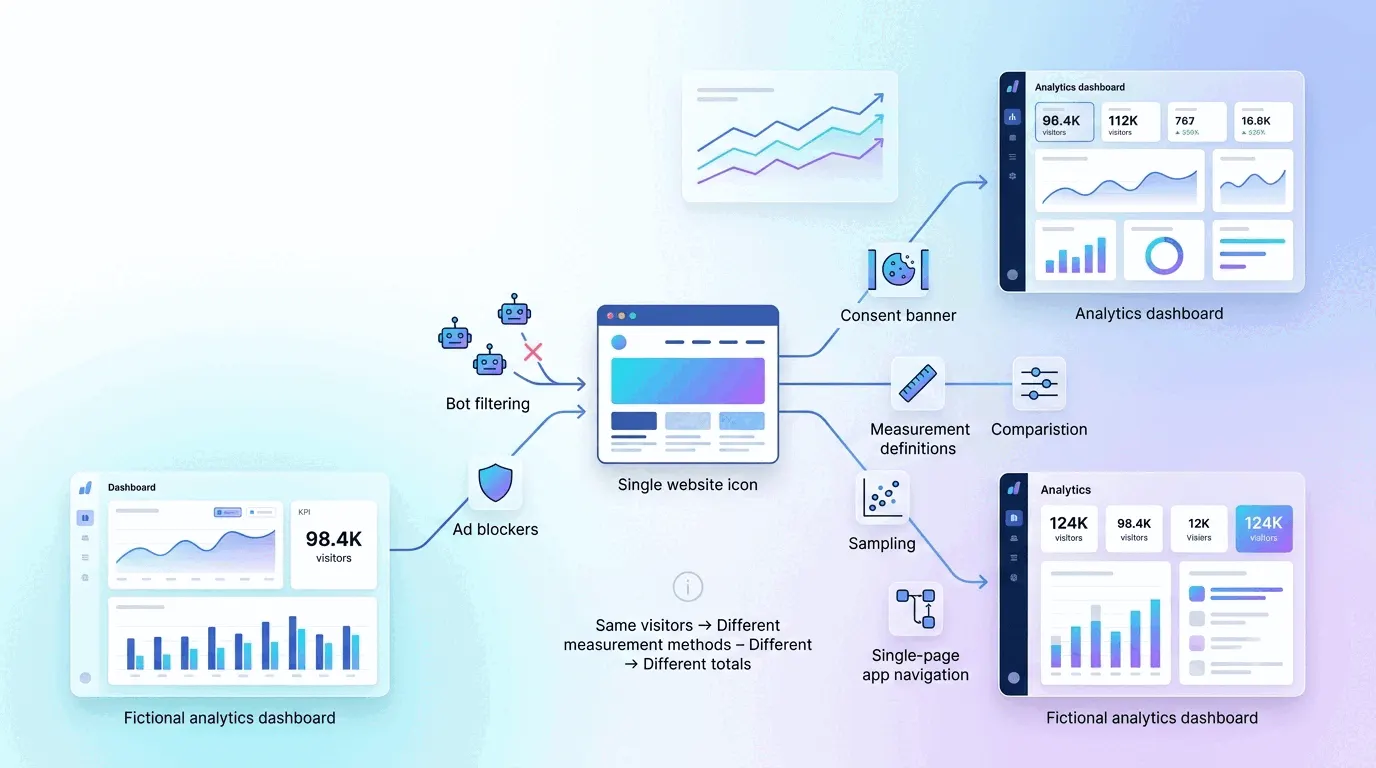
Why do different analytics tools show different numbers?
Run two analytics tools on one site and they'll disagree by 10–30% — with both correct by their own rules. The six causes of the gap, which number sits closest to the truth, and how to work with it.
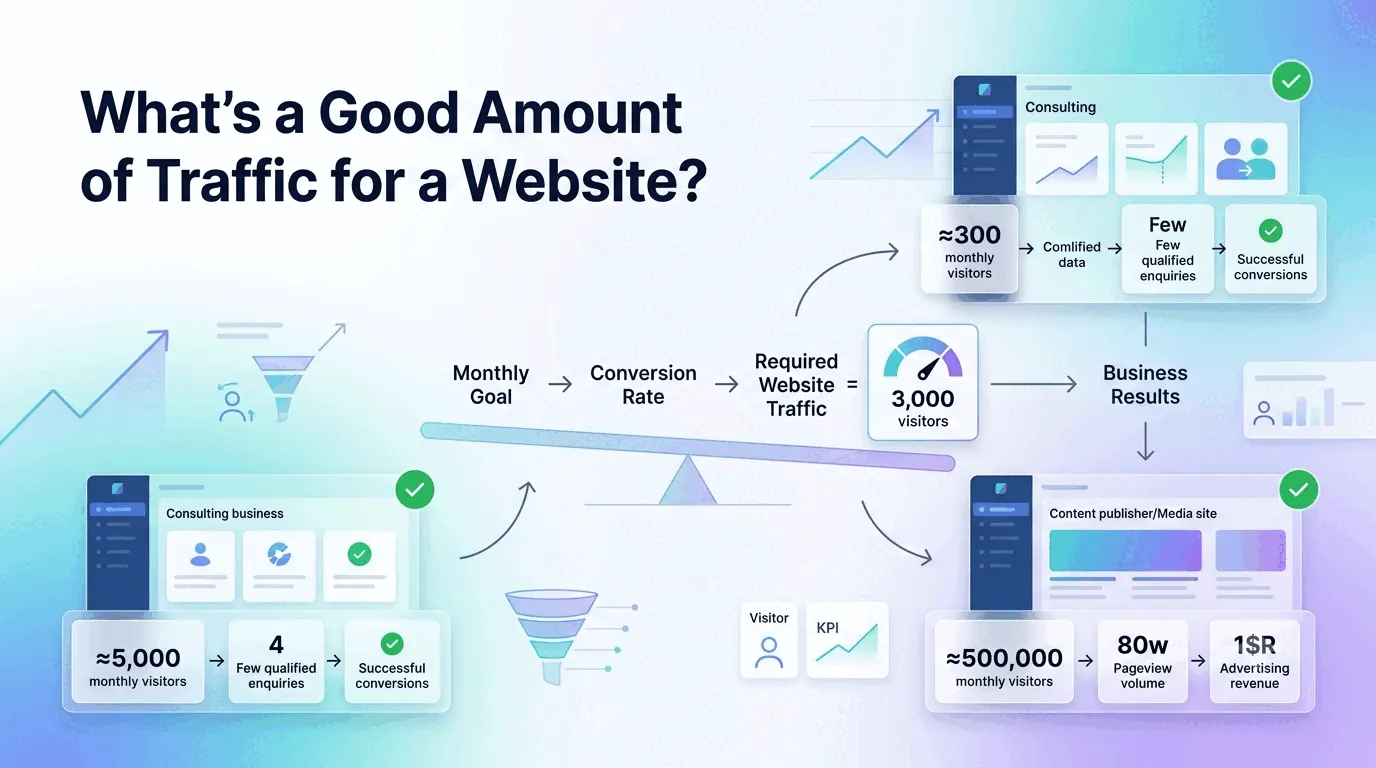
What's a good amount of traffic for a website?
A consultancy can thrive on 300 visits a month while a content site starves on 50,000. The benchmark worth having comes from your own numbers: monthly goal divided by conversion rate.
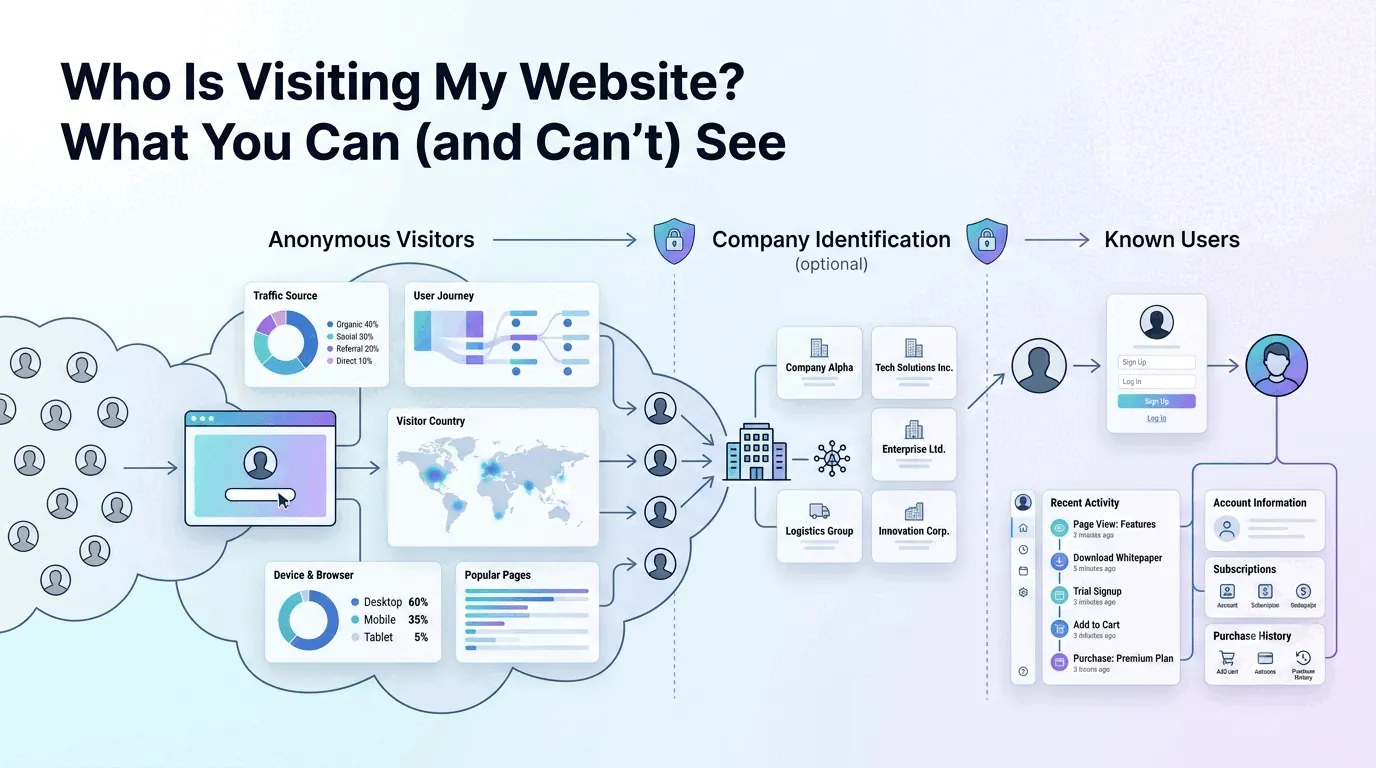
Who is visiting my website? What you can (and can't) see
No tool will hand you the names of anonymous visitors — anyone promising that is selling trouble. What you can see: sources, journeys, company names on B2B traffic, and full profiles with pre-signup history, once someone signs up.
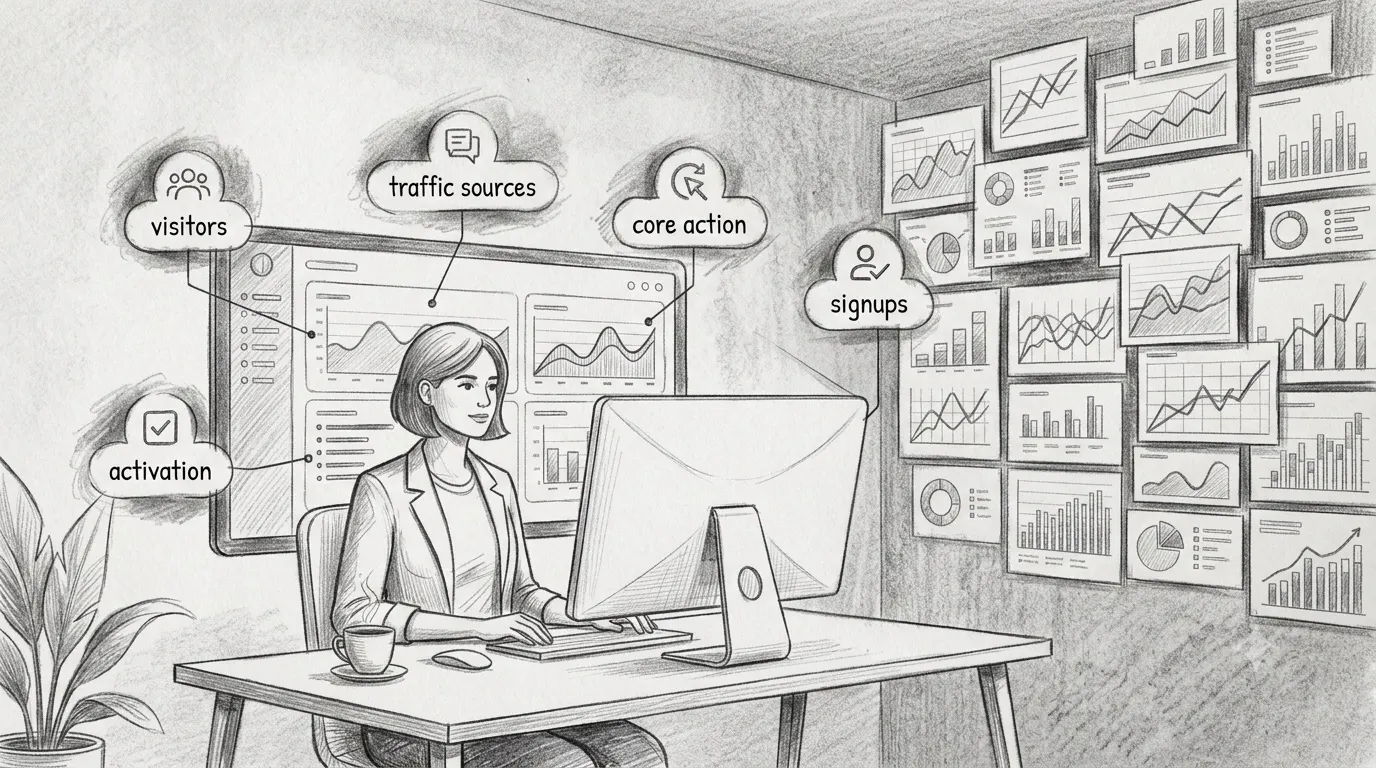
I just launched my product. What should I track first?
Launch week needs five numbers, and most analytics tools ship with forty. Visitors, sources, one action, signups and one activation signal — in that order. Everything else can wait for month two.
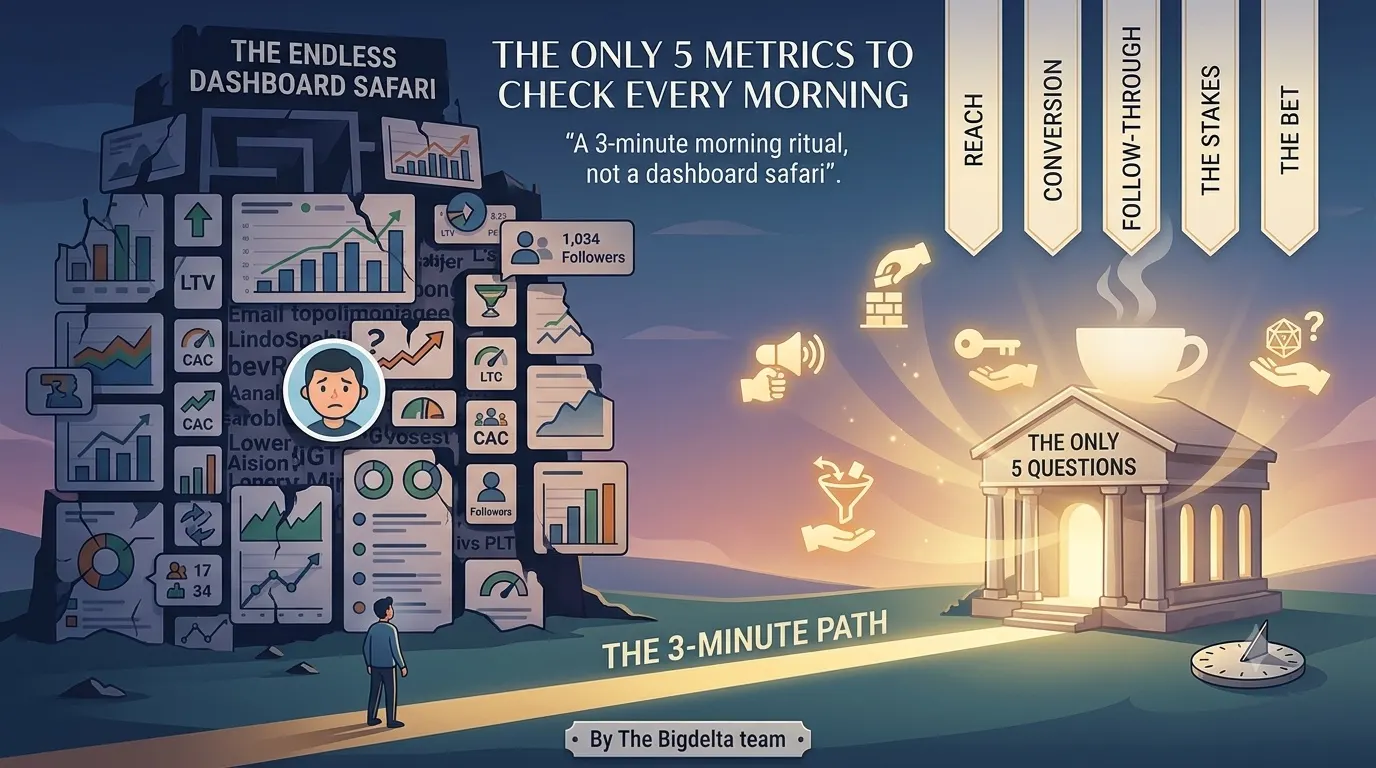
The only 5 metrics to check every morning
A morning check should take three minutes, not a dashboard safari. Five numbers with yesterday's baseline attached — and the popular ones that deliberately aren't on the list.

Session replay, explained (with examples)
A session recording is a reconstruction, not a video — a distinction that decides what it can show, what it must hide, and why it costs so little to run. How replay works, three real failure patterns, and the workflow that keeps it from eating afternoons.
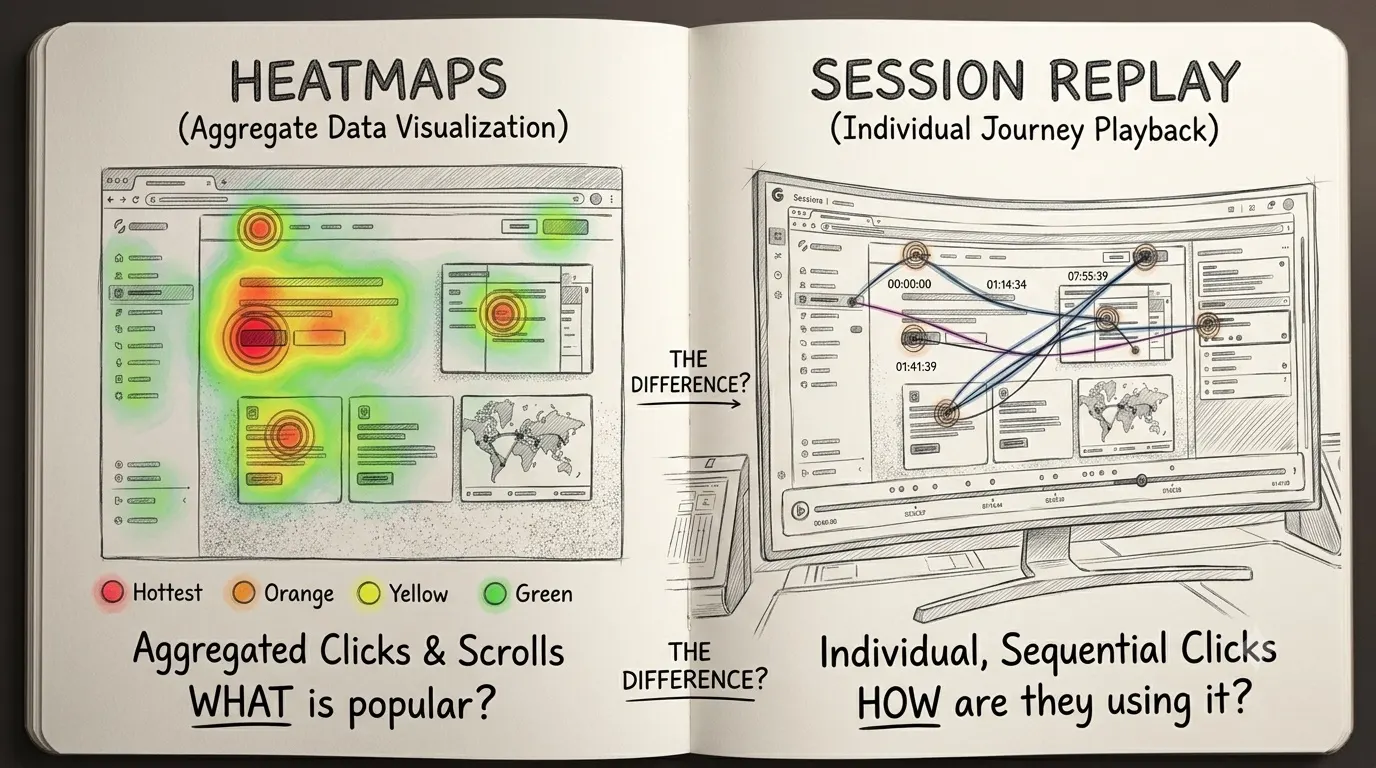
Heatmaps vs. session replay: what's the difference?
One shows a thousand visitors on a single page, the other shows one visitor across a whole visit. When each is the right tool — and the specific ways each one lies.
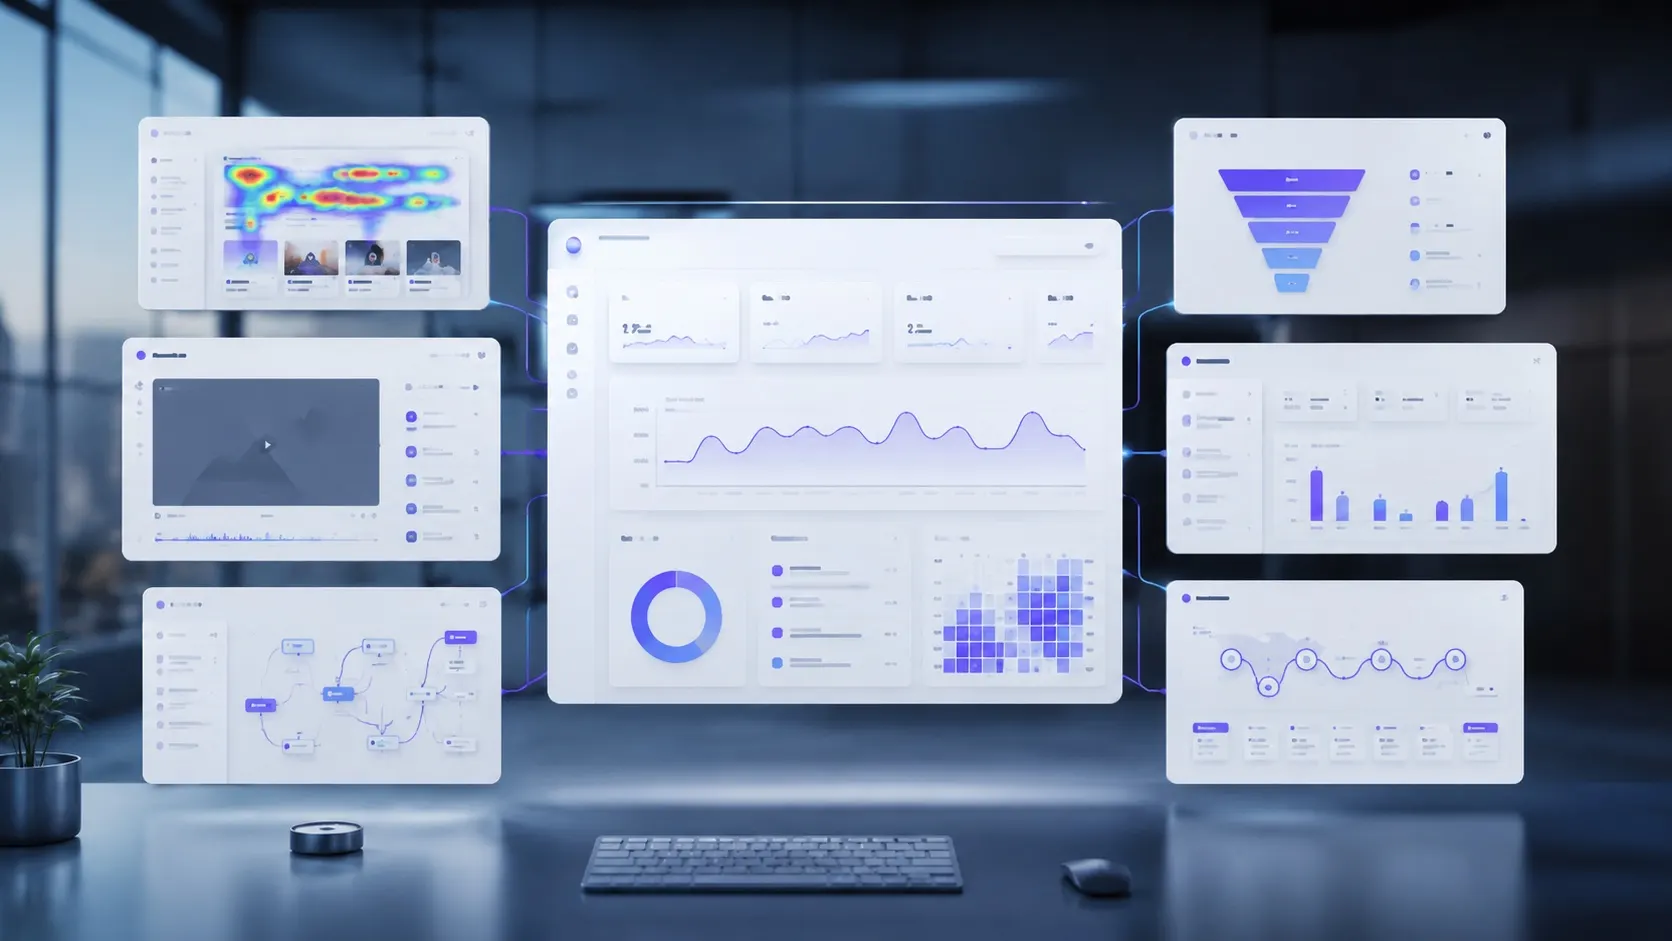
Best Hotjar alternatives (2026)
Hotjar has been folded into Contentsquare, and a lot of teams are shopping. The alternatives compared in plain language — what each one is for, and where the catches are.
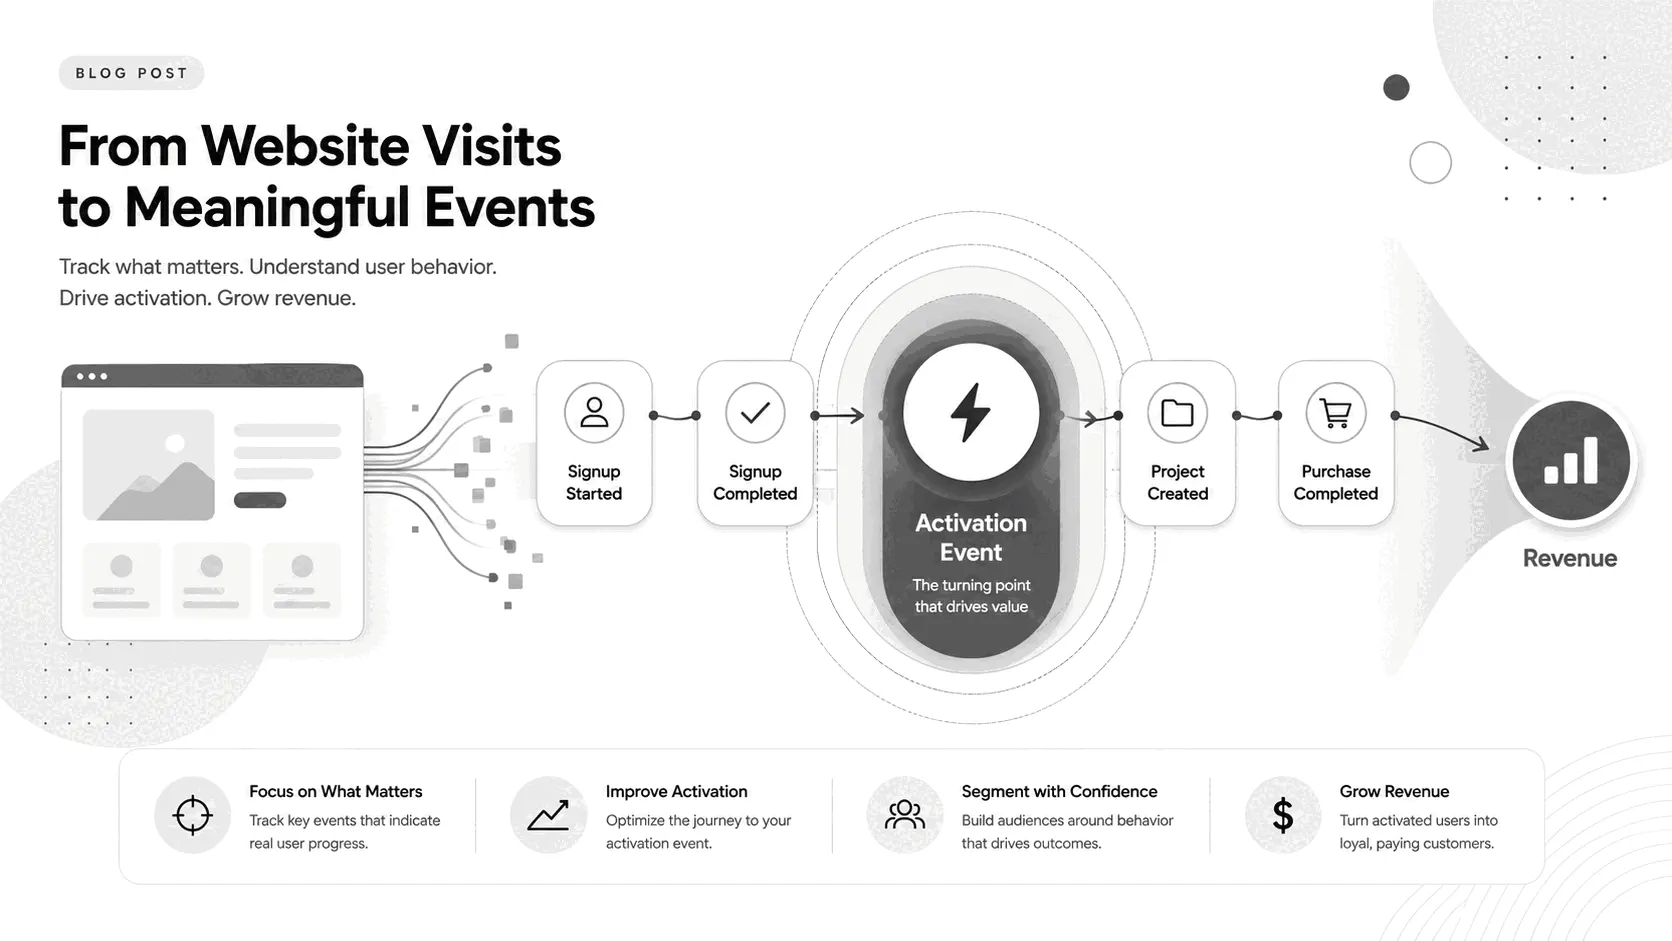
What events to track on your website
There's one event worth more than all the rest: the action that predicts whether a new user sticks around. Here's how to find it — and the short list of others actually worth tracking.
Traffic sources: direct vs. organic vs. referral vs. paid
Four buckets decide where your visitors 'came from' — and the biggest one is a catch-all for traffic the tool couldn't identify. What each source really means, why 'direct' misleads, and why the top source of visits is rarely the top source of revenue.
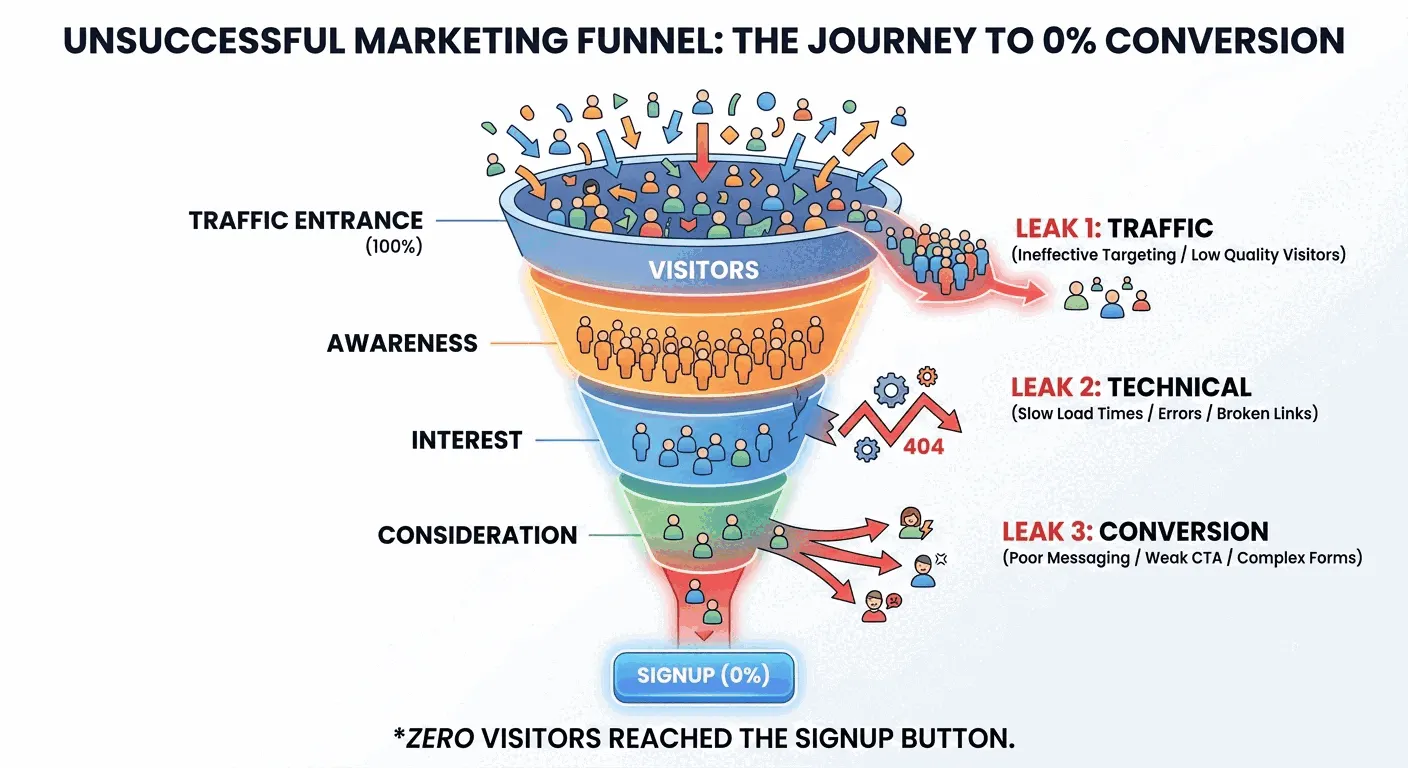
Nobody signed up. Here's what to check first
Zero sign-ups after a launch rarely means the idea flopped — usually it's a broken form, an invisible offer, or a vague pitch. The order to check them in, before you touch the product.
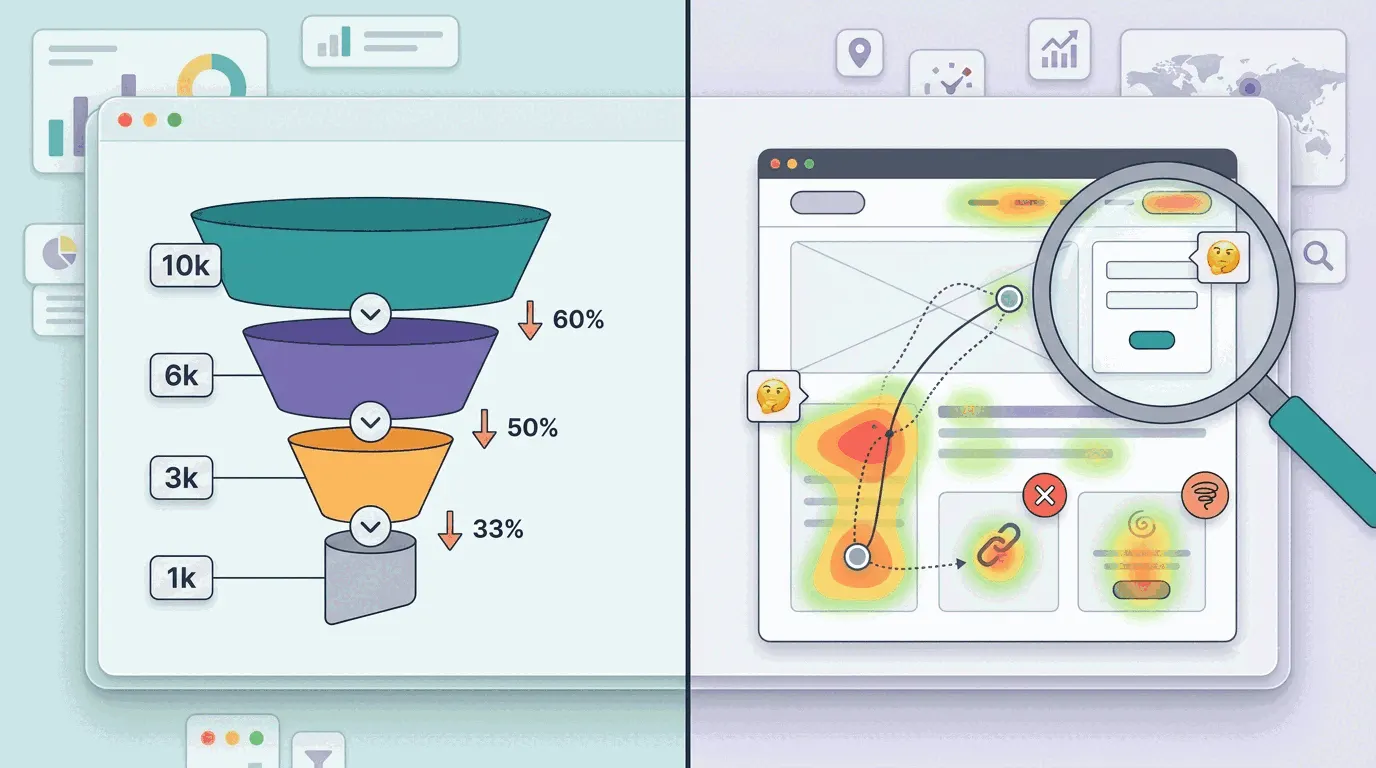
How to see where users get stuck on your website
Session recordings and heatmaps turn a drop-off number into a video of the exact moment someone gave up. The four friction patterns to look for, and the four-step workflow for finding yours.
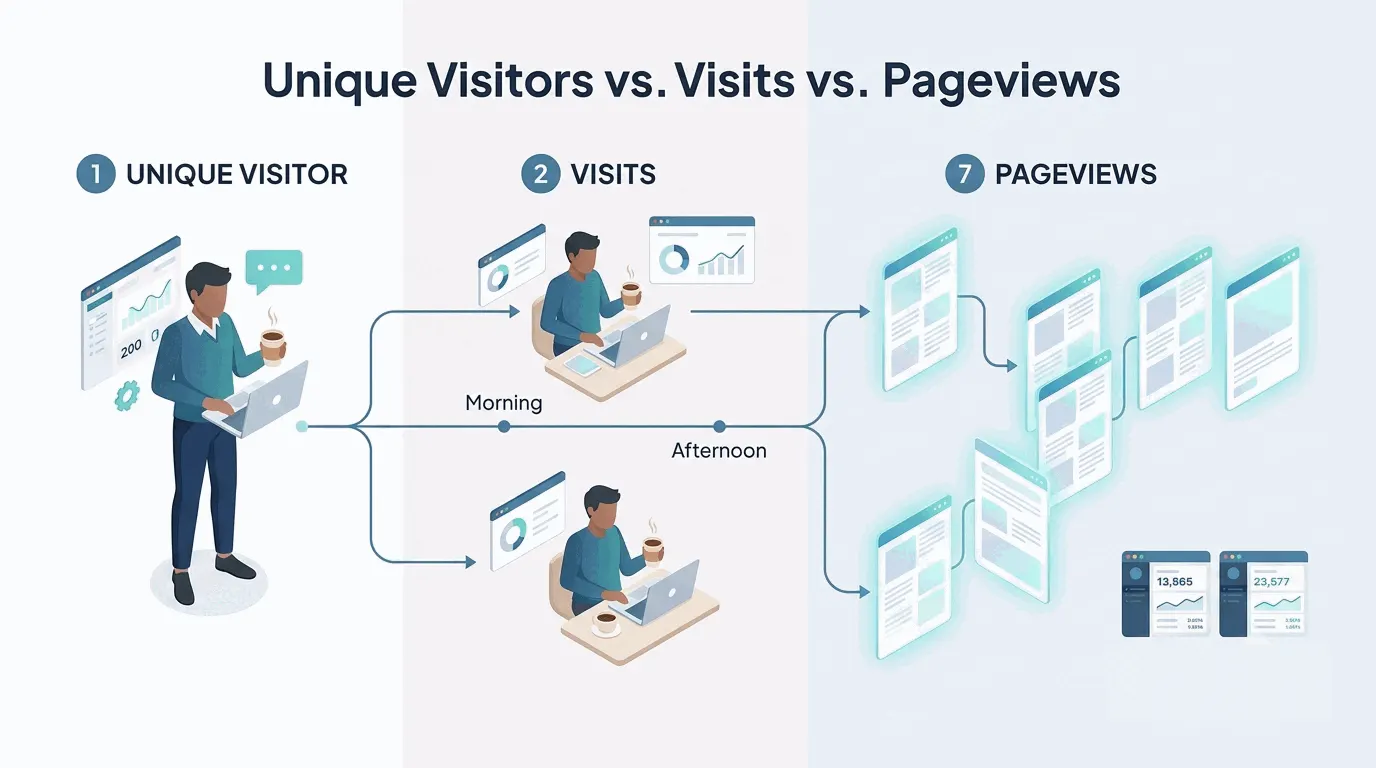
Page views vs. visits vs. unique visitors
One person, two coffee breaks and seven pages is 1 visitor, 2 visits and 7 pageviews. Which number to quote, when, and why no two tools ever agree.
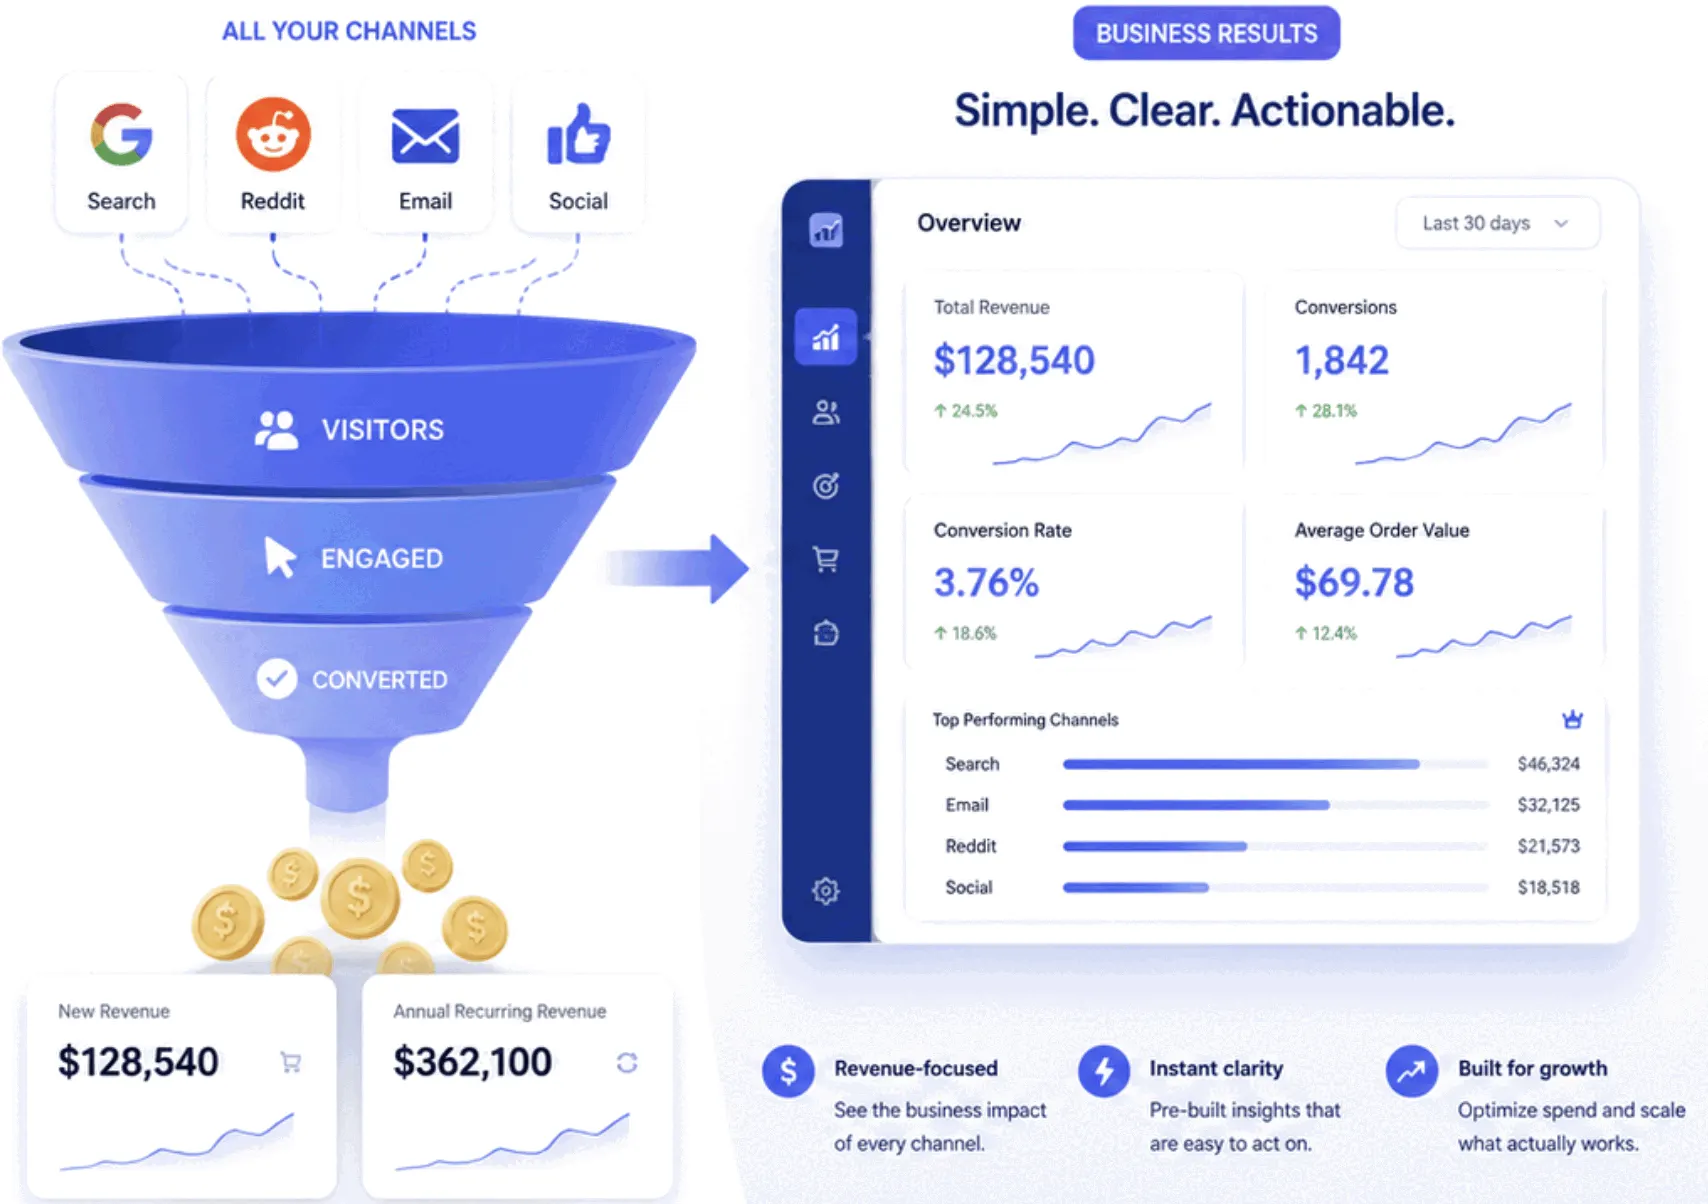
A simple Google Analytics alternative that shows revenue
GA4 can answer almost any question — after a property, a data stream, a tag manager, and a weekend. Here's what a simpler tool needs to cover, and where the trade actually sits.

Checkout abandonment rate: benchmarks and how to reduce it
Roughly seven in ten started checkouts never finish. What counts as normal, how to find your leak, and which fixes actually move the number.
What is a good bounce rate?
Under 40% is good, over 70% is a flag — except for blogs, landing pages, and every other case where it isn't. What the number means and when to ignore it.

UTM parameters: a practical guide
Five little tags decide whether 'is my marketing working?' has an answer. How UTMs work, the naming rules that keep data clean, and the one place never to use them.
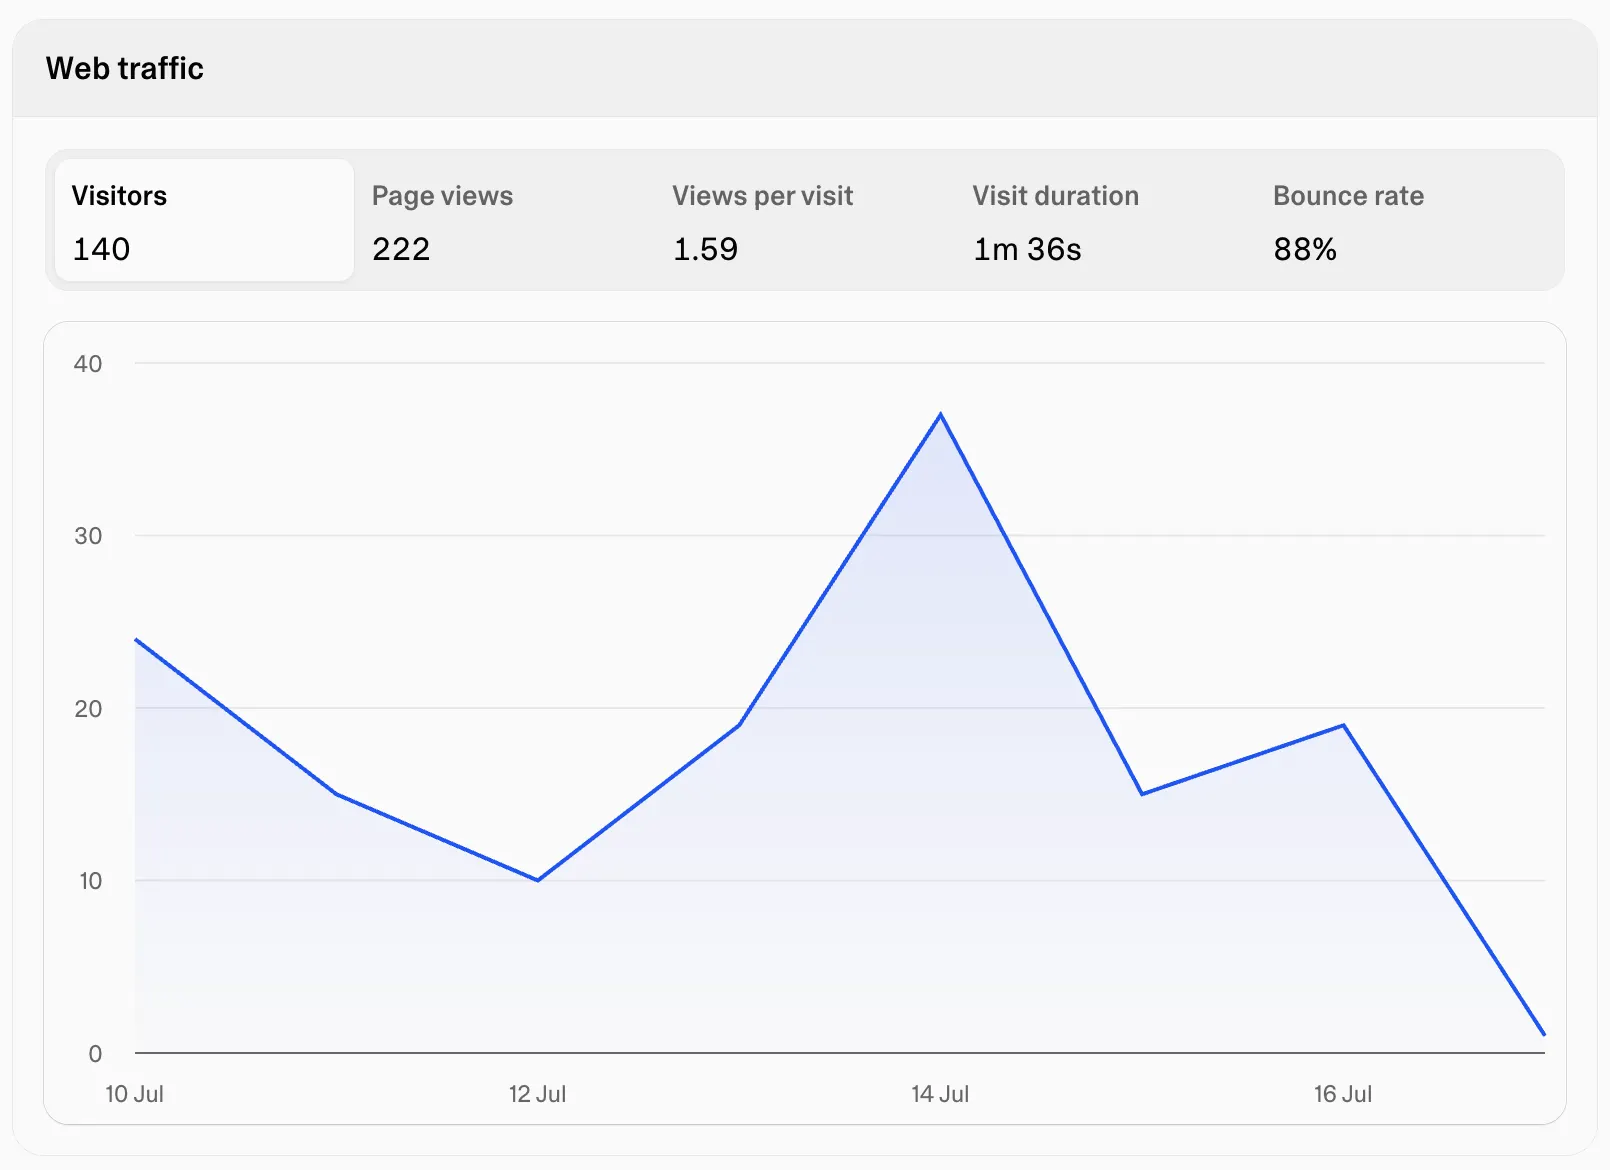
Lovable's built-in analytics: what it tracks and where it stops
Lovable ships a traffic dashboard with every published app. It answers 'did people come?' well — and goes quiet the moment you ask what they did.
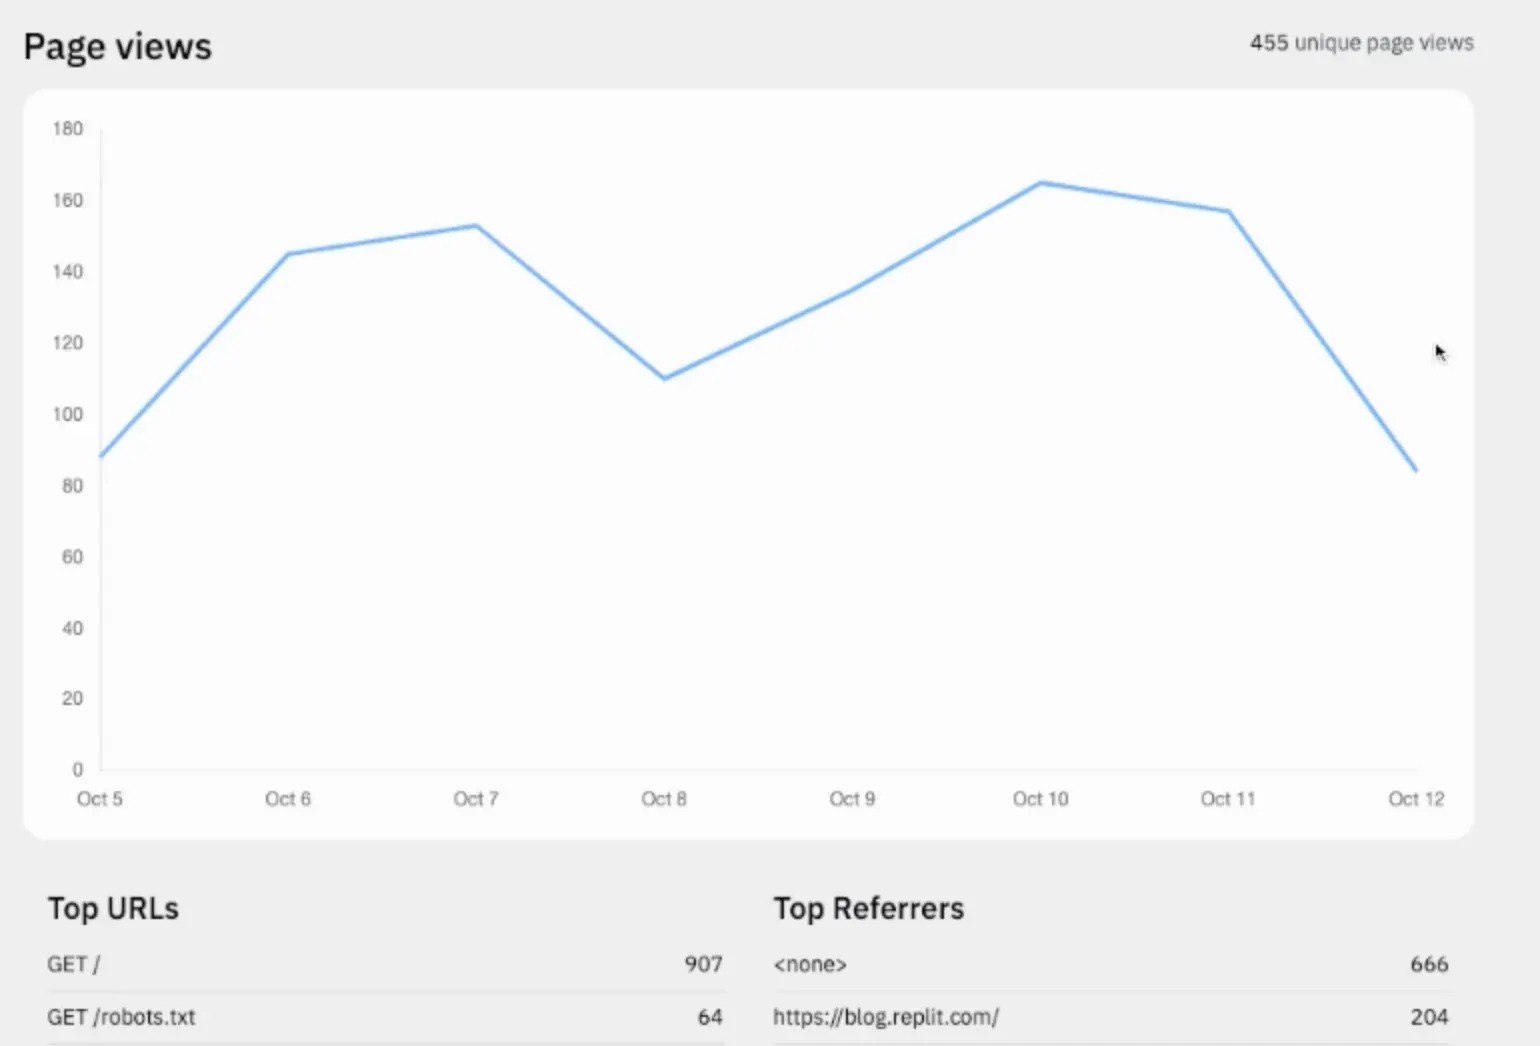
Replit's built-in analytics: what it tracks and where it stops
Replit ships genuinely good infrastructure telemetry with every published app — requests, uptime, CPU. The catch: a request isn't a person, and none of it says what users actually did.