What is a conversion funnel? Finding where visitors drop off
The path a visitor takes from arriving to converting, and the report that shows where they quit. How to pick the steps, build the funnel, and read the drop-offs honestly.
What is a conversion funnel?
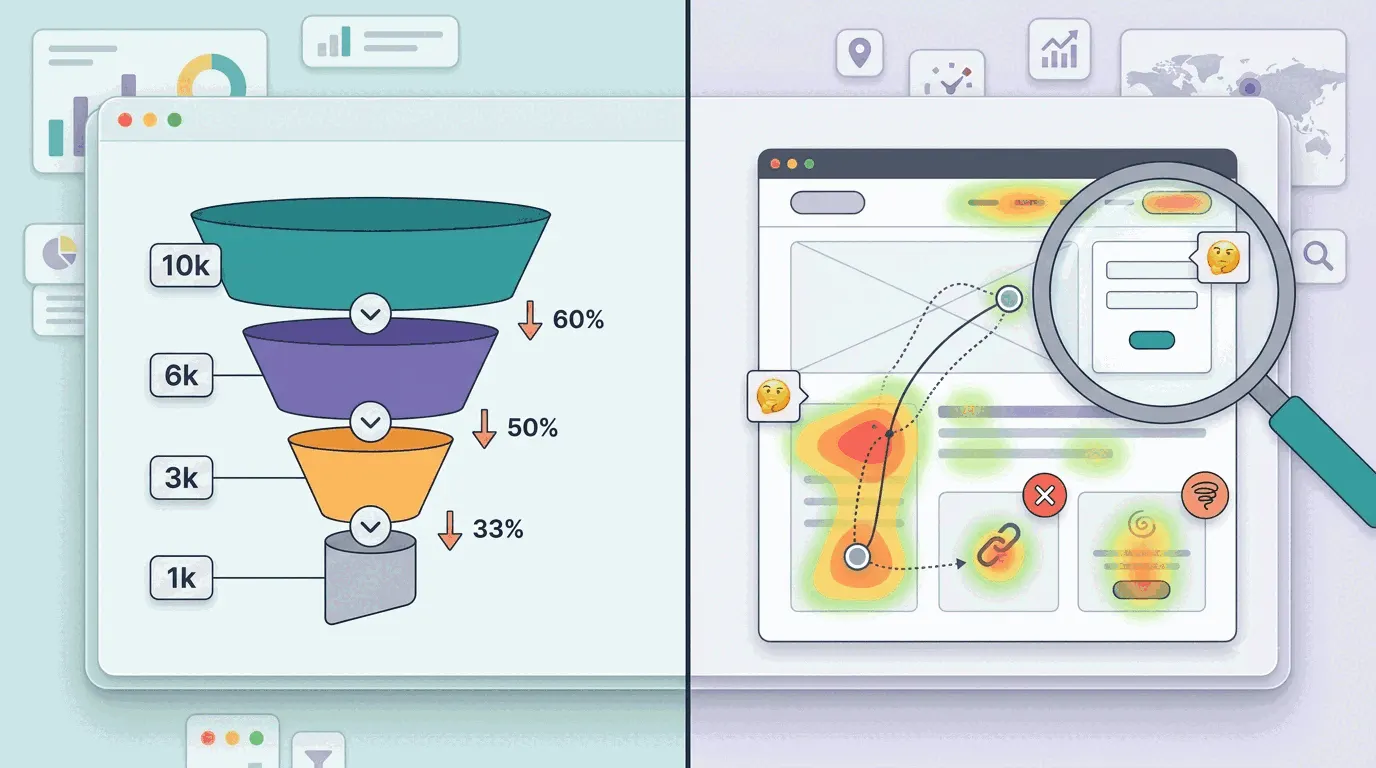
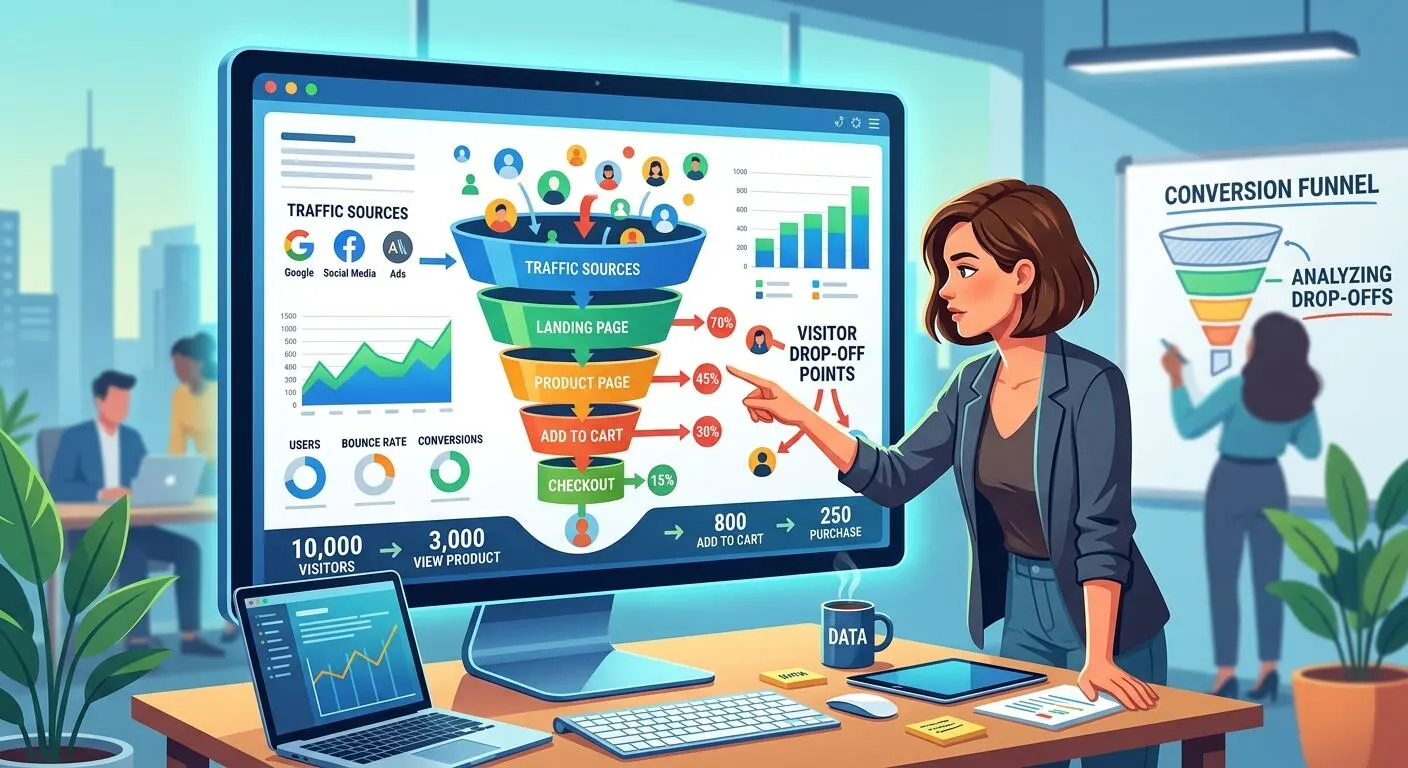
A conversion funnel is the sequence of steps a visitor moves through on the way to converting — landing on a product page, adding to cart, starting checkout, paying. Fewer people complete each step than started it, so plotted as a chart the audience narrows at every stage: wide where everyone arrives, narrow where the few convert. Hence the funnel.
The conversion at the bottom is whatever action the site exists to produce — a purchase, a signup, a booked demo. What to count as a conversion is its own decision, and it matters here because the funnel inherits it: pick the wrong bottom step and the funnel measures a journey nobody needed to finish.
Related: How to track website conversions
Is that the same as the marketing funnel?
Same shape, different material. The marketing funnel — awareness, interest, desire, action, in the classic version advertising has leaned on for over a century — describes stages of mind: how a stranger becomes a customer somewhere between seeing an ad and pulling out a card. It’s a useful planning model and an unmeasurable one, because “desire” doesn’t appear in any analytics tool.
A conversion funnel is built from things a tool can count: pageviews and events on your own site. “Reached the checkout page” is a fact with a timestamp. That’s the version this post is about; the two get confused mostly because both end up drawn as the same narrowing shape on slides.
What is funnel analysis?
Reading the drop-offs. A funnel report shows what share of people made it from each step to the next, and funnel analysis is the unglamorous work of looking at those percentages and asking which one is wrong. The end-to-end number — 2% of visitors bought — mostly restates your conversion rate. The step-by-step version adds the thing that number can’t: location. “60% of the people who started checkout quit on the shipping form” is a finding you can act on.
Two readings to resist. The first drop is almost always the biggest and almost never the problem — most visitors who land on a page were never going to buy, and losing them isn’t a leak, it’s browsing. And the biggest drop isn’t automatically the most fixable one: a steep fall between blog post and pricing page may be the natural sorting of readers from buyers, while a modest fall between cart and payment is money on the floor. The leak worth hunting is where people who have already shown intent quit anyway.
Related: What's a good conversion rate?
How do you choose the steps?
What the steps are depends on what the site is. For a store: product page → cart → checkout → purchase. For a SaaS app: landing page → signup form → account created → first real use. For a lead-gen site: service page → contact form → submitted. If the checkout stretch is where yours leaks, checkout abandonment has the benchmarks and the fixes for that specific problem — roughly seven in ten started checkouts never finish, so you’ll have company.
Rules that keep a funnel honest:
- Use steps you actually track — a URL a visitor loads, or an event a tool records, like a click or a form submit. A stage you can’t observe can’t be a step.
- Keep the steps sequential and unavoidable: every converting visitor must pass through each one, in order. Optional detours — an FAQ page, a coupon field — belong in a segment comparison, not in the funnel.
- Three to five steps is usually plenty. More steps mean fewer people per step and noisier percentages, not more insight.
- Start the funnel at intent, not at arrival — “viewed a product page”, not “visited the site” — unless the question is specifically about the top.
Related: Checkout abandonment benchmarks
How do you build one?
In Google Analytics, funnels live in Explore: a “funnel exploration” where you assemble steps from the events GA4 records, choose whether the funnel is open (visitors may join at any step) or closed (step one only), and read the step table it produces. It’s available on the free tier and it’s capable — it’s also one of GA4’s expert corners, and building the steps means already knowing which events your setup tracks. Lightweight analytics tools vary more than you’d expect here: some skip funnels entirely, others reserve them for higher tiers.
Related: Bigdelta funnels
How do you read one without fooling yourself?
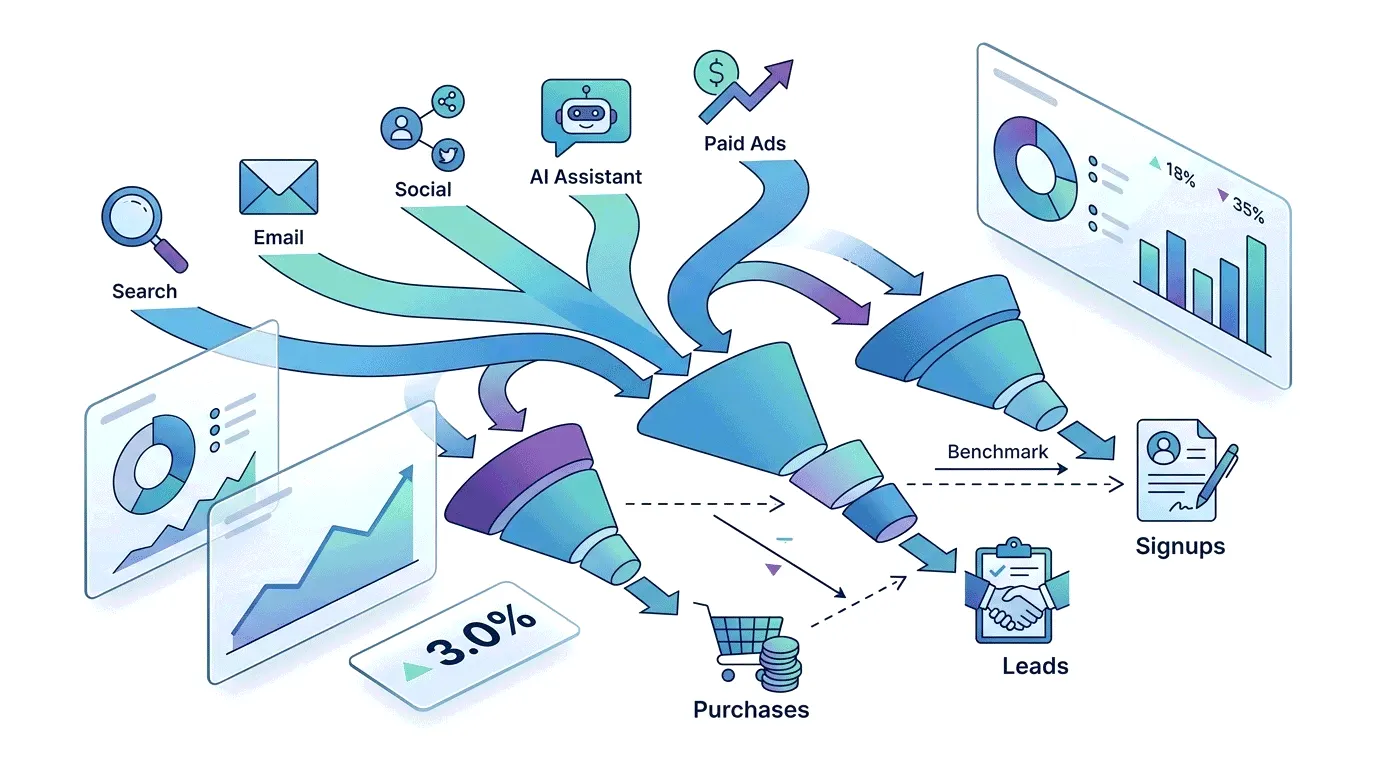
Compare, don’t judge. A funnel’s percentages mean little in isolation — there is no credible universal benchmark for what a step “should” convert at, whatever a listicle claims. The honest comparisons are the same funnel over time (did the release change step three?) and the same funnel across segments: by traffic source, by device, by new versus returning visitors. A step that holds at 40% for a year and drops to 25% the week of a redesign has told you something no benchmark could.
And know what the funnel can’t say. It locates the leak; it doesn’t explain it. The shipping form loses 60% — because of a surprise cost? A broken field on iPhones? A mandatory account signup? The chart looks identical in all three cases. That’s the point to stop staring at percentages and watch the sessions that fell out.
Related: How to see where users get stuckSession replay, explained
The practical takeaway
Build one funnel, for the one action your site exists to produce, out of three or four steps you already track. Check it weekly and after every release. When a step moves, find out why before shipping a fix; when it hasn’t moved in months, that’s a baseline worth having, not a failure. It slots naturally into the short list of numbers you already look at.
Related: Five metrics to check every morning