Simple web analytics
for ecommerce stores
Ecommerce analytics you can actually read. Follow shoppers from first visit to checkout, and see orders and revenue next to the sessions that produced them.
Rank channels by
orders, not clicks.
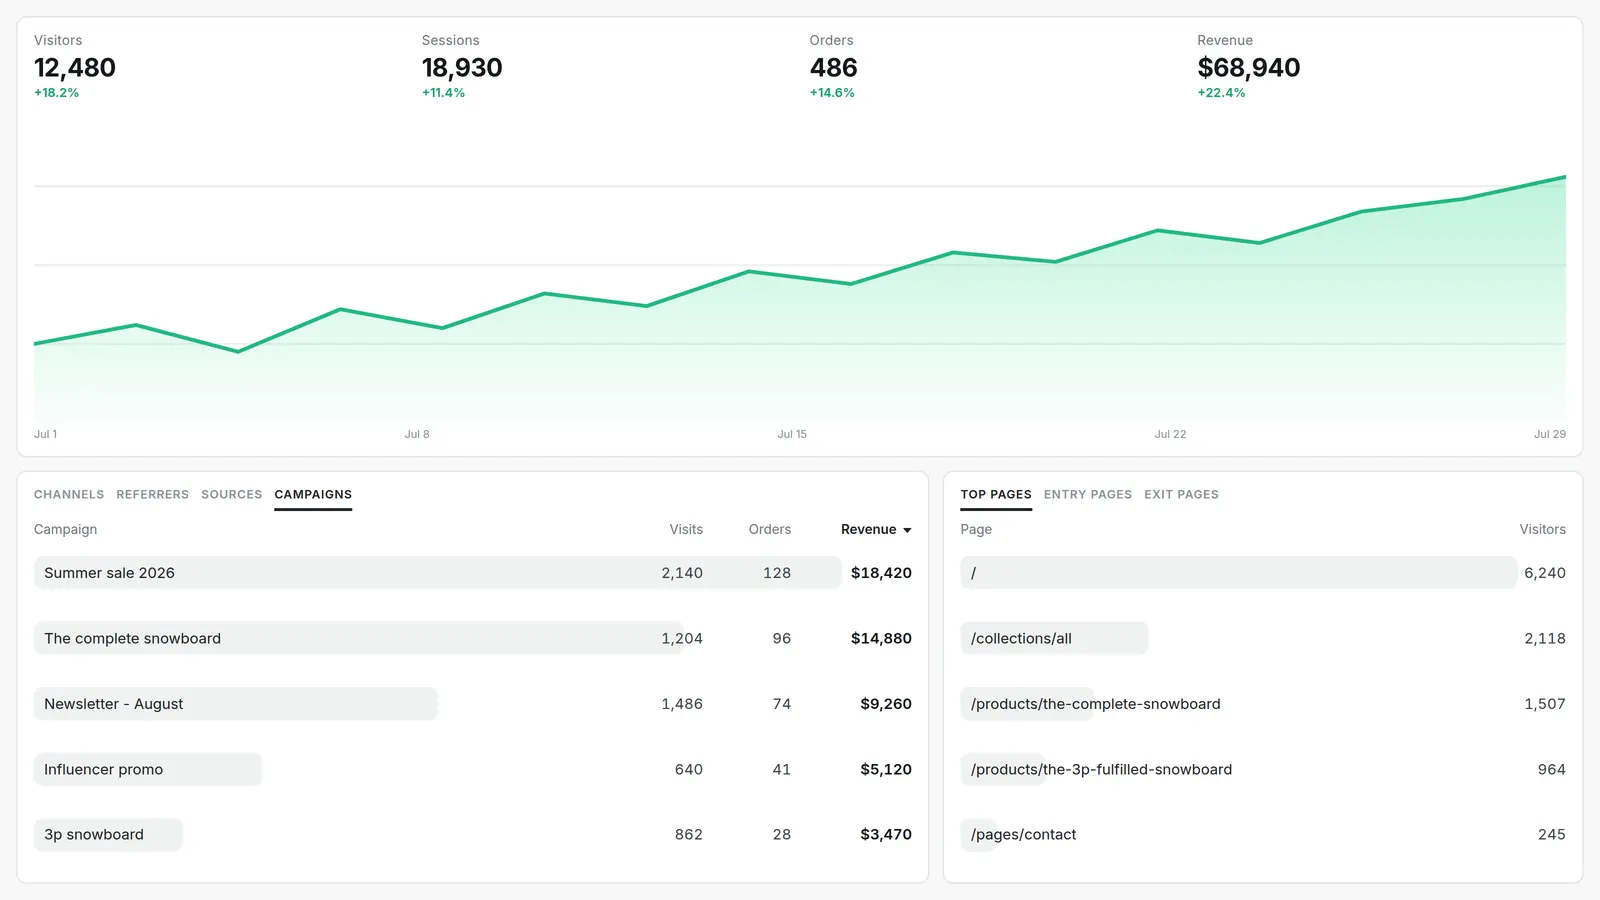
Every visit is attributed to its source. Each channel and UTM campaign shows the orders and revenue it drove, so you know where the buyers come from before you spend more on ads.
Is your buy button
below the fold?
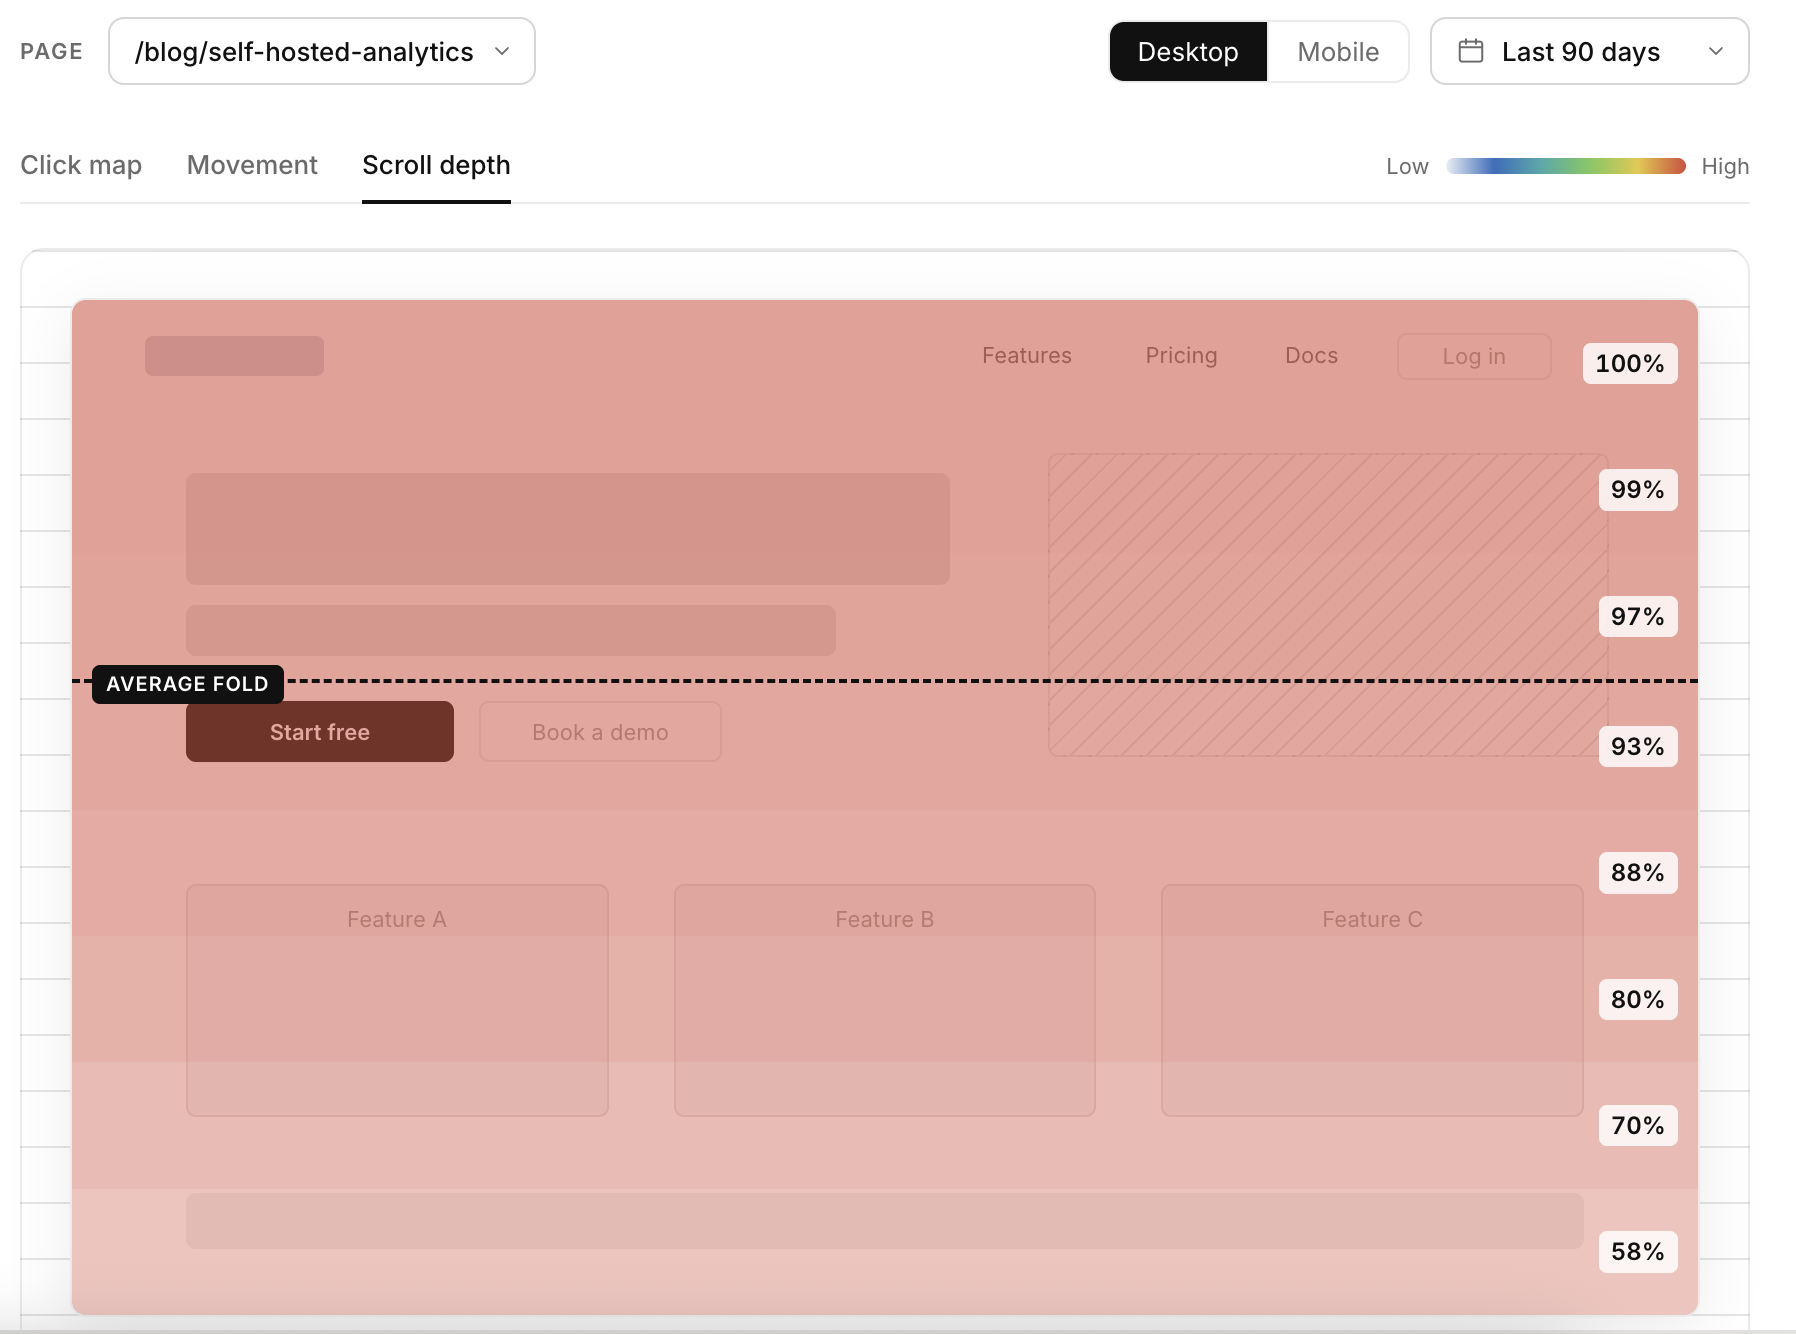
Scroll maps show how far shoppers get on your product and landing pages, with the average fold marked. Click maps show which elements they actually use, on desktop and on mobile.
Find where carts
get abandoned.
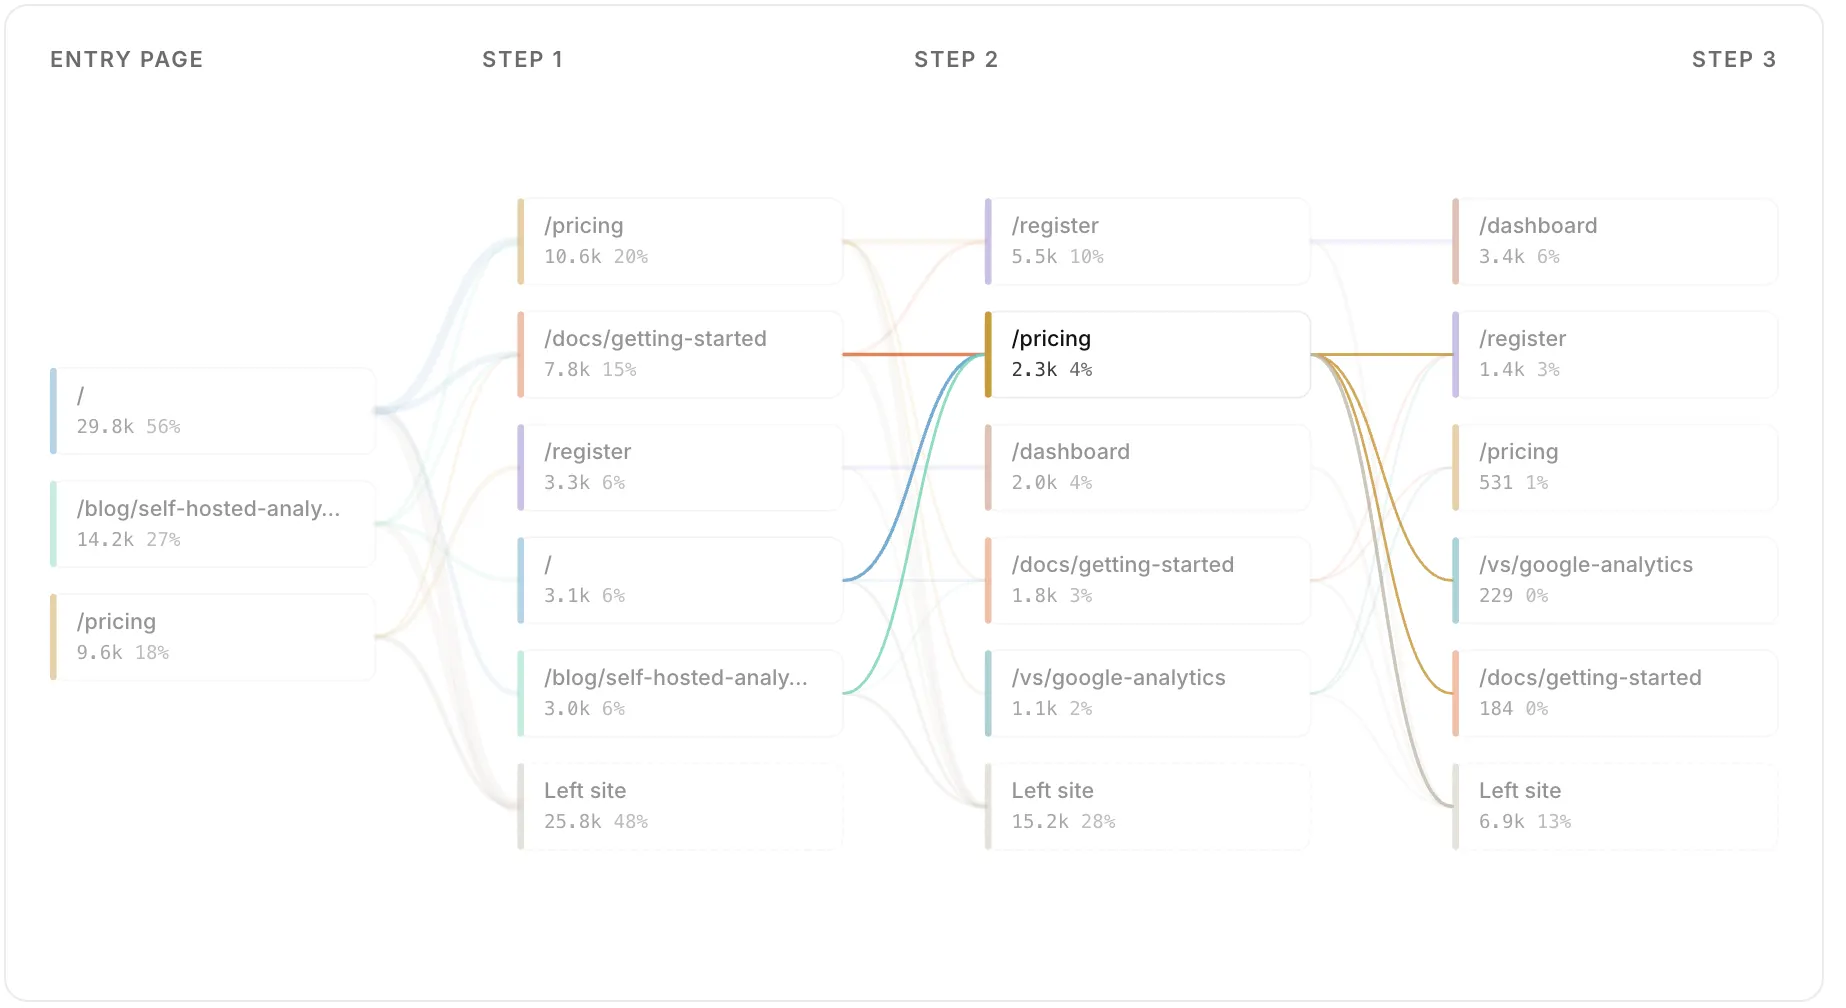
Build a funnel from product page to cart to payment and see where shoppers leave. Then watch the session replays behind any drop-off step.
Top features
The numbers a store runs on.
Visitors, sessions and pageviews in real time, next to the orders and revenue they produced. No sampling and no day-long delays.
Visitors & pageviews
Track unique visitors and total pageviews with real-time updates
Orders beside sessions
Orders and revenue appear next to the visits that produced them
Conversion rate
Computed for you, per page, per channel and per campaign
Entry & exit paths
See where shoppers land and where they leave your store
From product page to payment.
Define the steps of your checkout as a funnel and see how many shoppers pass each one.
Step-by-step drop-off
Track product page to cart to checkout and see where shoppers leave
Replay the drop-offs
Watch the session replays behind any funnel step
Filtered recordings
Find sessions by funnel step, error, UTM or page path
Custom events
Track add-to-cart, wishlist saves and anything else that counts
Know which channels bring buyers.
Every visit is attributed to its source, so budget goes to the channels that produce orders instead of clicks.
Referrers & channels
Traffic split by search, social, referral, email and direct
Revenue by source
Each source shows the orders and revenue it drove, not just visits
UTM campaigns
Break down campaigns by source, medium, term and content
Landing pages
Find the pages that pull shoppers in and the ones that lose them
See the store the way shoppers do.
Watch real sessions and see click and scroll patterns on your product pages, on desktop and on mobile.
Full session replay
Replay every click and scroll from a real shopping session
Click maps
See which elements shoppers actually use on each page
Scroll maps
How far shoppers get on product pages, with the average fold marked
Privacy controls
Mask sensitive inputs and exclude internal team traffic automatically
Compliant for EU shoppers.
Bigdelta is first-party by design, with EU data storage. You control what gets recorded and how long it's kept.
Cookieless tracking
Run store analytics without cookies and skip the consent banner
GDPR & CCPA ready
Collect only what you need, with EU data hosting available
First-party data
Your data stays yours — never shared with advertising networks
Data retention controls
Choose how long raw events and profiles are stored
Store data without
the setup project.
Install in your store
One snippet for Shopify, WooCommerce or WordPress. No theme surgery and no changes to your checkout.
Sales line up with sessions
Orders and revenue appear next to the visits that produced them, so conversion rates are computed for you.
See which channels bring buyers
Rank traffic sources by orders and revenue instead of raw visits.