Heatmaps
Visualize how visitors interact with every page — and instantly spot what's getting attention and what isn't.
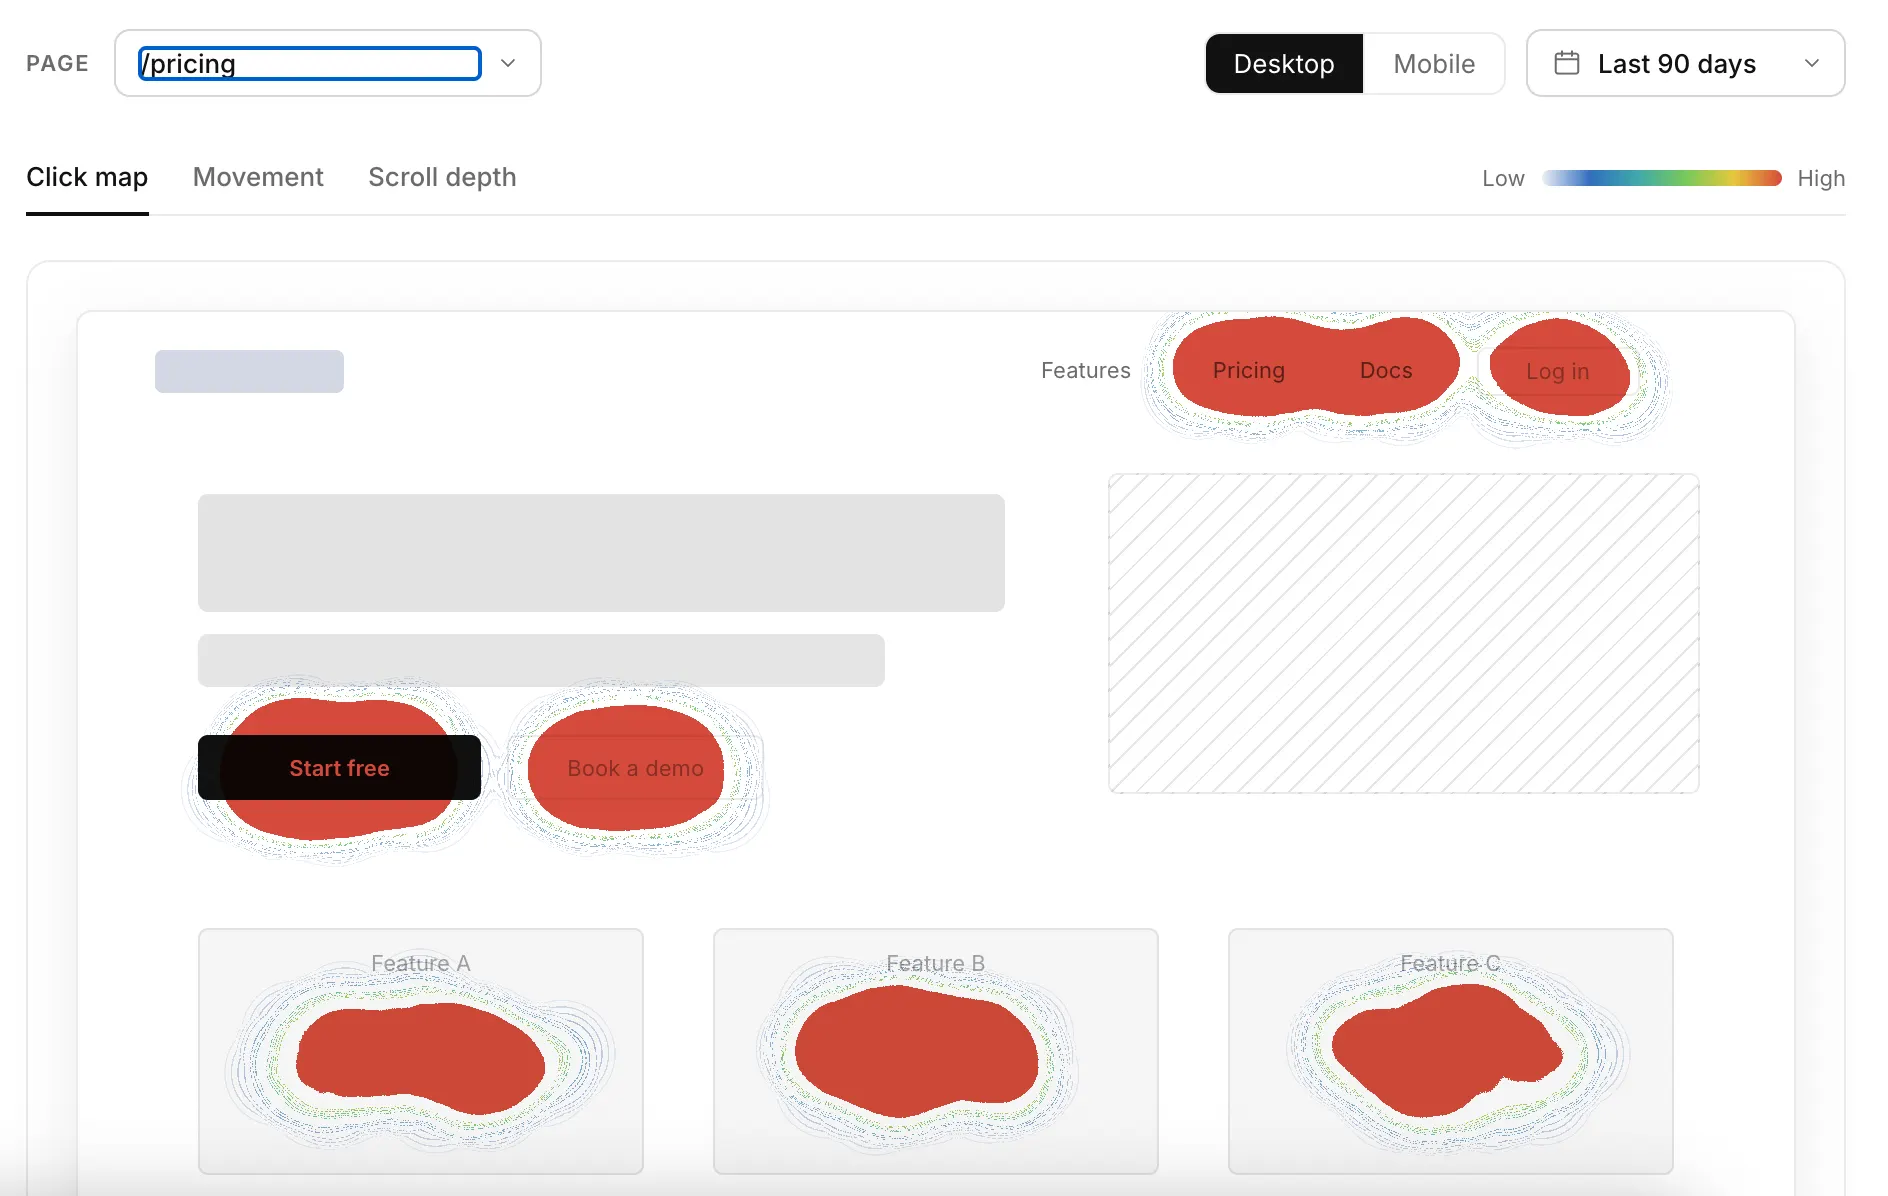
Click heatmaps
for every page.
See which buttons, links and areas get the most clicks so you can optimize your layout with confidence.
Find the spots
people ignore.
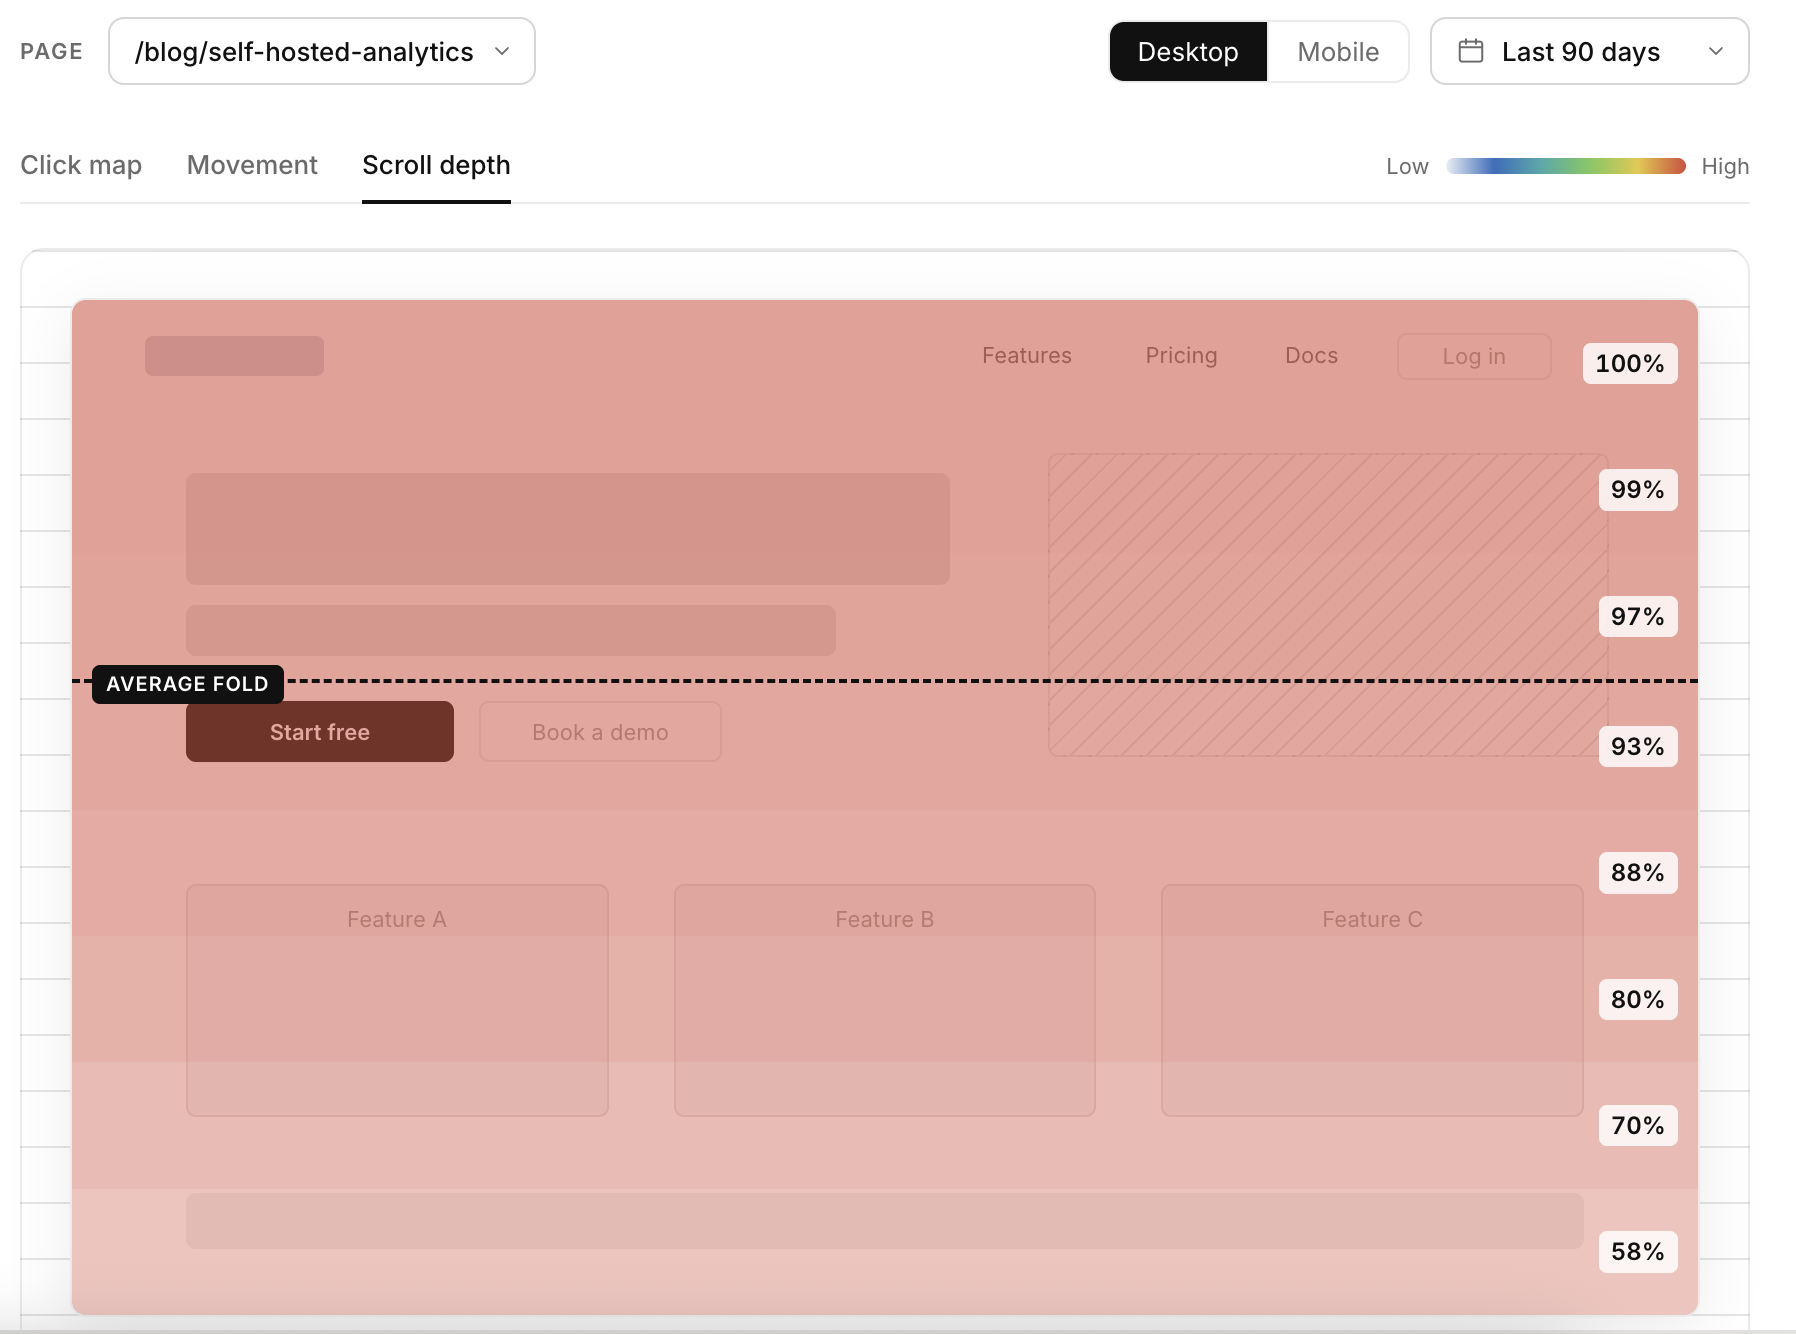
Scroll and attention maps show how far visitors go and what they actually see.
Top features
See exactly what gets clicked.
Every click on every page, aggregated into a single visual you can read in seconds.
Click density
Hotspots show which buttons, links and images pull attention
Dead clicks
Spot clicks on elements that do nothing and frustrate visitors
Rage clicks
Find repeated frantic clicking that signals something is broken
Element ranking
A sorted list of the most-clicked elements on the page
Find where the page ends for most people.
Know how far visitors actually scroll before deciding whether to stay or leave.
Scroll depth
See the percentage of visitors reaching each point on the page
Average fold
Understand what's visible before anyone scrolls at all
Drop-off line
Identify the exact section where attention collapses
Content placement
Move CTAs above the point where visitors stop reading
Measure time, not just position.
Attention maps weight each area by how long visitors actually spend looking at it.
Time-on-area
See which sections hold attention and which get skimmed
Move maps
Track cursor movement as a proxy for reading on desktop
Above-fold value
Check whether your hero earns the space it takes
Section comparison
Compare engagement between competing page sections
Different visitors behave differently.
Split every heatmap by who the visitor is and where they came from.
Device split
Separate desktop, tablet and mobile heatmaps automatically
Traffic source
Compare how paid, organic and referral visitors engage
New vs returning
See what first-time visitors miss that regulars find
Custom segments
Filter by plan, country, campaign or any tracked property
Heatmaps on top of your metrics.
Heatmaps share the same script and data as the rest of Bigdelta.
Page-level context
Open a heatmap directly from any page in your analytics
Bounce diagnosis
Pair a high bounce rate with the scroll map that explains it
Campaign landing pages
Check how each campaign's traffic engages before you scale
One script
Analytics, heatmaps and replays come from the same snippet
Zoom from the pattern to the person.
Heatmaps tell you what happens in aggregate. Replays show you why.
Hotspot drill-down
Click any hotspot and watch the sessions behind it
Dead-click replays
Watch the visits where a click went nowhere
Scroll drop-off replays
See what visitors did right before they stopped scrolling
Shareable evidence
Send a heatmap and matching replay to your team
Aggregate behaviour, not identities.
Heatmaps are built from anonymous interaction data by default.
No personal data
Heatmaps record coordinates and elements, not identity
Input masking
Form fields and payment inputs are never captured
Page exclusions
Skip heatmap collection on admin or account pages
EU hosting
Data is stored on EU servers and never sold or shared
Who is it for?
| Role | Use cases |
|---|---|
| Growth Marketers | See whether landing page CTAs actually get clicked before spending more on traffic |
| Founders | Check at a glance which parts of the homepage people read and which they skip |
| Product Engineers | Catch dead clicks and broken interactive elements after a deploy |
| Growth Engineers | Prioritize layout experiments using real scroll depth and click density |
| Content & SEO | Find where readers stop scrolling and restructure the page around it |
Works well with Bigdelta apps
See all appsUse Heatmaps with these Bigdelta apps to maximize results.
Notifications
Get alerted when rage clicks or dead clicks spike on a key page, so a broken button never sits unnoticed for a week.
Product Analytics
Combine heatmaps with event data to see not just where people click, but what those clicks lead to further down the journey.
Ad Attribution
Break heatmaps down by campaign and see how each paid audience engages with the landing page you're sending them to.