Demo request funnel: how to measure it
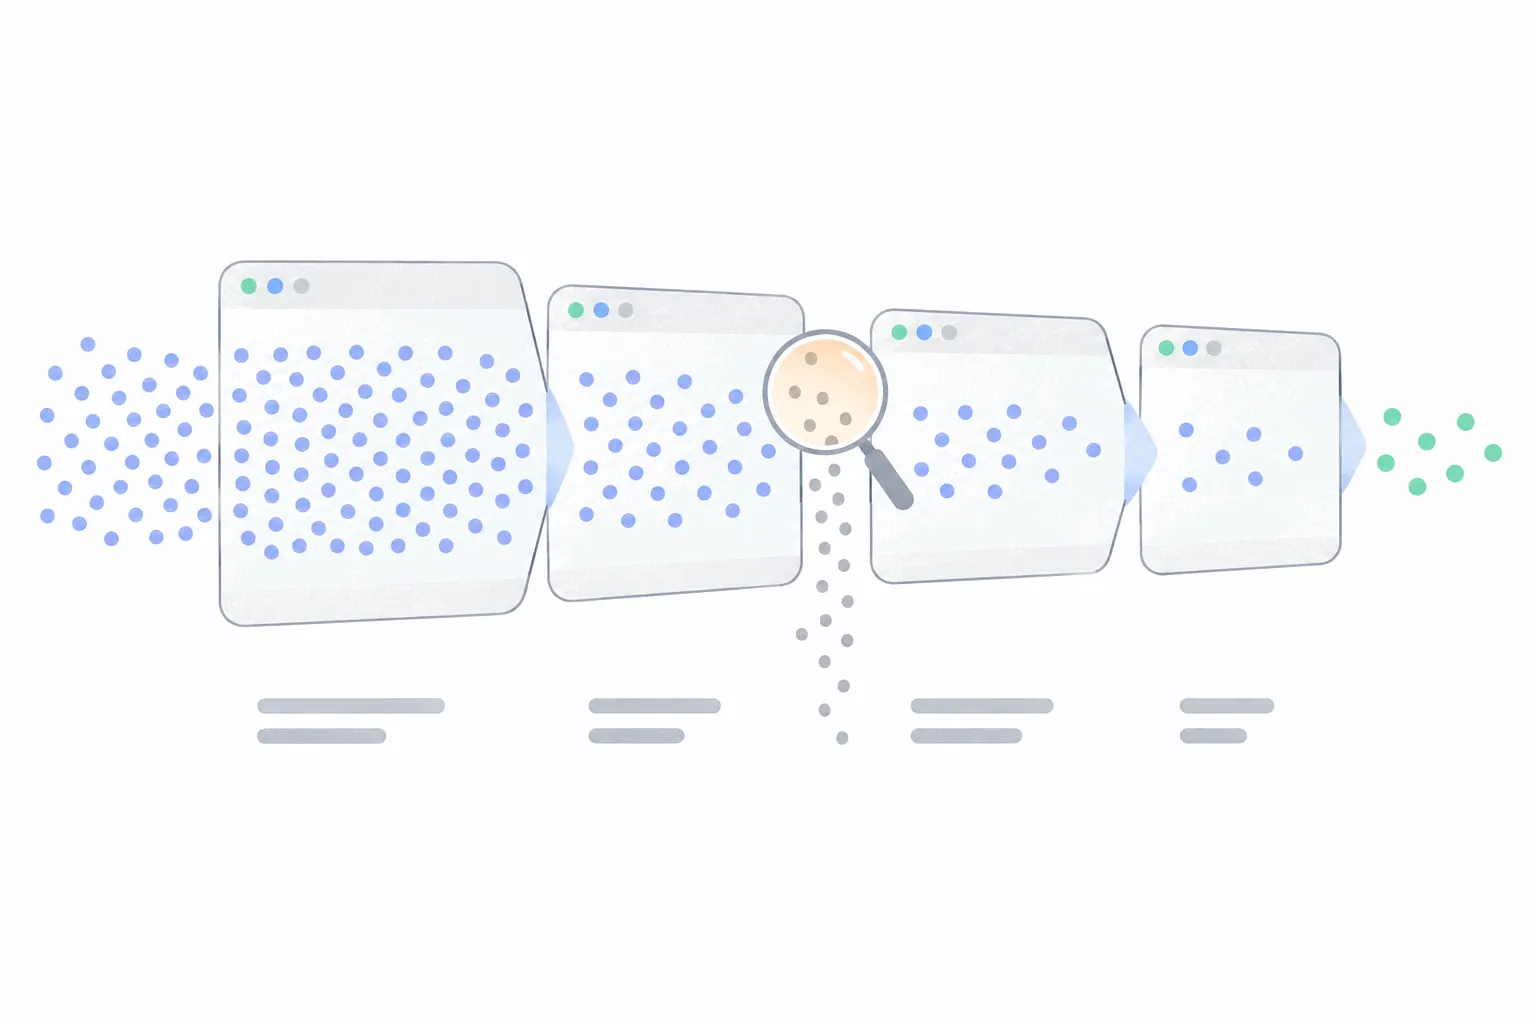
A demo request looks like one conversion. It's six steps across two systems, and the losses concentrate in the half your analytics tool can't see: the scheduling widget, the calendar, the meeting itself. The events to track, and the seam where attribution quietly dies.
Six steps, two systems
The full demo funnel is: demo page viewed, form started, form submitted, meeting booked, meeting held, opportunity created. The first three are ordinary website events, the same trio any signup funnel tracks. The last three live in other systems - the scheduler knows about bookings, the calendar and the sales team know about attendance, the CRM knows about opportunities.
Most teams instrument the first three and eyeball the rest, which is how a funnel report ends up claiming a conversion rate it can't support. A submitted form is not a meeting, and a booked meeting is not a held one. The measurement work is stitching the two halves together so one report covers the whole chain.
A submitted form is not a booked meeting
The best-documented evidence on the gap comes from Chili Piper, a scheduling vendor that published a benchmark report from close to 4 million B2B form submissions across its customer base in 2024. In that data, 14.1 percent of submissions get disqualified by routing rules before anyone offers them a time, and of the qualified remainder, 66.7 percent actually book a meeting.
Read that second number again: a third of people who asked for a demo and passed qualification never pick a slot. That loss is invisible if your funnel ends at the thank-you page. It's also the cheapest drop-off in the whole chain to attack, because these are people who already said yes - showing the calendar immediately after submit, instead of promising an email, is the standard fix.
Is there a good demo request rate?
No published visitor-to-demo-request benchmark survives a methodology check. The tables that rank for the query state no sample size, no date range and no definition of the denominator, and our visitor-to-signup benchmarks post reached the same conclusion when it went looking. Anyone quoting an average demo request rate is quoting a guess.
What does exist is form-level data. Across 93 million form sessions, form-analytics vendor Zuko finds about 45 percent of people who see a form complete it, and about 66 percent of those who start one finish it - figures covered properly in our form conversion benchmarks. A demo form is a form, and those two legs plus the booking data above are the comparisons with actual evidence behind them.
Instrumenting the website half
Three events cover it: demo form viewed, demo form started, demo form submitted. The definition trap sits on the middle one - tools disagree on whether a click into a field or the first keystroke counts as a start, and the signup funnel post covers why that choice moves the numbers. Pick one definition and keep it.
If your routing disqualifies some submissions, emit that as its own event too. A funnel that only sees submitted and booked will report the disqualification loss as mysterious booking failure, and the fix for bad-fit traffic (change who you attract) is entirely different from the fix for booking friction (change what happens after submit).
The scheduler seam, where attribution dies
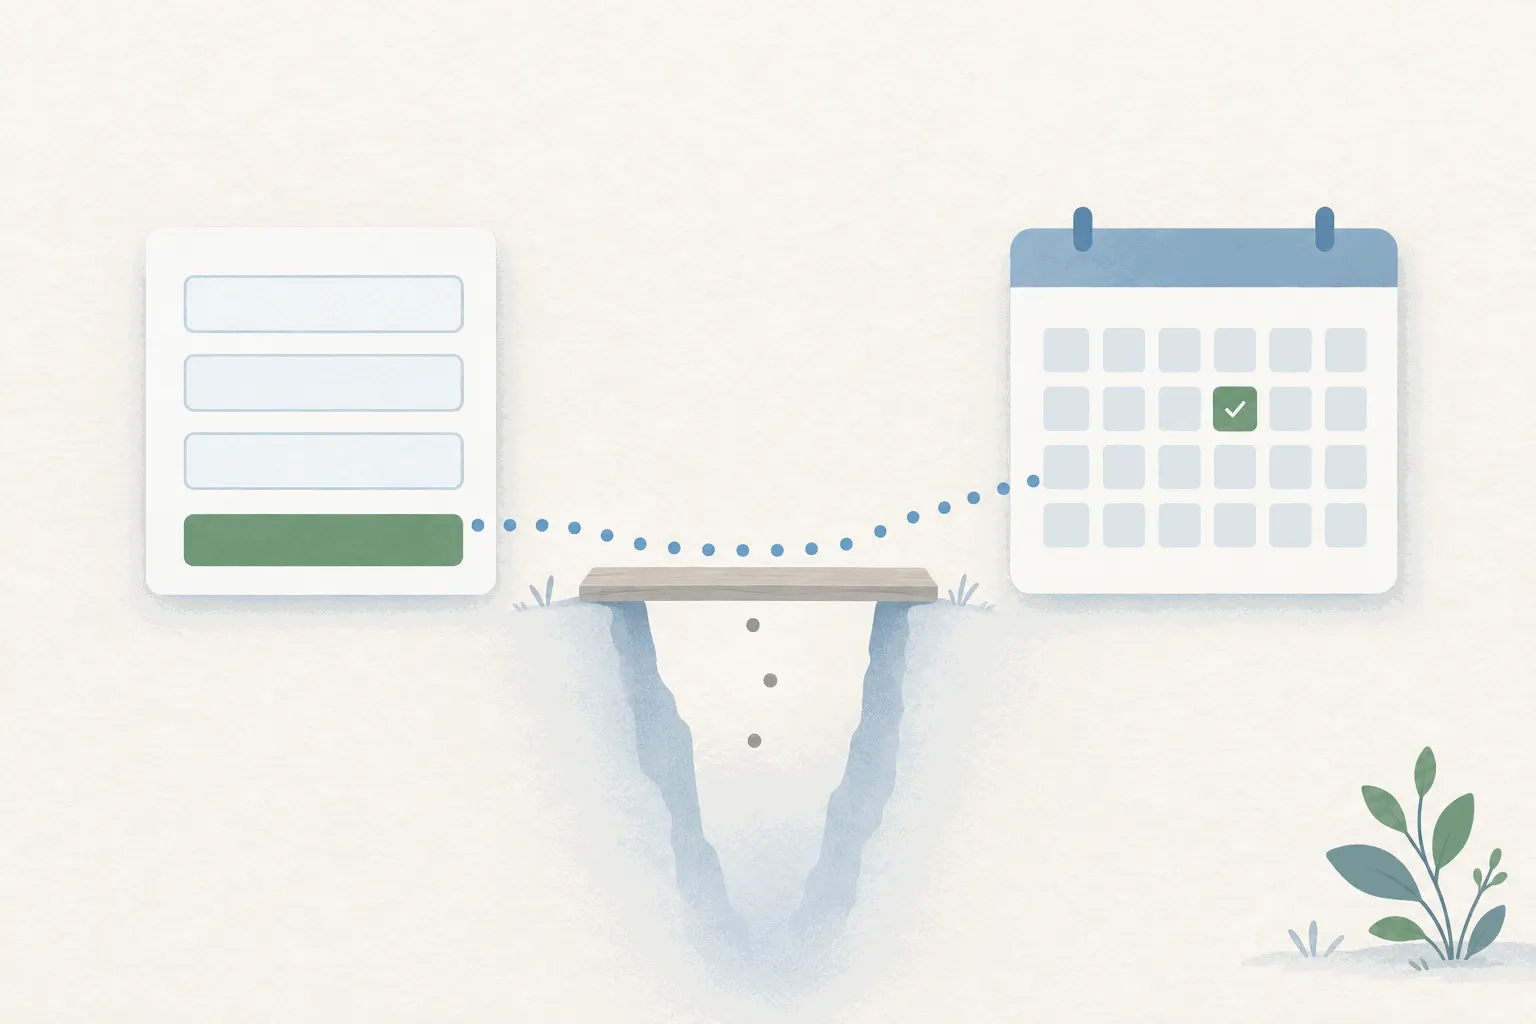
Booking widgets are embedded as iframes from the scheduler's own domain, and an iframe is a wall. Your analytics script doesn't run inside it, so the booking never fires as an event on your page by itself. The widgets do announce what happens inside them - Calendly, for instance, documents embed events that the parent page can listen for and forward into analytics as a meeting-booked event. Without that listener, your funnel's fourth step doesn't exist.
The second seam problem is attribution. UTM parameters on your page do not cross into the iframe, so the scheduler records a booking with no campaign attached unless you pass the parameters into the embed URL yourself. And when a widget redirects through the scheduler's domain and back, the visit can split into two sessions, crediting the booking to the scheduler as a referrer. Test the whole path once with a UTM-tagged visit and check where the credit lands.
The alternative to the parent-page listener is a webhook from the scheduler into your analytics or CRM. Webhooks survive page closes and ad blockers, but check the payload actually carries the campaign fields - default payloads often don't, and a booking without a source can't be attributed later.
Shows, no-shows and the case for speed
Show rate is a calendar fact, not a website fact, so it comes from the scheduler's reporting or the CRM. Worth knowing before you benchmark yourself: there is no disclosed no-show study either. The widely shared no-show tables, sliced by booking window and industry, publish no sample or method, so treat them as sales collateral.
The evidence that does exist is about response speed, and it's old but real. A March 2011 Harvard Business Review audit sent test leads to 2,241 US companies and measured first response: the average was 42 hours, and only 37 percent responded within an hour. It's fifteen years old and often mixed up with a different 2007 lead-response study, but its direction has aged fine. The practical version today is that the fastest response is no response at all - let the form open the calendar directly, so the delay between asking and booking is zero.
Reading the funnel once it's whole
With all six steps instrumented, the losses sort into three families. Losses before the first keystroke mean the ask isn't landing - the page promises too little or the form asks too much at first glance. Losses between submit and booked point at routing lag or a calendar hidden behind an email. Losses between booked and held are a scheduling problem, and the lever you control from the website side is how soon the meeting lands.
Segment the whole chain by traffic source before drawing conclusions. Demo requests from a comparison page and demo requests from a cold-traffic campaign can book at similar rates and show up at completely different ones, and a single blended number hides exactly the split a sales team needs.
Tracking it in Bigdelta
In Bigdelta, the demo chain is one funnel: URL steps for the page view, event steps for form start, submit, disqualified and booked, with conversion and drop-off computed between every pair and the slowest step visible through time-between-steps. Segments split the same funnel by device, country or traffic source, and the session replays behind any step show what a drop-off actually looked like - a form error, a widget that never loaded.
The part sales teams end up using most is the profile behind the request. A visitor's history is anonymous until they identify themselves, and submitting a demo form is exactly that moment - the pre-request visits attach to the profile, so before the call anyone can see which pages, pricing views and comparisons led here, without asking the prospect to repeat it.
The takeaway
Instrument six steps, not three: page view, form start, submit, booked, held, opportunity. Bridge the scheduler with an embed-event listener or a webhook, pass your UTMs across the iframe yourself, and put the calendar directly after the form. Benchmark the form legs against disclosed form data, the booking leg against the one disclosed scheduling study, and ignore any demo average that arrives without a method attached.