Funnel analysis: how to find and fix where visitors drop off
The method for measuring a multi-step journey: defining the steps, reading the drop-offs, segmenting before concluding, and deciding which leak to fix first.
What is funnel analysis?
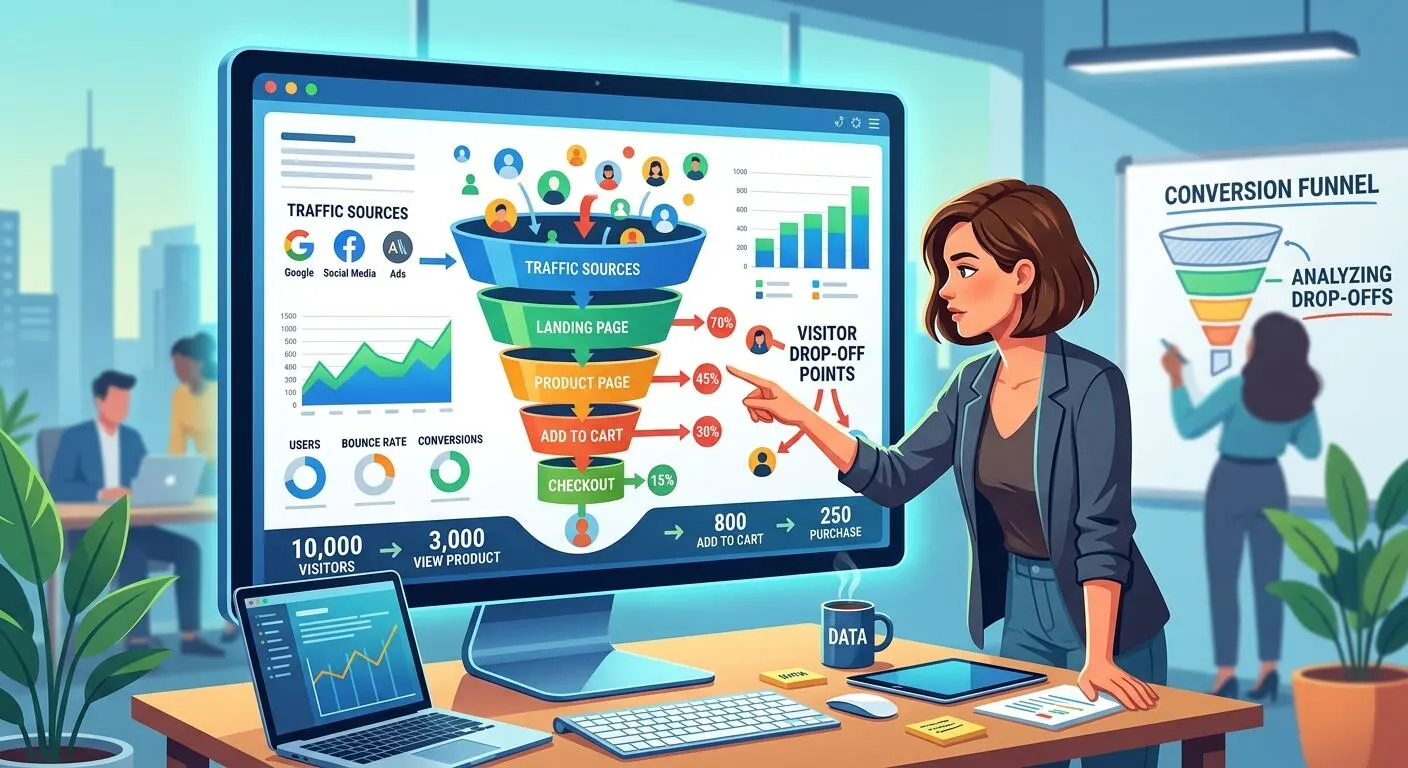
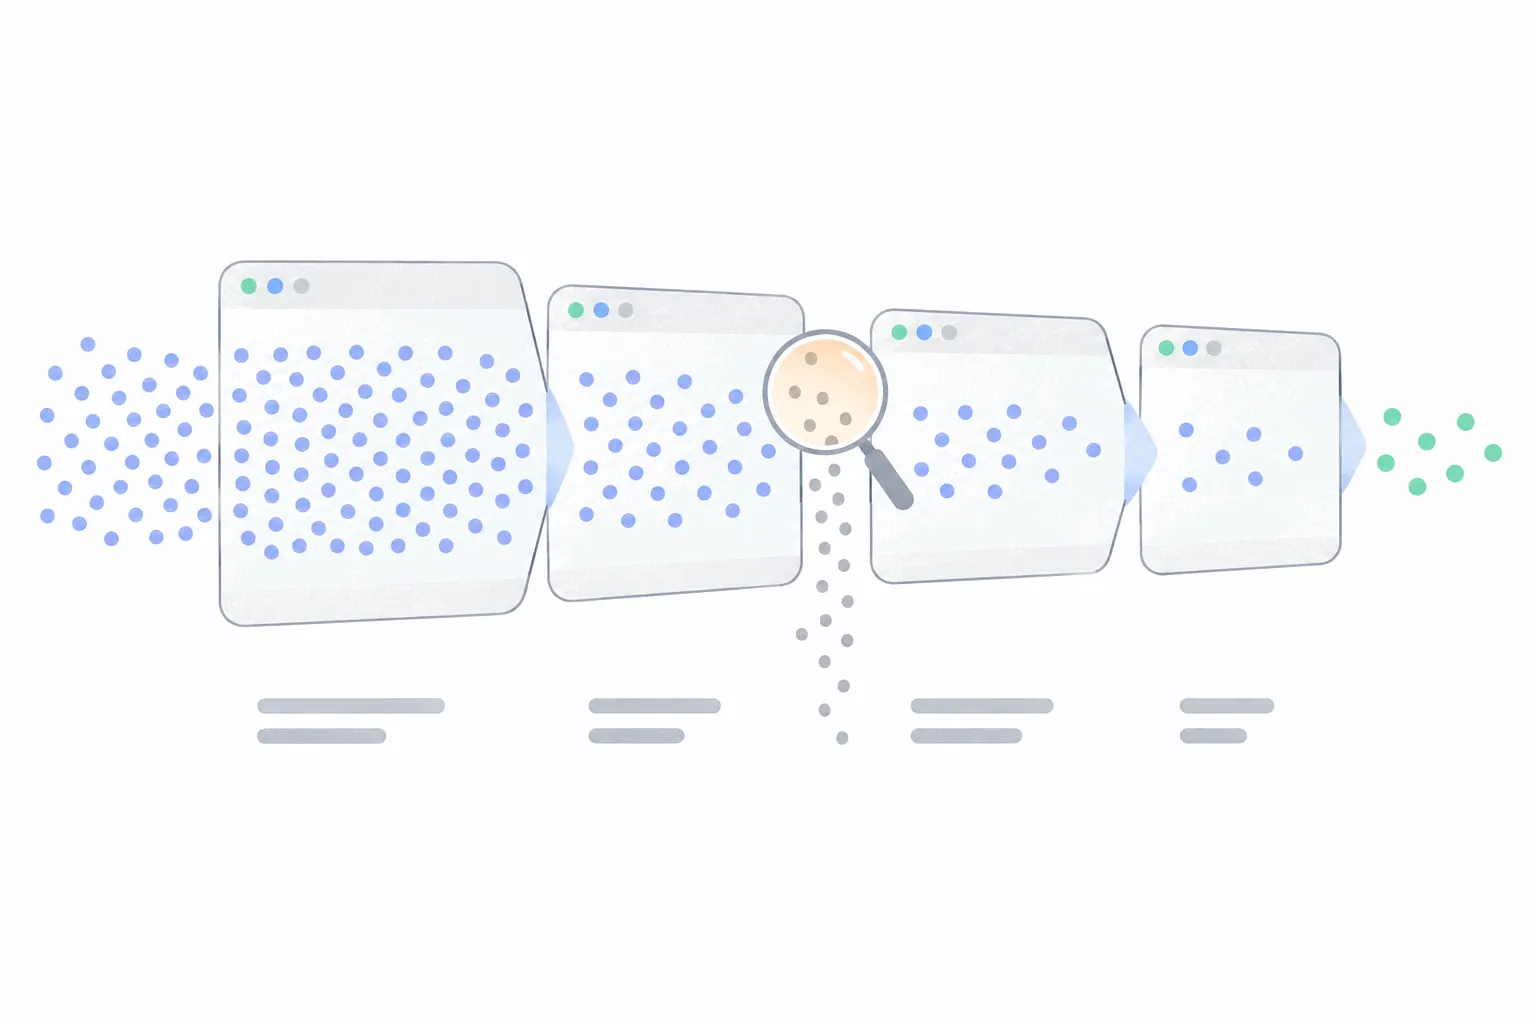
Funnel analysis is measuring a multi-step journey on your site to see how many people make it through each step, and where the rest leave. Suppose 1,000 people view a product page in a month. Of those, 300 add the product to the cart, 120 begin checkout and 90 pay. Funnel analysis is the work of turning those four counts into a decision about what to fix.
The funnel itself, the ordered list of steps, is the easy half, and what a conversion funnel is covers it. This post is about the analysis: the reading, the segmenting and the traps.
The end-to-end number in the example is 9 percent of product viewers buying. On its own that is just a conversion rate. The step-by-step version is what adds information, because each gap between steps is a specific place on the site, with a specific page and a specific reason people leave it.
How to define the steps
Each step must be something your analytics records: a page URL loading, or an event like a click or a form submit. One event per step, and the steps in the order a converting visitor passes them. Tools count a visitor as converted only when the steps happen in sequence, so an unordered list produces a funnel that undercounts everyone who did things their own way rather than yours.
Granularity is a trade-off. "Begin checkout" as one step tells you the checkout leaks. Five steps, one per checkout field group, tell you which screen leaks, at the price of five small numbers instead of one readable one. Start coarse. Split a step into finer steps only after the coarse funnel has pointed at it, and remember most tools cap a funnel around eight or ten steps anyway. Google Analytics allows ten.
Open or closed funnel?
Most tools ask one more question before drawing the chart: whether visitors must enter at step one. In Google Analytics terms, a closed funnel counts only people who started at the first step, while an open funnel lets them enter at any step. The choice changes the numbers, so it is worth making deliberately rather than accepting the default.
Use a closed funnel when the question is about one path, such as what happens to visitors who land on this campaign page. Use an open funnel when the steps have many entrances, such as a checkout people reach from a hundred product pages. If a step in an open funnel shows more people than the step before it, that is not a broken chart. It means people are joining mid-journey, and the step-to-step rates still read the same way.
How to read the numbers
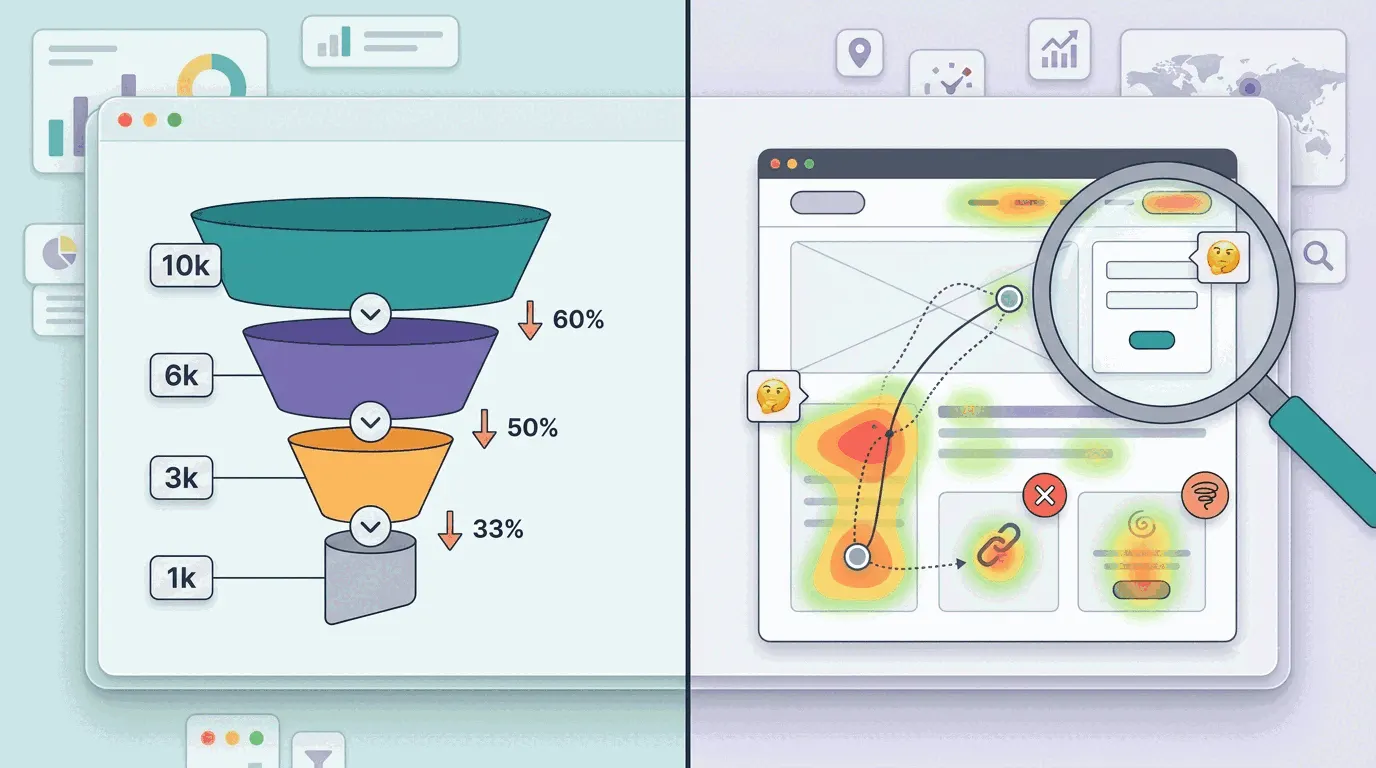
Take the example funnel again: 1,000 views, 300 carts, 120 checkouts, 90 purchases. Convert each pair into a per-step rate. Views to cart is 30 percent, cart to checkout is 40 percent, checkout to purchase is 75 percent.
Two different "biggest" drops hide in those numbers. The biggest absolute loss is at the top, where 700 of the 1,000 viewers left, and it is usually the least fixable, because most people who view a page were browsing. The biggest percentage failure among people who had shown intent is cart to checkout, where 6 in 10 of the shoppers who added an item never started paying. Intent is what makes a drop worth chasing: someone who added to cart wanted the product, so losing them is a leak rather than sorting.
The arithmetic backs that up. Lifting checkout completion from 75 to 80 percent adds 6 purchases a month in this funnel. Lifting cart-to-checkout from 40 to 50 percent adds about 22, because the improvement happens where more intent is piled up. Run this calculation on your own funnel before choosing what to work on. The step worth fixing is the one where a plausible improvement adds the most completions at the bottom.
Where funnels usually leak
On stores, the classic leak is the stretch between cart and payment. Baymard Institute's running average across 50 studies, updated in September 2025, puts documented cart abandonment at just over 70 percent. In its 2025 survey of US online shoppers, the top reason after "just browsing" was extra costs appearing at checkout, named by 40 percent. Reducing checkout abandonment covers the fixes step by step.
On lead-gen and SaaS sites, the equivalent leak is the form. A form step that loses half the people who start typing is common and diagnosable, and form abandonment covers how to measure inside that single step, field by field.
Segment before you conclude
An aggregate funnel is often two different funnels averaged together. A 40 percent cart-to-checkout rate can be desktop converting at 55 and mobile at 25, which is a mobile checkout problem, or paid traffic converting at 15 while search converts at 60, which is an ad targeting problem. The average alone points at neither. New versus returning splits earn their place on subscription and repeat-purchase sites, where a returning customer converting at triple the rate of a first-timer is normal, and a funnel that mixes the two mostly measures the mix.
So once a step looks bad, cut the funnel by device, by traffic source and by new versus returning visitors before deciding anything. The pattern to look for is one segment far below the others on one step. That combination, this audience on this step, is a far more specific brief than "checkout is leaking". Google Analytics does this with segments and a breakdown dimension in its funnel exploration, and most funnel tools have an equivalent.
Conversion windows and cohorts
Every funnel tool has a time rule, even when it is hidden in a default. A conversion window is how long a visitor has to finish all the steps and still count as converted. Some tools default to a single day, which quietly writes off buyers who add to cart on Tuesday and pay on Saturday. Check the setting and match it to how your customers actually behave. A cheap impulse product suits a short window and a considered purchase needs a week or more.
Time also matters in the other direction. Compare this month's funnel with last month's rather than staring at one period, since a step rate means little until you know what it usually is. When a release or price change ships, the comparison of the cohort before it with the cohort after it is the whole verdict. Some tools also show the average time between steps, and that lag is a finding in its own right, because a step people complete eventually but slowly often has the same cause as a step people abandon.
How much traffic do you need?
Enough that the step percentages stop wobbling. There is no universal threshold, and the arithmetic on your own numbers is a better guide than any rule of thumb. If 40 people reach checkout in a month and 30 buy, one extra buyer moves the step rate by 2.5 points, so a swing from 70 to 78 percent between two months is indistinguishable from luck. If 4,000 reach checkout, the same swing is a real change worth investigating.
On low traffic, the honest adjustments are longer periods and fewer steps. A quarter of data on a three-step funnel is readable where a week of a seven-step funnel is noise. And treat the bottom of the funnel most sceptically of all, because that is where the counts are smallest.
Finding out why people left
A funnel report locates the leak without explaining it. The checkout step that loses 6 in 10 shoppers looks identical whether the cause is a surprise shipping cost, a broken address field on phones, or a forced account signup. The percentages have done their job once they have named the step and the segment.
The explanation comes from watching. Session replays of visits that reached the leaking step and left show the actual behaviour, and a heatmap of that page shows where the audience as a whole clicked and stalled. Some tools connect the two directly. Bigdelta, for example, lets you watch the sessions that dropped out at any funnel step. The routine for going from a bad number to a watched session is covered in how to see where users get stuck.
Funnel analysis mistakes
Most bad funnel decisions come from a short list of habits.
- Too many steps. Each extra step shrinks the counts and multiplies the places to stare at. Start with three or four.
- Steps a converting visitor can skip. If some buyers never see the cart page because of a buy-now button, the funnel undercounts them. Every step must be unavoidable on the way to the end.
- Reading the aggregate. Check device and traffic source splits before concluding anything about a step.
- Reading one thin week. Small counts produce dramatic percentages. Widen the period until the numbers hold still.
- Fixing a step and declaring victory. A step rate can improve while end-to-end conversions stay flat, because the people saved at one step leave at the next. The bottom of the funnel is the number the fix has to move.
The weekly routine
Build one funnel for the one journey your site exists to produce: product view to purchase, landing to signup, service page to submitted form. Three or four steps from events you already track. Check it weekly and after every release, against the previous period.
Leave it alone while it holds steady, because a stable funnel is a baseline, and baselines are what make a real change visible. When a step moves, segment it, then watch a handful of sessions from the segment that fell, and only then change the page. That loop, from step to segment to session to fix, is the whole method.