What is a good visitor-to-signup rate for a SaaS website?
Of a hundred SaaS website visitors, three to nine sign up, and the gate decides which end you're on. The disclosed benchmarks by signup motion, the denominator traps behind the miraculous numbers, and the rate worth computing for your own site.

The disclosed figures, by motion
The gate decides the rate. Every disclosed source agrees on the ordering: the less you ask for, the more sign up.
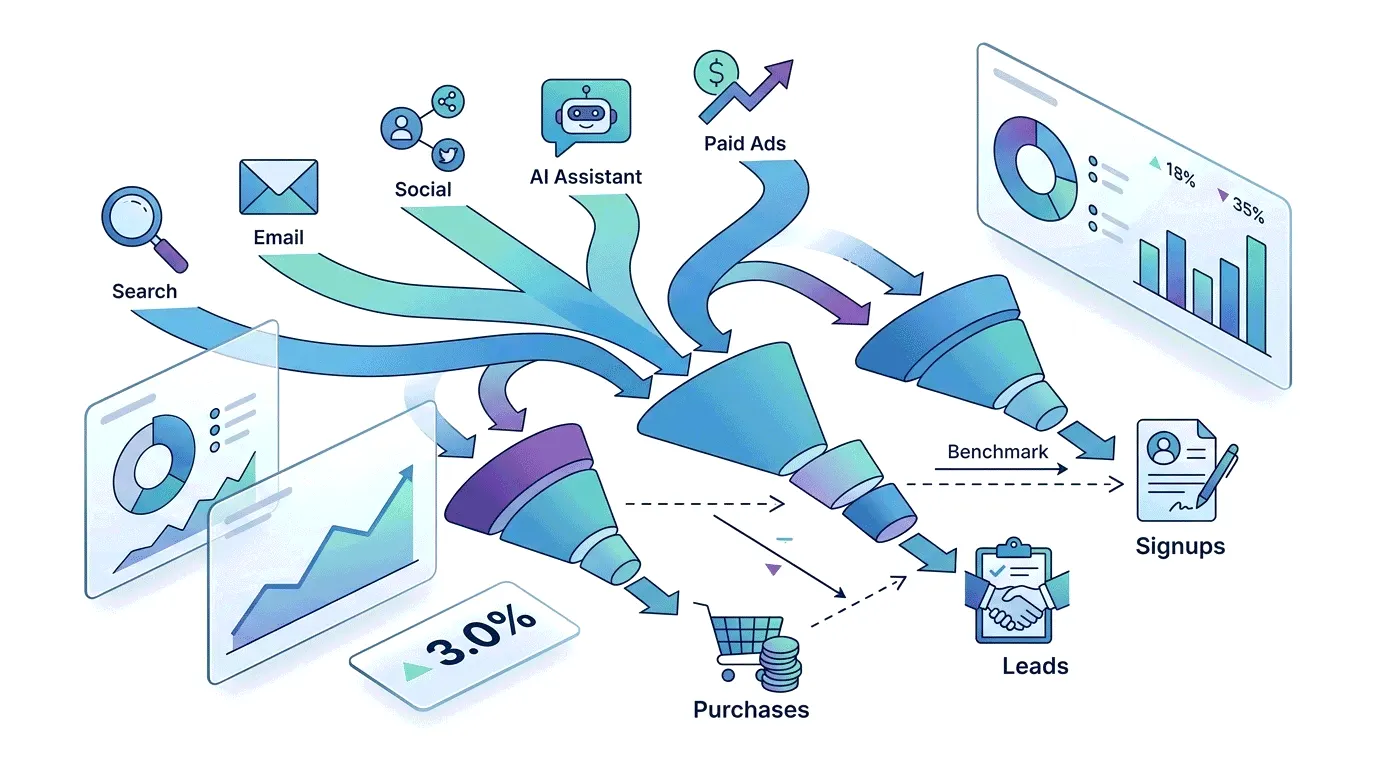
The most current cross-company data is ChartMogul's SaaS conversion report (February 2026, a survey of 200 B2B SaaS products): out of 1,000 website visitors, freemium products convert about 9 percent to accounts, 7 percent if the product is partly ungated, free trials convert about 4.5 percent, and trials requiring a card up front about 3.5 percent. Survey-reported rather than measured, with the sample disclosed, and the motion ordering is the durable finding.
One agency dataset runs higher and is worth including because its numbers circulate widely: FirstPageSage reports visitor-to-trial at 7 to 8.5 percent for opt-in trials (86 companies, 2022 to 2025, organic traffic converting above paid) falling to 2.2 to 2.5 percent when a card is required, and freemium signup around 13 percent across 80-plus clients. The sample is one SEO agency's organic-heavy client base, which is exactly the traffic that converts best, so read these as the high end, not the middle.
For the landing-page-only version of the question, Unbounce's conversion benchmark report (medians from 41,000 pages and 464 million visitors) puts SaaS landing pages at a 3.8 percent median conversion against 6.6 percent across all industries, with enormous spread by channel, email traffic converting many times better than display. The denominator there is visitors to a dedicated landing page, not to your whole site, which brings us to the traps.
And one gap, stated plainly: for sales-led sites, visitor-to-demo-request, no source with a disclosed methodology publishes a benchmark. The sub-one-percent figures quoted around the web are uncited agency claims, and this post will not launder them into facts.
The denominator traps
Most disagreements about signup rates are disagreements about the denominator wearing a costume.
Site-wide traffic dilutes the rate mechanically. A SaaS company with a busy blog divides its signups by an audience that mostly came to read, so an identical product shows half the signup rate after its content strategy succeeds. The blog is not failing; the denominator grew. Any site-wide rate needs content traffic segmented out before it says anything about the product pages.
Flow completion is not visitor conversion. Figures in the thirty-percent range, like a well-known analytics vendor's 36 percent signup benchmark, measure people who started the signup form and finished it, a different fraction with a hundredfold smaller denominator. When a quoted rate seems miraculous, the denominator is usually the trick.
Visitors, sessions and people also differ: a rate per unique visitor runs higher than per session, and neither is wrong, they are just not comparable. How conversions get tracked covers the mechanics.
What to do with your own number
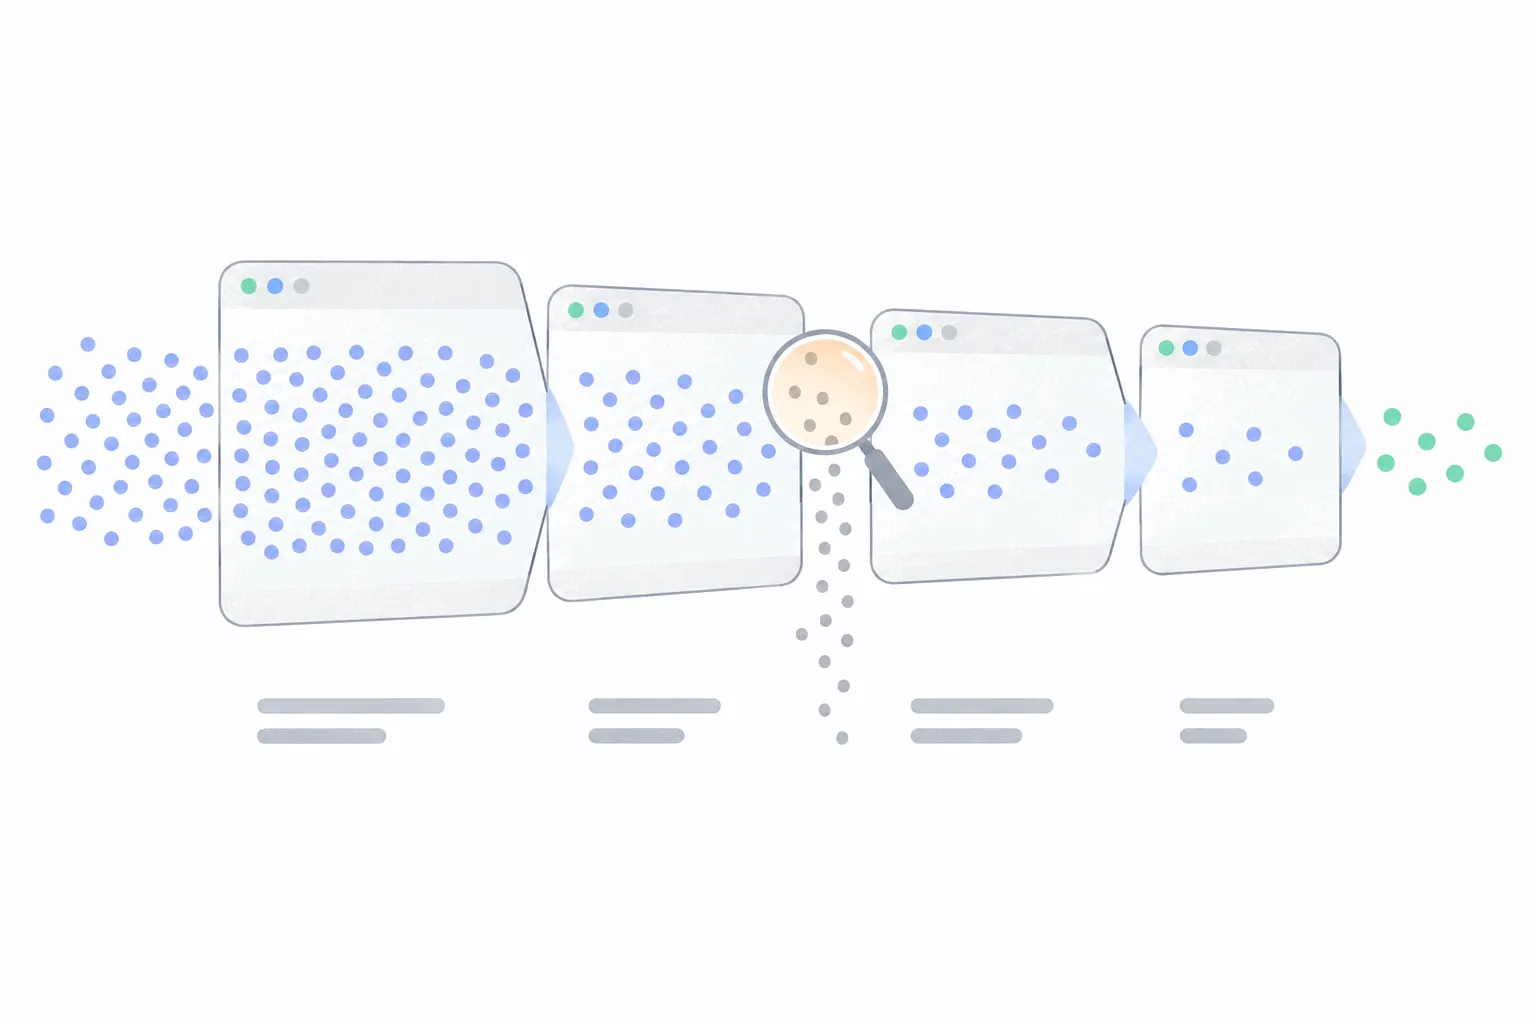
Compute the rate that matches a decision. For product page changes, that is signups divided by unique visitors to product pages, blog excluded, split by channel, because paid social and organic search arrive with different intent and average them into mush. For the whole growth machine, the site-wide rate is fine as a trend line against your own history, which beats every table here. Funnel analysis is the tool for finding where the missing signups actually leak, and the step where signups become activated users and then revenue is its own discipline with its own benchmarks. Whatever you measure, keep the motion in the label: a 4 percent card-required trial rate is strong, the same number for an open freemium is weak, and a benchmark without its motion attached is just a number.