Form conversion rate benchmarks
Published form conversion rates run from 2% to 45%, and most of the spread is arithmetic: different studies divide by different people. The disclosed numbers sorted by denominator, and the circulating stats that fail the provenance check.
Check the denominator before the number
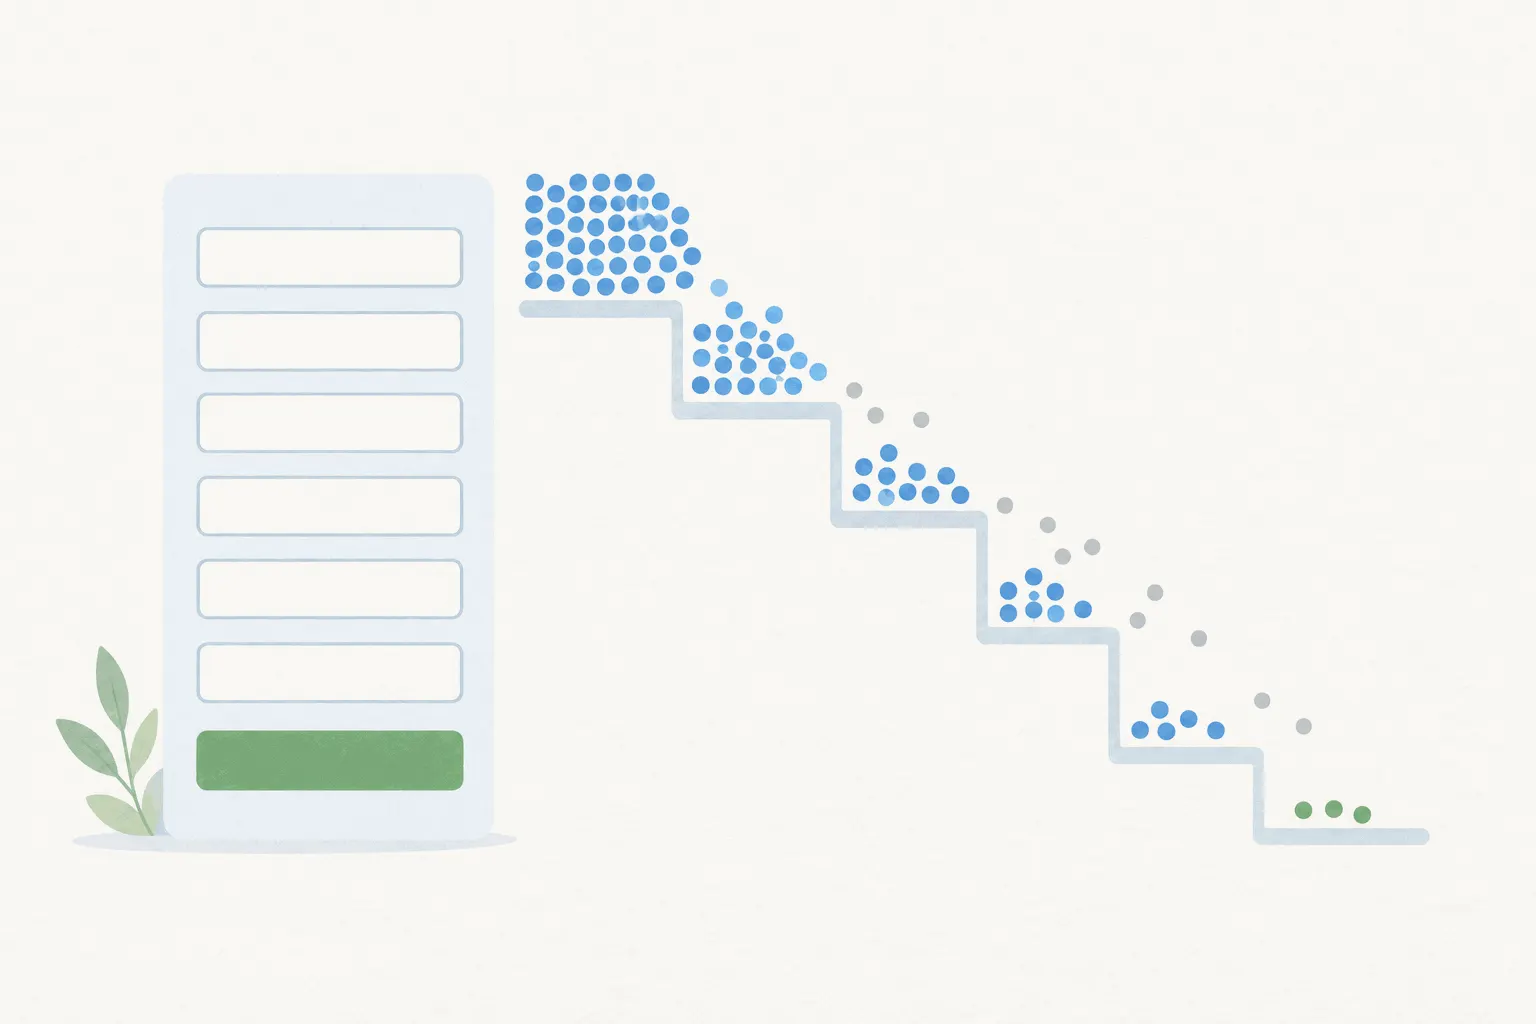
Every form benchmark answers one of three questions, and mixing them is how most published comparisons go wrong. Of the people who saw the form, how many submitted it? That's a completion rate, and the disclosed averages sit around 45 percent. Of the people who began filling it in, how many finished? That's a starter-to-completion rate, and it runs higher, around two thirds. Of everyone who visited the page or site, how many ended up submitting? That's a visitor conversion rate, and it lives down in the single digits.
All three are useful. A weak view-to-start rate means the form's ask isn't worth it at first glance. A weak start-to-finish rate means the form itself is losing people, which is form abandonment's territory. A weak visitor rate with healthy form rates means the page, not the form. The only wrong move is comparing your number against a benchmark computed on a different base, so every figure below comes labeled.
The best-documented benchmark: Zuko's form data
The largest disclosed form study comes from Zuko, a form-analytics vendor that publishes benchmarks from about 93 million form sessions over a rolling year, with its definitions and filtering stated - forms with under a thousand views or no completions get excluded. On the view-to-completion basis, the cross-industry figure is about 45 percent: of the people who lay eyes on a form, a little under half submit it.
On the starter basis the same data says 66 percent: once someone begins interacting with a form, about two thirds finish it. The gap between those two readings is the quiet finding - roughly a third of the people who see a form never touch it at all, so the fight is disproportionately won or lost before the first keystroke.
Two splits from the same panel are worth carrying around. Desktop forms complete at about 47 percent of views against 42 on mobile, a real but smaller gap than mobile's reputation suggests. And industry matters enormously: Zuko's by-industry completion rates run from the mid-30s for property forms to the high 60s for forex trading, so a cross-industry average deserves loose treatment.
Landing page forms: the Unbounce data
For the specific case of a landing page built around one form, the disclosed source is Unbounce's conversion benchmark data, most recently covering 464 million visitors across 41,000 pages from mid-2023 to mid-2024. On the visitors-to-the-page basis, the median landing page converts 6.6 percent, with the top quarter of pages clearing 11 percent and industry medians spreading from around 4 percent for SaaS to over 12 for events.
The same dataset carries the cleanest field-count evidence in circulation, measured rather than asserted: single-field forms convert about 13 percent of page visitors, three fields about 10, five fields about 8, seven about 5, and nine-plus fields about 4. The curve slopes exactly the way intuition says, and having it measured on a disclosed sample is what makes it quotable where the older field-count folklore, covered below, is not.
The whole-site basis, for completeness
The third denominator counts against all site visitors, and the widely cited figure there comes from Ruler Analytics, which reports an average lead conversion rate of about 5 percent across 13 industries from a panel it describes as over 100 million sessions. The sample is stated but the filtering and industry construction are thinner than Zuko's or Unbounce's disclosure, so treat it as a sanity check rather than a target: if a few visitors in a hundred become leads, your site is in documented company.
The numbers that fail the trace
Several form statistics circulate too widely to ignore and too poorly to cite, and naming them is part of the job. The "average form conversion rate of 2.35%" is landing-page data from the mid-2010s that lost its context in retelling - it described page conversion, not form completion, and mutates between 2.35, 2.5 and 3 depending on who's repeating it. The flat "10% average" that appears in form-builder blogs traces to nothing at all that archive digging can find.
The multi-step claims deserve their own paragraph. "Multi-step forms convert 86% better" is attributed to a major marketing vendor in dozens of posts, but no study from that vendor with that figure and a method exists to be found - it appears to be a secondhand summary that hardened into a citation. And the venerable rule that forms convert best at exactly three fields comes from a 2011 analysis that never published its underlying table or denominator. The modern, disclosed field-count curve above says what that rule was reaching for, without the folklore.
What the multi-step evidence actually supports
Strip the zombie stats away and multi-step forms still have real evidence behind them, just narrower than the headlines. The documented cases are controlled A/B tests from conversion agency Venture Harbour, the sharpest being a consulting inquiry form that went from about 1 percent to about 8 percent of form viewers completing when rebuilt as multi-step, with fields and offer unchanged. Other published tests in the set show gains from 35 to a few hundred percent.
The honest reading: these are selected success stories rather than a benchmark panel, and the gains concentrate in long forms, where breaking ten questions into steps changes how the ask feels. A three-field form has little to gain from pagination. If your form is long and its starter-to-completion rate sits well below the 66 percent mark, a multi-step rebuild is the experiment the evidence most supports - measured on the same steps you'd track for any signup flow.
Benchmarking your own form
Pick the comparison that matches your form's job. A contact or lead form measured from form view to submission belongs against Zuko's 45 percent, and its start-to-finish leg against the 66. A dedicated landing page belongs against Unbounce's 6.6 percent median for its industry. A signup flow spanning several screens is a funnel, not a form, and gets read step by step.
Then instrument the three moments the benchmarks distinguish: form viewed, form started, form submitted. In Bigdelta, those three events make a funnel with the drop-off computed between each pair, and the session replays behind any step show what the abandonment actually looked like - the mobile keyboard covering the submit button explains a weak mobile number faster than any table. Whatever the tool, measure a full month before comparing, because small samples produce dramatic nonsense here as everywhere.
The practical takeaway
The disclosed picture: forms complete for a bit under half the people who see them and about two thirds of the people who start them, landing page forms convert a mid-single-digit share of their visitors, and each extra field costs measurably. Match your form to the benchmark with the same denominator, distrust any round number that arrives without a method attached, and let your own view-start-submit funnel, not a cross-industry average, tell you which fix to try first.