Website engagement benchmarks: bounce, time, pages and engagement rate
One page for the whole engagement picture: session duration, pages per session, engagement rate and bounce, every figure with its source and sample attached, and the metric combinations that diagnose what no single number shows.

The numbers, with their sources
Session duration. On enterprise-skewed tag data, Contentsquare's 2026 benchmark (99 billion sessions) measures 4:46 on desktop against 2:20 on mobile. On SMB-leaning Google Analytics medians, Databox reports 78 seconds for B2B and 92 for B2C, and AgencyAnalytics reports 2:19 across 150,000 agency-managed campaigns. The gap between those sources is definitions and samples, not error, and the duration deep-dive unpacks it.
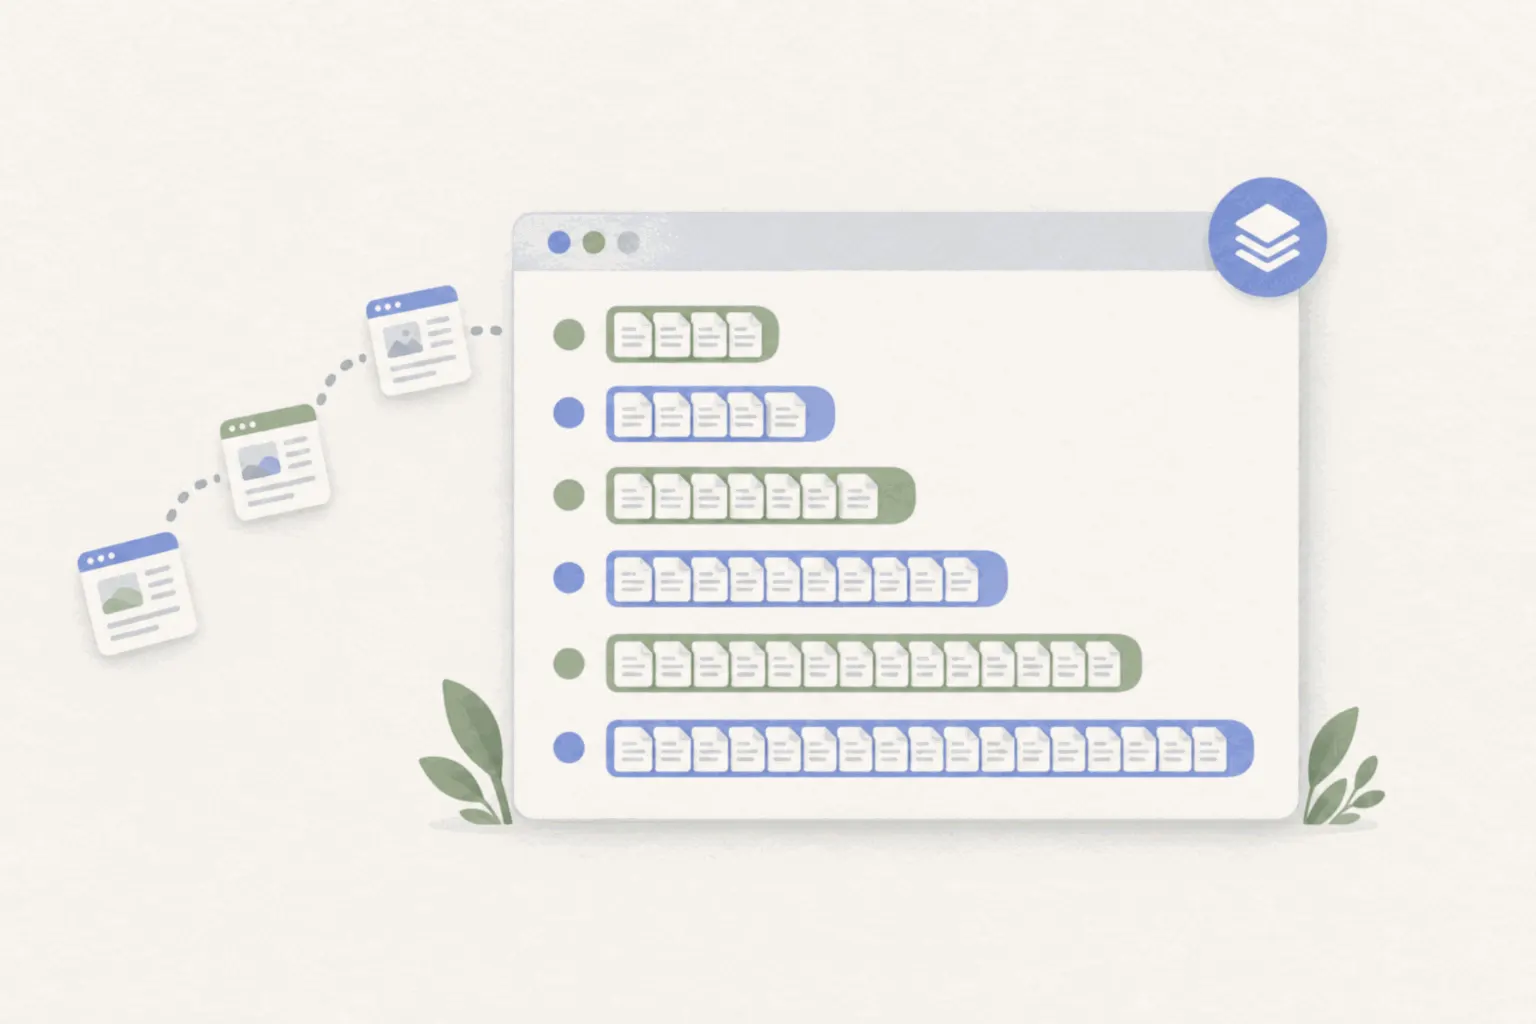
Pages per session. Littledata's ecommerce dataset (2,800 stores) averages 2.6, and Databox's medians run 1.9 for B2B and about 2.1 for B2C. The circulating 14-industry table with far higher numbers has no disclosed methodology, a story the pages-per-session post tells in full.
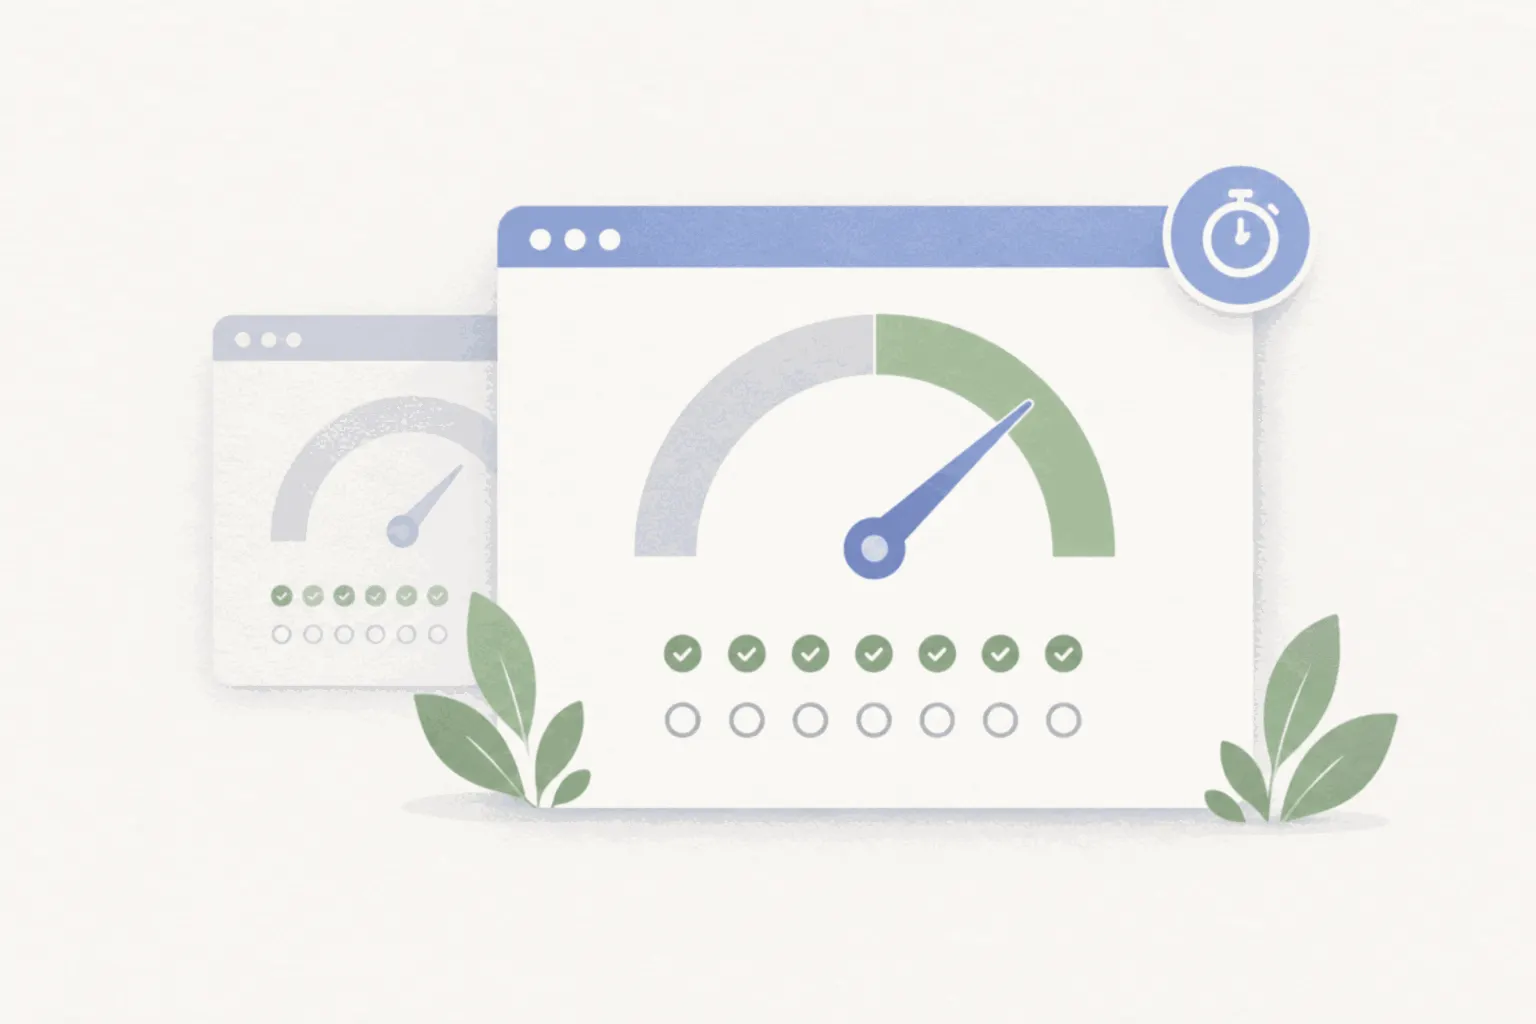
Engagement rate. Three disclosed sources converge in the mid-50s: Databox's GA4 medians around 56 percent, AgencyAnalytics at 54, a smaller Orbit Media sample at 55. It is also the most riggable of the four numbers, an adjustable timer and key-event choices move it without any visitor changing behaviour, which is why the engagement-rate post spends half its length on configuration.
Bounce rate. AgencyAnalytics' median across its campaign base is 45.9 percent, Databox's GA4 medians sit in the mid-40s, and Siege Media's client dataset (1.3 billion sessions, 42 sites) runs 50.9 percent overall with blogs at 82.4, a useful reminder that content pages bounce high by design. One caution when reading bounce sources: GA4's bounce is simply the inverse of engagement rate, while some analytics vendors count any single-page visit as a bounce regardless of engagement, so figures from different tools are not the same metric. The bounce-rate post covers what a good number looks like per site type.
Notice what the table just did: every "average" landed near the middle of its scale, durations a couple of minutes, two-ish pages, engagement around half. Middling numbers on middling samples. The value was never in the averages; it is in what your deviations from them mean.
Reading the four together
High bounce with high duration is not a contradiction, it is a blog. Visitors arrive from search, read one page thoroughly, and leave satisfied. On content sites this pairing is success, and treating the bounce half as a problem leads to fixing what works, a pattern Nielsen Norman Group's research on return visits supports: informational visits are often complete in one page.
Low bounce with low pages per session usually means configuration, not behaviour. In GA4, a session becomes engaged, and therefore not a bounce, the moment any key event fires, so a site that marks cheap events as key can show a flattering bounce number while visitors see barely more than a page. When two metrics disagree about the same visits, audit the event setup before praising the traffic.
Rising pages with falling duration is skimming or confusion, more pages seen, less time given to each, and it often follows a navigation change that made finding things harder. The reverse, fewer pages but longer time, after a redesign can mean the opposite: people find what they need in fewer steps.
And remember the four are not four independent witnesses. Engagement rate and GA4 bounce are one number stated twice, and duration feeds the engagement definition through its ten-second rule, so a dashboard showing all four moving together is often showing one underlying change wearing four costumes.
The comparison that beats this table
Everything on this page shares the benchmark family's caveat: the samples are not your site, the definitions vary, and your traffic mix moves every number. The comparison that avoids all three problems is GA4's built-in peer benchmarking, which covers these engagement metrics against your actual peer group's median and quartiles, on your own definitions. Use this page for orientation and the combinations, use peers and your own trends for decisions.