Average session duration benchmarks: what the disclosed data says
Most session duration tables online descend from one agency's 2022 client data with no metric attached. Here is what the sources that disclose their methodology actually report, why they disagree by minutes, and the benchmark worth using instead.

The benchmarks with a described methodology
Three publishers currently put out session duration figures alongside a real description of how they got them. They measured different metrics on different kinds of sites, so each stands alone. Resist averaging them.
Large consumer and enterprise sites. Contentsquare's 2026 Digital Experience Benchmark draws on 99 billion sessions across more than 6,500 sites, comparing Q4 2025 against a year earlier, measured by its own tag with a session ending after 30 idle minutes. On that dataset, a session runs 4:46 on desktop against 2:20 on mobile, and time on site fell 7 percent year over year. Of its nine industry groups, the freely published figures are services at 5:40 and financial services at 2:47. The sample skews toward big brands, which is worth remembering before comparing a small site against it.
Small and mid-sized businesses. Databox's benchmark groups aggregate Google Analytics data from companies that connect their accounts, reported as medians. The B2B median is around 78 seconds across roughly 500 companies, and the B2C median around 92 seconds across roughly 800. These are the most sobering numbers on this page: for a typical smaller site, a minute and a half is not failure, it is the middle of the pack.
Agency-managed sites. AgencyAnalytics reports a median GA4 average session duration of 2:19 across more than 150,000 client campaigns as of December 2024. One number, no industry split, but a large sample with the metric named precisely.
And the table everyone copies: FirstPageSage's 34-industry list, the source of the familiar e-commerce 2:03, B2B SaaS 4:26 and financial services 4:56 figures. To its credit, it states its sample, 170 clients of one SEO agency, about three-quarters B2B. It does not state the tool, the period, or even which duration metric was measured. Treat it as what it is: one agency's client data with the measurement unspecified, and the root of most of the internet's session duration tables.
Why the numbers disagree so badly
Contentsquare's blended figures sit minutes above Databox's medians, and both publishers measured honestly. The gap is mostly definitions, and it is the reason a benchmark without a named metric is unusable.
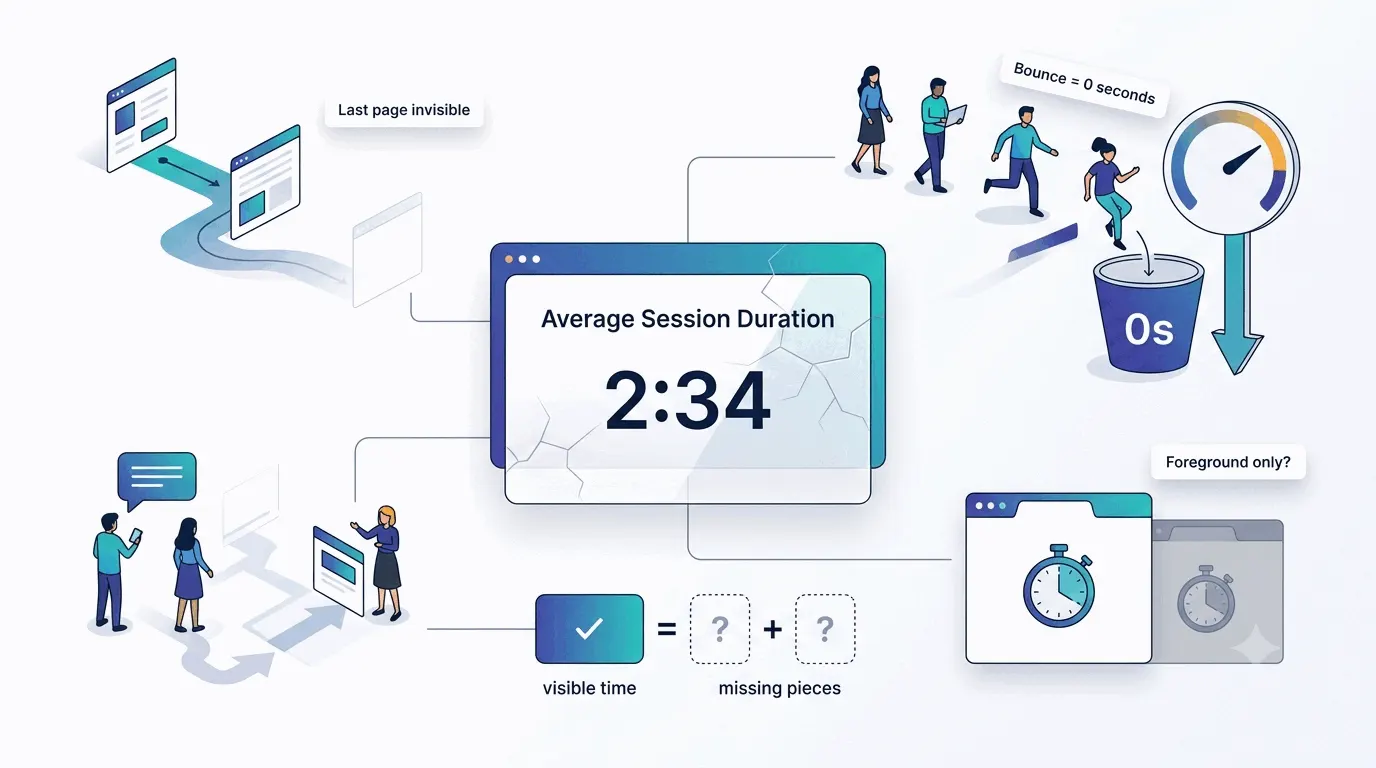
Tools do not share one clock. Universal Analytics counted a session's duration up to its last engagement hit, so the final page of every visit contributed zero seconds and a bounce counted as 0:00. GA4's default metric counts only time with the page actually in focus, which runs far lower, while GA4 simultaneously carries an older-style average session duration metric in its API and Explorations, so even two GA4 numbers can disagree with each other. Contentsquare's tag uses activity-based timing with a 30-minute cutoff, a different clock again. How session duration is computed walks through these mechanics, and what counts as a session covers the boundary rules that differ on top.
The samples differ as much as the clocks. A dataset of enterprise retail brands and a dataset of connected SMB accounts describe different internets. Neither is wrong. A benchmark is only meaningful next to the sample it came from, which is why every figure above arrives wrapped in its source.
The one split with solid data: device
The only cut where a disclosed-methodology source gives a clean comparison is desktop against mobile, and the gap is large: 4:46 against 2:20 in Contentsquare's 2026 data, with desktop taking 30 percent of visits but 47 percent of total time on site.
The practical consequence: if your traffic is 80 percent mobile, your blended average will sit well below a benchmark drawn from desktop-heavy sites, with nothing wrong on your end. Compare desktop against desktop and mobile against mobile, or not at all.
Why your number still will not match
Even against the right table, measured on the same metric, your average carries local distortions the benchmark cannot share. Traffic mix is the big one: paid social visitors bounce fast and drag the average down, while returning readers pull it up, so two identical sites with different traffic sources post different durations. Site type matters as much, a utility page that answers in twenty seconds is succeeding, not failing. And the single-page visits that count as zero in older metrics can swamp everything else if your content earns one-page reads.
Which is the quiet conclusion of the disclosed data: the published benchmarks are most useful as a reality check on expectations, not as a target. If the SMB medians live around 80 to 90 seconds, a two-minute average on a small site is already strong, whatever a 34-industry table says.
What to do instead of chasing the average
Google's own answer is better than any public table. GA4 ships a peer benchmarking feature that compares your property against a peer group's median and quartiles, on your metric, from real properties, without a copied table in sight. If a benchmark drives a decision, that is the one to use.
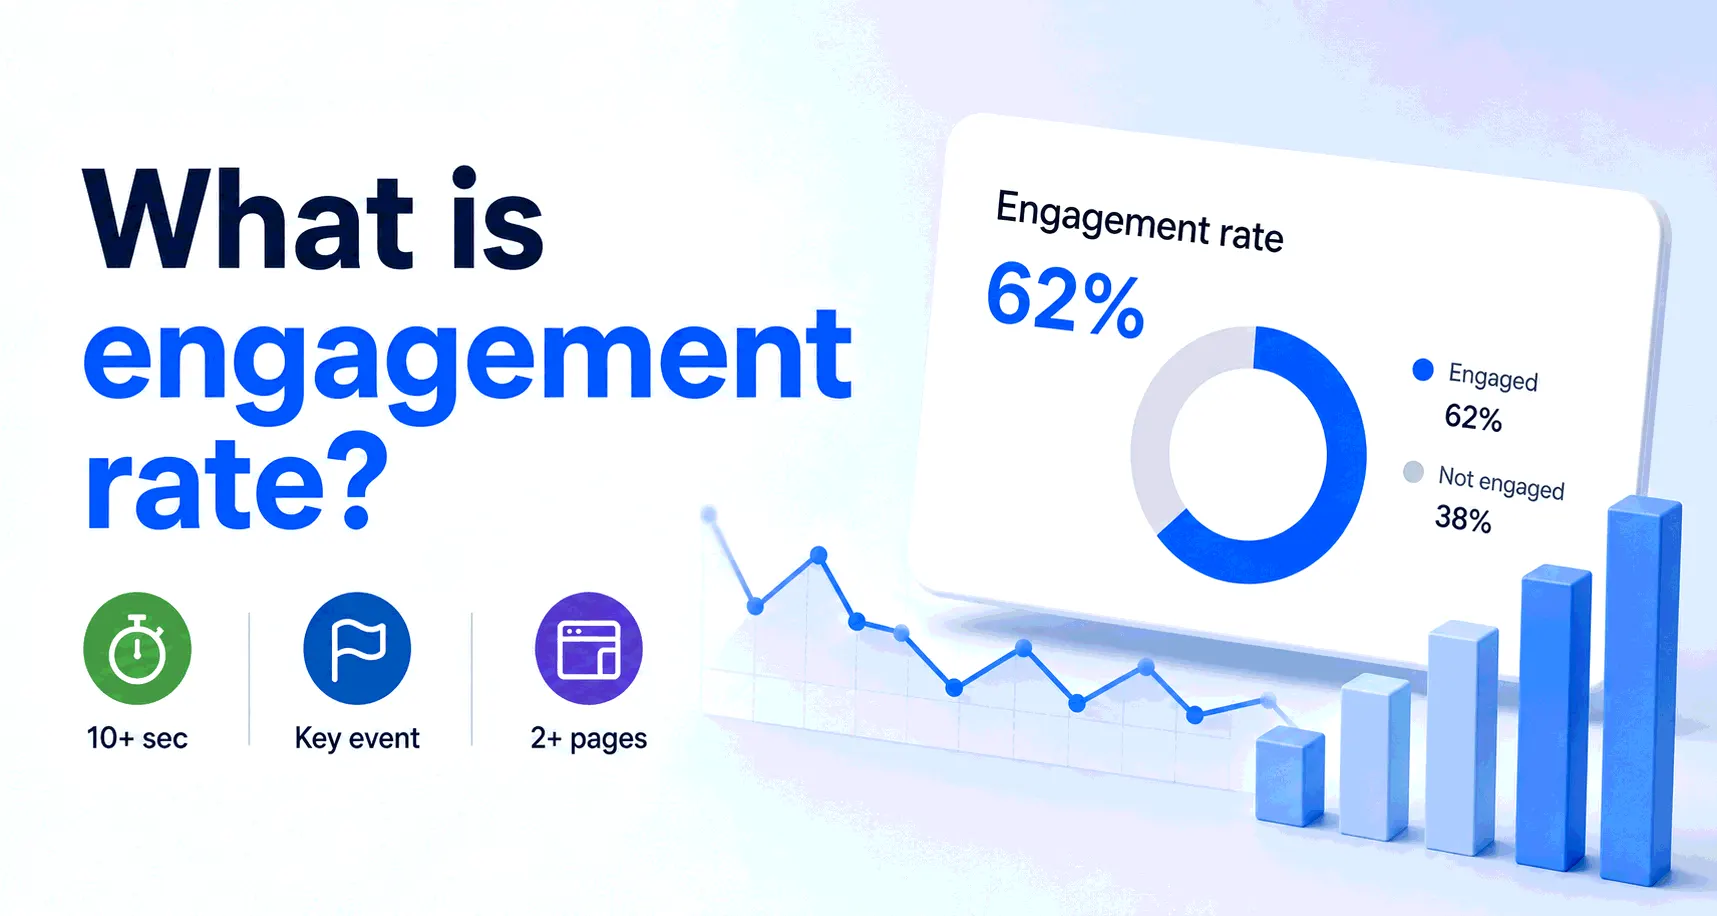
Beyond that, your own history beats everyone else's present. Trend session duration against last quarter, split by device and source, and treat movement as the signal rather than the level. Pair it with engagement rate, which was built to absorb several of the older metric's distortions. And when a number does move, look at what the sessions contain before celebrating or panicking: long sessions are sometimes depth and sometimes a visitor lost in navigation, and duration alone cannot tell those apart.