What is engagement rate? GA4's replacement for bounce rate
GA4 retired bounce rate from the default reports and put engagement rate in its place. What clears the bar, why there's no trustworthy industry average, and the two ways the number quietly lies.
The definition, in one breath
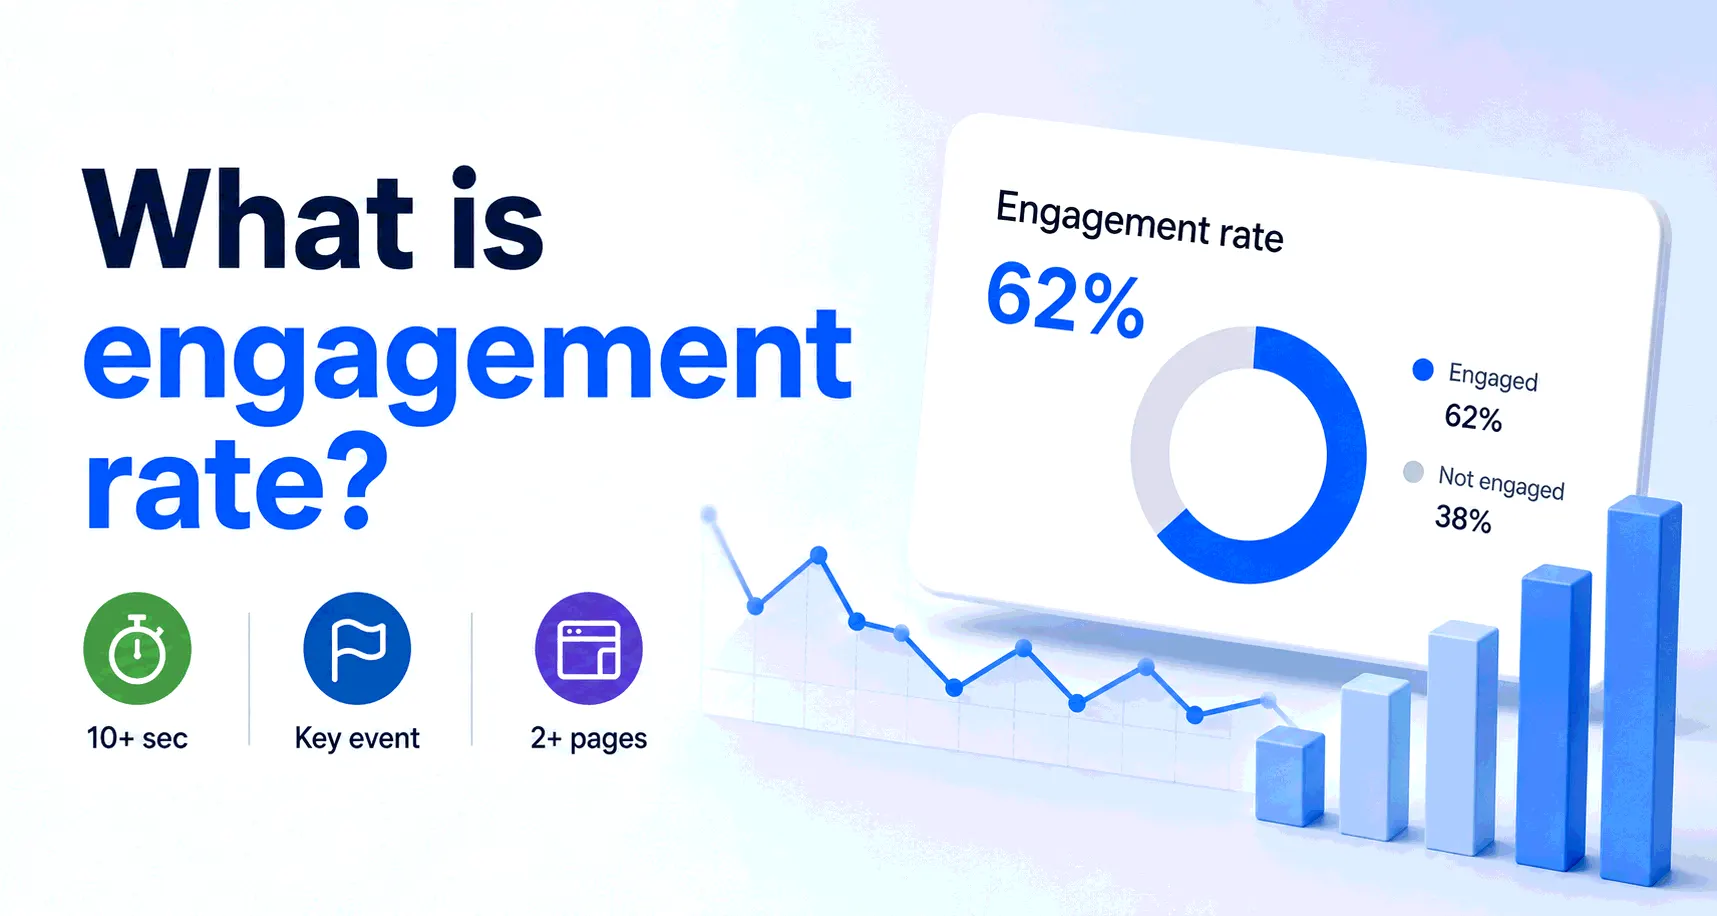
1,000 sessions this month, 620 of which lasted 10+ seconds, fired a key event, or viewed a second page: 620 ÷ 1,000 = 62% engagement rate — and a 38% bounce rate.
An engaged session in GA4 is one that lasted longer than ten seconds, or recorded a key event (GA4's current name for a conversion), or viewed at least two pages. Engagement rate is the share of sessions that cleared at least one of those bars. Bounce rate still exists, but demoted and inverted: it's now simply 100% minus engagement rate, hidden until you add it to a report yourself — a shift with consequences the bounce rate post walks through.
The three criteria have small print worth knowing. The ten seconds are a fixed threshold — a property setting can't raise or lower the bar, so every GA4 property on earth grades sessions the same way. And a handful of automatic events (session_start, first_visit) never count as engagement even if someone marks them as key events, so merely arriving can't clear the bar. Everything deeper about the session machinery — what starts one, what ends one, how engaged sessions interact with session counts — is its own post.
What actually changed from bounce rate
The old bounce asked one question: did the visit see a second page? The engaged/not-engaged split asks three, and the ten-second timer does most of the new work. Someone who lands on an article, reads for two minutes and leaves used to be a bounce — a failure, by the old accounting. Under GA4's rules they're engaged. For content pages that's a real improvement, and it's the main reason a site moving from Universal Analytics saw its 'bounce' number improve without anything changing on the site.
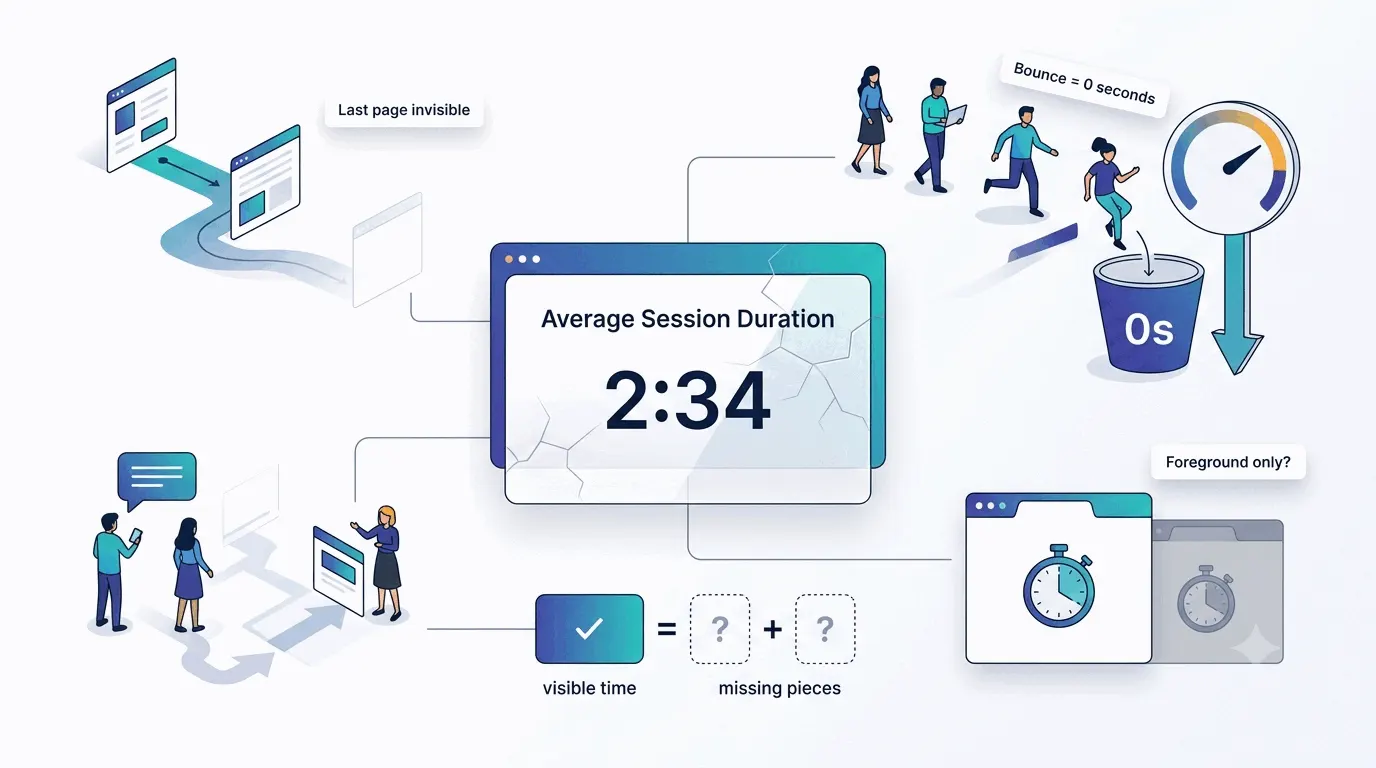
The timer has its own bias, though. GA4 counts time only while the tab is in the foreground, a mechanic the session duration post dissects — so the reader who opens your article in a background tab for later can register zero engaged seconds. The metric is neither stricter nor looser than old bounce rate; it draws the line through different visits, which is why the two aren't comparable across tools or across the GA4 migration boundary.
What's a good engagement rate?
The honest answer: there is no citable industry table. Google doesn't publish engagement-rate averages, and the third-party numbers that fill the vacuum ('SaaS averages 68%!') are vendor estimates from unstated mixes of sites, tools and years — some of them recycled Universal Analytics data wearing GA4's name. The one same-definition comparison that exists is GA4's own benchmarking feature, which shows percentile bands for your industry once enabled, computed from properties that actually share the metric's definition.
Absent a table, read the number the way you'd read its inverse: by the page's job. A store or an app should clear the bar for most sessions — its visits are inherently multi-step, so engagement in the 70s or higher is unremarkable and a low number is a real flag. A blog or newsletter archive can run far lower and be perfectly healthy, since read-one-thing-and-leave is that content doing its job, with only the ten-second timer deciding which of those satisfied readers count. Comparing your engagement rate to your own last quarter, per section and per traffic source, beats comparing it to anyone else's site.
Two ways the number lies
Engagement rate inflates easily, because any key event marks a session engaged. Mark something frequent and passive as a key event — a scroll event, a video autoplay, some housekeeping event a plugin fires — and swaths of ten-second drive-bys get promoted to engaged. This is the first thing to check when the number looks implausibly good: a 95%+ engagement rate is almost always a key-event configuration problem, not a beloved website. The audit is short — list your key events, and ask of each one whether a session that did only that deserved the label.
It deflates more quietly. Background tabs accrue no time, so audiences that queue articles get undercounted. Single-page visits that read for nine seconds miss by one. And because the definition is GA4's alone, any side-by-side with another tool's numbers turns into apples and oranges — if you must reconcile tools, compare total sessions, not engaged ones, and let engagement rate be a within-GA4 metric.
The practical takeaway
Engagement rate is bounce rate with the polarity flipped and a timer attached: a decent first-pass health metric, a poor scoreboard. Ignore borrowed benchmarks, let GA4's own percentile bands or your own history be the comparison, keep key events restricted to actions you'd genuinely call success, and read the number per page job rather than sitewide. When it moves sharply in either direction, check the key-event list before celebrating or panicking — the metric changes more often than websites do.