Website metrics to track (and the ones to skip)
Every analytics tool offers forty numbers; a working dashboard needs about a dozen. The metrics worth a regular look, sorted by the question each one answers.
Pick metrics by question, not by dashboard
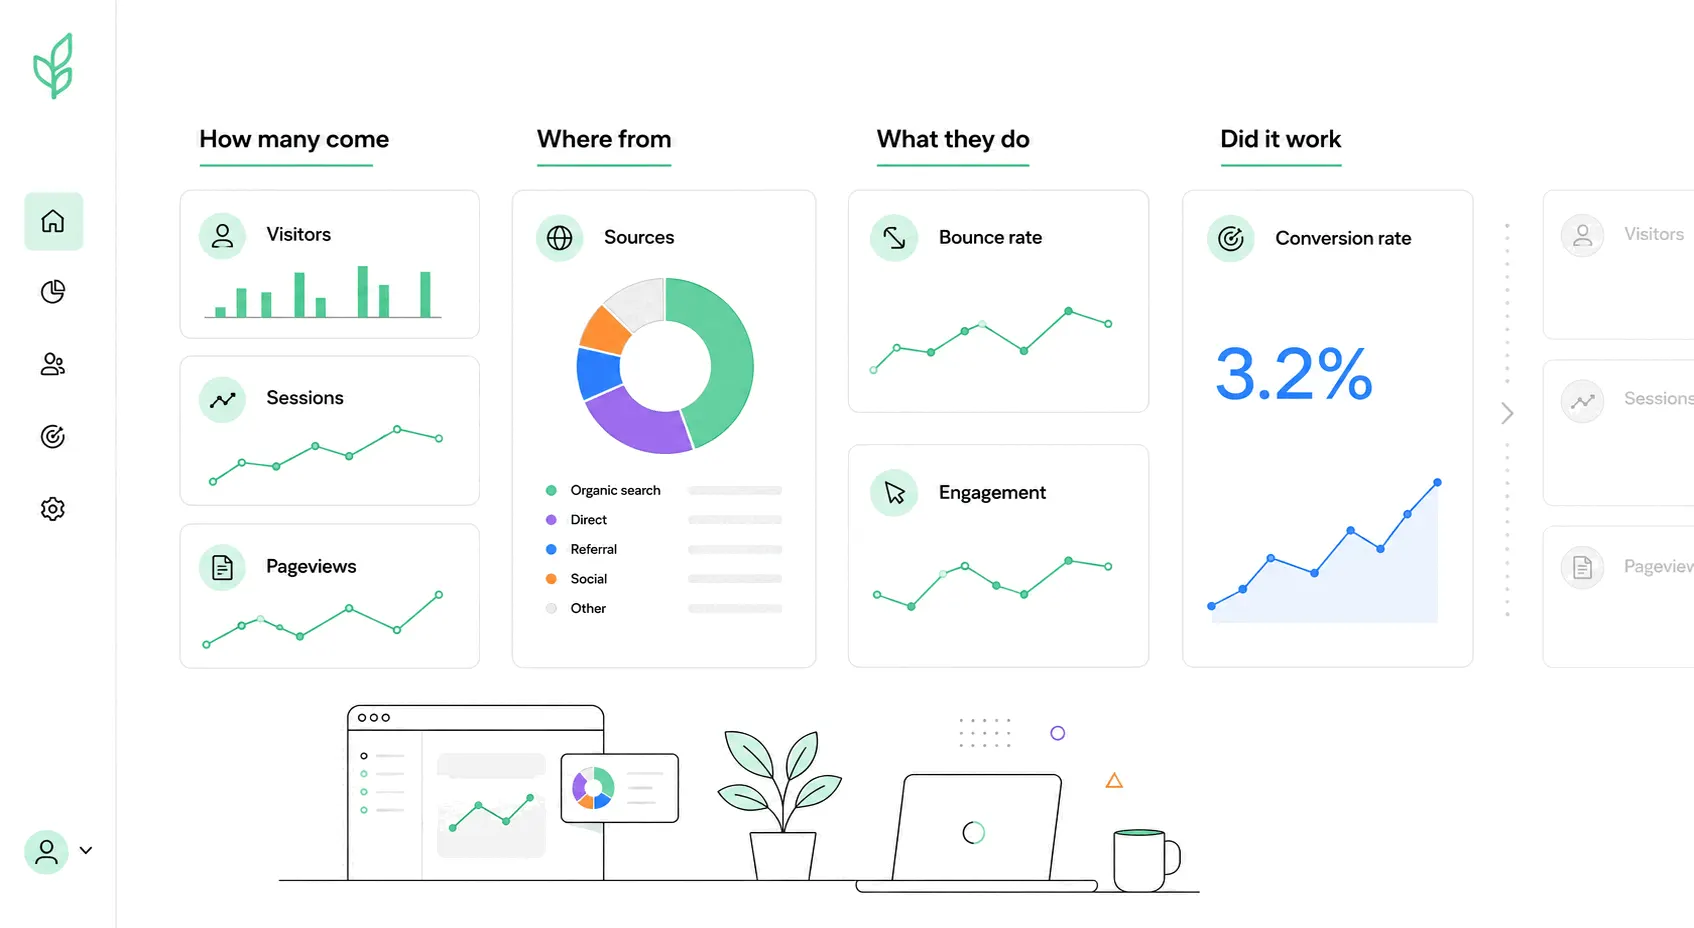
Open any analytics tool and the metric list runs well past the scroll. Tracking all of it works out the same as tracking none of it: when every number is on the dashboard, no number gets looked at. The list below is the working set for a typical site - fourteen metrics, grouped under the four questions they answer - with a deeper guide linked wherever one exists.
One habit matters more than any single metric: choose a few you will actually check on a schedule and let the rest sit. There is a five-metric morning routine if you want the compressed version of this post, and if the field is new to you, what web analytics is and how the numbers get made are the background reading.
How many people come: audience metrics
Track all four, headline one. For most sites unique visitors is the right choice; an ad-supported site can defensibly headline pageviews, since loads are the product.
The size question - is anyone visiting, and is that changing:
- 1. Unique visitors - how many people came, each counted once. The honest headline number for growth, and the one where tools disagree most, because counting a person across devices and days is genuinely hard.
- 2. Sessions - how many separate visits those people made. Someone reading at breakfast and again at night is one visitor and two sessions; the session rules hide more edge cases than you would expect.
- 3. Pageviews - how many pages got loaded. The biggest and most flattering of the three counts, useful for spotting the pages that carry the site and misleading as a growth measure.
- 4. New vs returning visitors - whether you are attracting strangers or serving regulars. Growth needs the first, loyalty shows in the second, and the split has measurement quirks worth knowing before you trust it.
Where they come from: acquisition metrics
The question behind every marketing decision - which effort brings people in:
- 5. Traffic sources - arrivals split into search, direct, referral, social and paid. The first report to open when the total moves, and where each channel begins and ends matters more than it looks.
- 6. Organic traffic - the search-engine slice on its own. It grows slowly, fades slowly, and reflects months-old work, which makes its trend line the best single readout of whether your content effort is compounding. What counts as organic is narrower than most people assume.
- 7. Direct traffic - nominally people who typed your address, in practice a bucket that collects every visit the tool cannot attribute. Watch its share of the total: when it swells, your attribution is leaking somewhere.
What they do once there: engagement metrics
The question of whether visits are worth anything - did anyone actually read, scroll or stay:
- 8. Bounce rate - the share of sessions that end on the page they started. High is not automatically bad; a blog post that answers the question in one screen earns its bounces, and context decides what counts as good.
- 9. Engagement rate - the newer lens on the same question: the share of sessions that lasted past ten seconds, viewed a second page or converted. The three criteria are worth understanding before comparing it to anything.
- 10. Average session duration - how long visits last. Directionally useful, but the clock behind it misses more than it measures, so treat changes as signals and the absolute number with suspicion.
- 11. Scroll depth - how far down the page people get. The metric that says whether anyone ever met the call-to-action at the bottom; tracking it takes a little setup and repays it on long pages.
- 12. Exit rate - which page each session ended on. Not the same thing as bounce rate, and mostly useful for finding the step in a multi-page flow where people give up.
Whether it worked: outcome metrics
If conversions happen over several steps, the funnel view of these same events shows where people quit between them - usually the most actionable chart in the whole tool. And if your site has logins, outcome events are where web analytics hands off to product analytics.
The question the site exists to answer:
- 13. Conversion rate - the share of visitors who did the thing the site is for: bought, signed up, booked, subscribed. The denominator matters as much as the count, and what a good rate looks like varies more by industry than by skill. Setting up the tracking is a one-time job worth doing early.
- 14. Custom events - the named actions between arrival and conversion: started the form, watched the video, added to cart. This is where analytics stops being generic; choosing the right ten events is the real setup work.
Metrics you can mostly skip
Anything you check to feel good rather than to decide something. Raw hit counts and total-time-on-site belong to an older internet; per-page time averages inherit every problem session duration has; and rankings, follower counts and other off-site numbers are inputs to traffic, not measures of it. The test is blunt: if no decision would change when the number moves, it is decoration, not a metric.
The practical takeaway
Pick one metric per question - visitors, sources, engagement rate, conversion rate is a fine starting four - check them weekly, and open the other ten only when one of the four moves. Any of the current free analytics tools covers most of this list out of the box; Bigdelta puts the full set on one screen, free up to 100K pageviews a month, with events and funnels when you outgrow the basics. For a small operation without an analyst, there is a shorter, small-business version of this advice.