What is web analytics? A plain-English guide
You add one small script to your site and it starts counting: how many people visited, which search or link brought them, and whether any of them signed up. This guide explains how that works, what the terms on the dashboard mean, and how much to trust the numbers.
The short answer
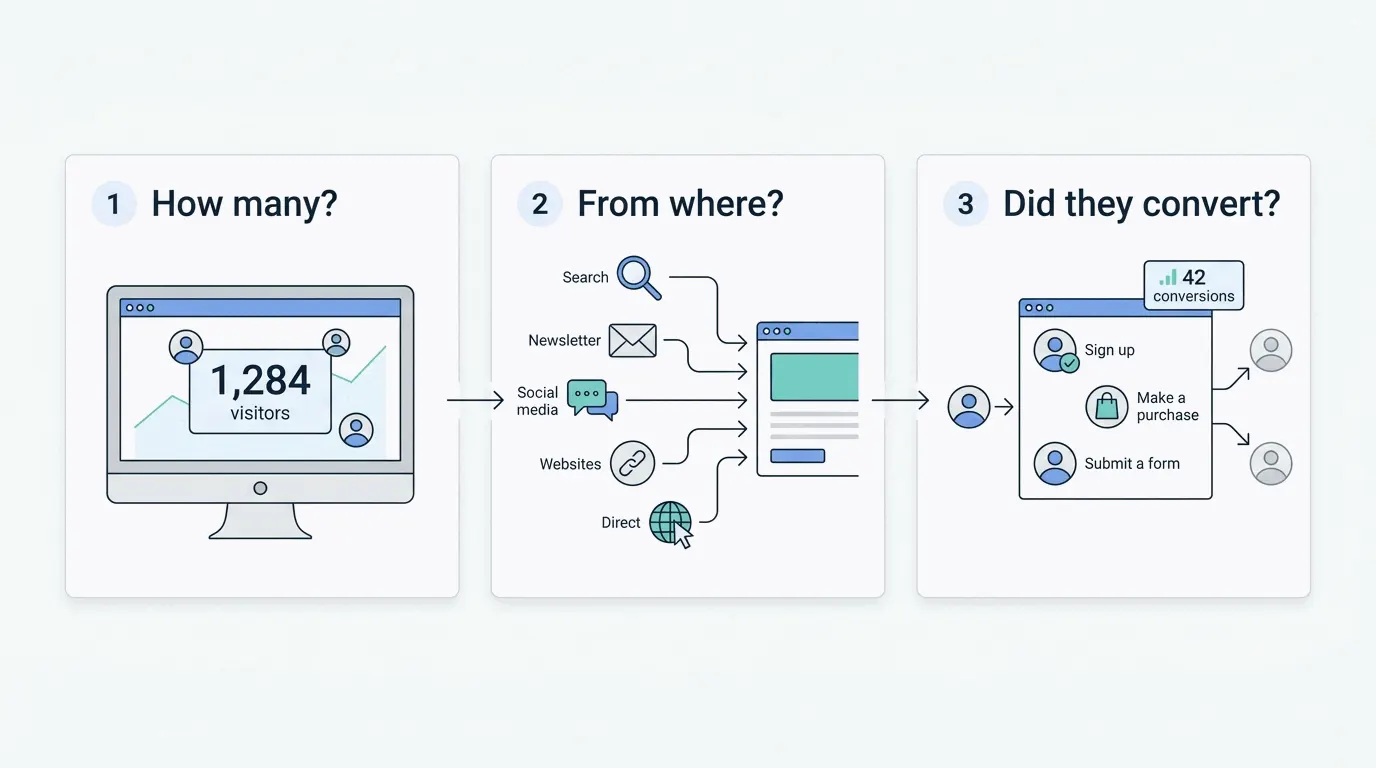
Web analytics — also called website analytics — is software that counts what happens on your website. It tells you how many people visited, which pages they looked at, where they came from — a Google search, a newsletter, a link someone posted — and whether they did the thing the site exists for, like buying something or signing up.
That's all it is. The confusing part is the vocabulary. Dashboards are full of words like sessions, bounce rate and attribution, and none of them are hard ideas once someone explains them in normal language. That's what this guide does, with a link to a longer explanation for each one.
How does web analytics work?
You copy a small piece of code from your analytics tool and paste it into your website's HTML. Every site builder has a settings field for this, and it takes a couple of minutes. From then on, each time someone loads a page, that code sends a report back to the tool: which page, at what time, from which country, on which device, and which site the visitor came from. The dashboard is those reports added up.
Two limits follow from this. The tool only sees your own site, so once a visitor leaves, you have no idea what they do next. And some visitors are invisible to it: adblockers and some privacy-focused browsers stop the code from running, so every analytics tool undercounts to some degree. This is also part of why two tools installed on the same site report different numbers.
The words on the dashboard
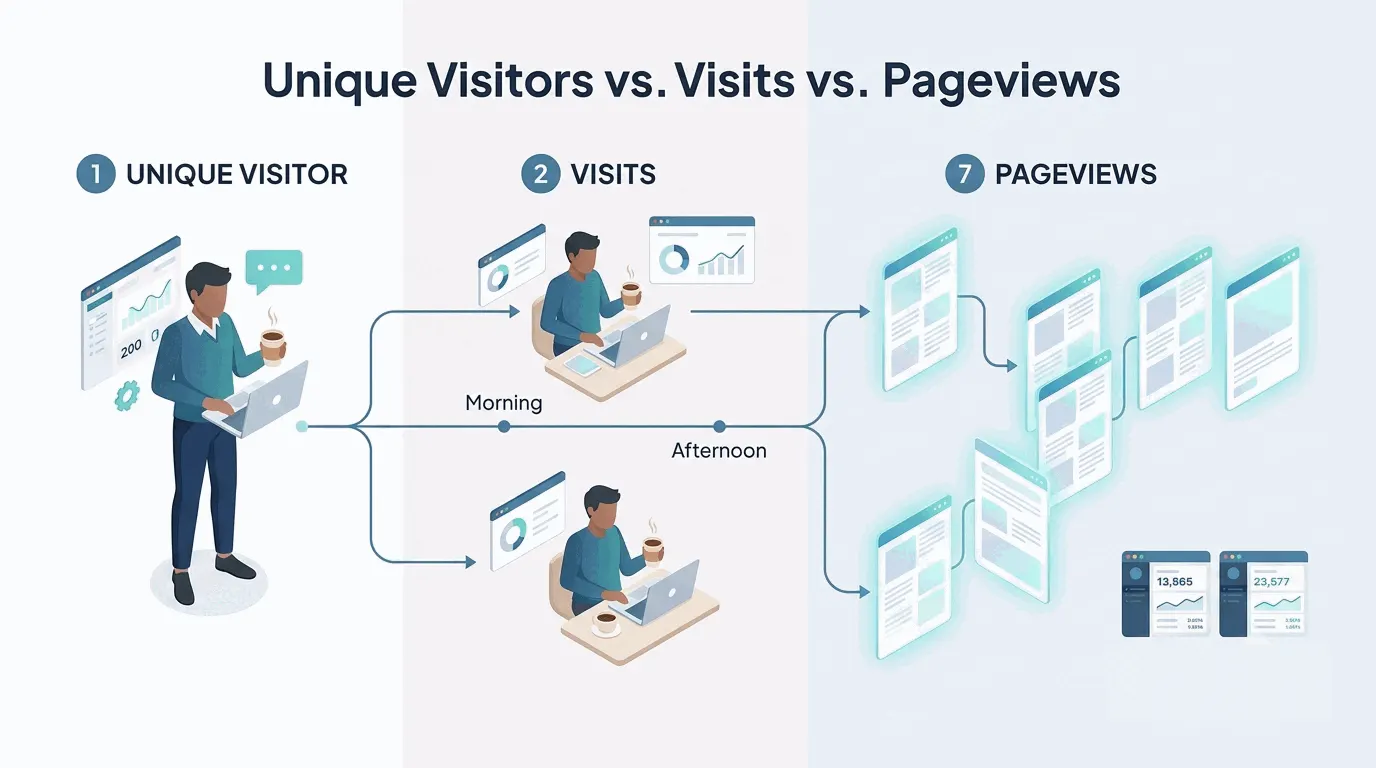
Visitors, visits, pageviews. A visitor is a person (roughly). A visit — also called a session — is one sitting. A pageview is one page load. If someone reads seven pages in the morning and comes back after lunch to read one more, that's 1 visitor, 2 visits and 8 pageviews. Tools disagree about which of the three to put at the top of the dashboard, which trips up almost everyone at first. There's a full explanation of the three numbers here.
Traffic sources. Where your visits came from: search engines, ads, social media, other websites linking to you, email, or 'direct' — the label tools use when the browser didn't say. This is usually the most useful chart you have, because it tells you which of your marketing efforts bring people in. Traffic sources explained covers reading it; UTM parameters covers tagging your own links so campaigns show up correctly.
Bounce rate. The percentage of visits where the person left after one page. A high number looks alarming but often isn't — someone who searched a question, read your answer and left got exactly what they wanted. Whether yours is a problem depends on the page and the site type; see what's a good bounce rate.
Events and conversions. A pageview only says a page loaded. An event records something the visitor did on it: clicked a button, submitted a form, started a checkout. A conversion is whichever event you decide counts as success. Setting these up is less technical than it sounds — see which events to track and how to track conversions.
Sessions and time on site. A session groups one visitor's activity into a sitting, and tools cut it off differently — usually after 30 minutes of silence, but the definitions vary enough to move your numbers. Time-on-site figures inherit the same problem: the last page of every visit counts as zero, because the clock only ticks between page loads. Read both as rough shapes, and compare them only inside the same tool.
New vs returning visitors. The split between first-timers and people coming back. It runs on a browser identifier, so the same person on a phone and a laptop counts as two new visitors — what the split can and can't tell you. Useful trend to watch; unreliable as a headcount.
Engagement rate. GA4's replacement for bounce rate, counting a visit as 'engaged' if it lasted 10 seconds, converted, or viewed a second page. It sounds like a quality score and mostly measures the same thing bounce rate did, inverted and with different cutoffs. Its cousin, exit rate, tells you which page was last in the visit — not the same thing as a bounce.
What can web analytics tell you — and what can't it?
Analytics is good at aggregates: what kind of people visit, which sources send visitors who actually convert, which pages lose people. For questions like 'is my marketing working' or 'does anyone read this page', it has real answers.
It won't tell you who an anonymous visitor is. There's no name or email attached to a visit, and products that claim to reveal them are either limited to company names on office traffic or operating somewhere you don't want to be a customer. It also won't tell you why people do what they do. The numbers show that half your visitors abandon the signup form; to understand what's wrong with the form, you watch recordings of real sessions.
How accurate are the numbers?
Close, and never exact. Every counting method leaks somewhere: adblockers and privacy browsers stop the script from running for a meaningful share of visitors, consent banners lose whoever clicks no, and bots inflate whatever gets through. Install two tools on the same site and they'll disagree by 10–30% — with neither one broken.
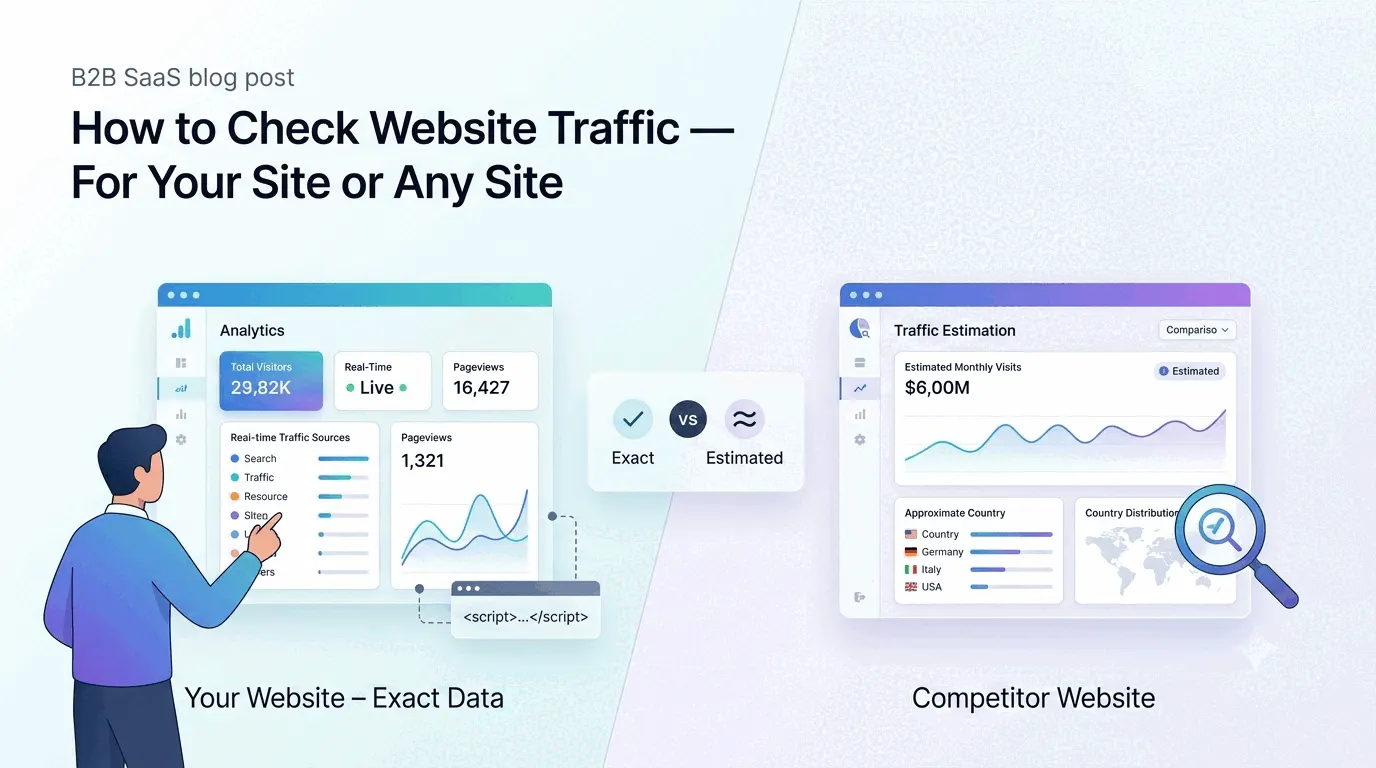
Three habits keep the imprecision from mattering. Compare numbers only within one tool, since each tool at least leaks consistently. Read trends rather than single readings — a 40% traffic jump is real even if the baseline is undercounted. And treat outside estimates of your traffic (SimilarWeb and similar) as a different, much rougher instrument than your own counter.
One number deserves special suspicion: whatever your ad platform reports. Google Ads and Meta count clicks on their side; your analytics counts arrivals on yours. The two routinely disagree, and the gap isn't fraud — it's two instruments measuring different moments.
Do I need a cookie banner for web analytics?
Depends on how the tool counts. Traditional analytics stores a cookie in the visitor's browser to recognize return visits; under EU rules that generally means asking permission first, which is where the banner comes from. A newer generation of tools counts visitors without storing anything on the device — cookieless analytics — and sites using them typically skip the banner for analytics purposes (a banner may still be needed for ads or other tracking; that's a lawyer question, not an analytics one).
The trade is measurement, not just paperwork. Cookieless tools can't recognize a visitor across days, so they overcount unique visitors; consent-based tools undercount everyone who declines. Pageviews stay trustworthy either way. Session recording adds its own disclosure duties — replay tools and privacy law is the longer read — and belongs in the privacy policy regardless of the cookie question.
Is web analytics the same as Google Analytics — or SEO tools, or product analytics?
Google Analytics is one web analytics tool, the way Kleenex is one tissue. It's free and the default, which is why the category and the product blur together — but the category is bigger, and a lot of it exists specifically because GA4 is hard to read.
Two neighboring categories share the dashboard space and answer different questions. Search Console (and SEO tools generally) measures your site's life inside Google — which queries showed your pages, where they ranked, who clicked — before the visit ever happens; Search Console vs Google Analytics draws the line. Product analytics starts where web analytics stops: once someone signs up, it follows what they do inside the product — feature usage, retention, funnels — keyed to a known user rather than an anonymous visitor. The boundary runs through events: if most of what you track happens after login, you're shopping in the product-analytics aisle, though some tools (Bigdelta among them) cover both sides of the signup line.
What is web analytics used for?
In practice, analytics exists to answer questions. The common ones early on: is anyone using my website at all? Did my launch work? I'm getting traffic — why is nobody signing up? Where do people get stuck?
Once a site is running, the useful habit is small: check a few numbers regularly and ignore the rest of the dashboard until something looks off. If you've just launched, here's what to track first.
Which tool should a beginner pick?
Google Analytics is free and powerful, and most people who install it never get comfortable with it — the interface assumes you already know what you're looking for. Enough site owners have hit that wall that an entire category of simpler tools grew out of it. Lightweight tools like Bigdelta, Plausible and Fathom show fewer numbers on a dashboard you can read without training, which for most small sites is the better deal — the comparison is here. If you built your site on a platform with analytics included, it's worth knowing where the built-in numbers stop: we've looked at Lovable and Replit.
Setup is the same everywhere: paste the snippet, wait a few minutes, watch the first visitors appear. The traffic-checking guide walks through it.
The practical takeaway
Install one web analytics tool and define one conversion, and you already have most of what web analytics offers: a running count of visitors, where they come from, and whether the site does its job. Treat the numbers as close-but-not-exact, because they are, and make decisions from trends rather than single readings. When a specific number starts bothering you — bounce rate looks high, traffic dipped, signups stalled — that's what the rest of this library is for.