New vs returning visitors: what the split tells you
Every analytics tool splits your audience into first-timers and regulars, and every one of them gets it wrong in the same direction. How the split is measured, why 'new' is inflated, and what the ratio is still good for.
How the split is actually decided
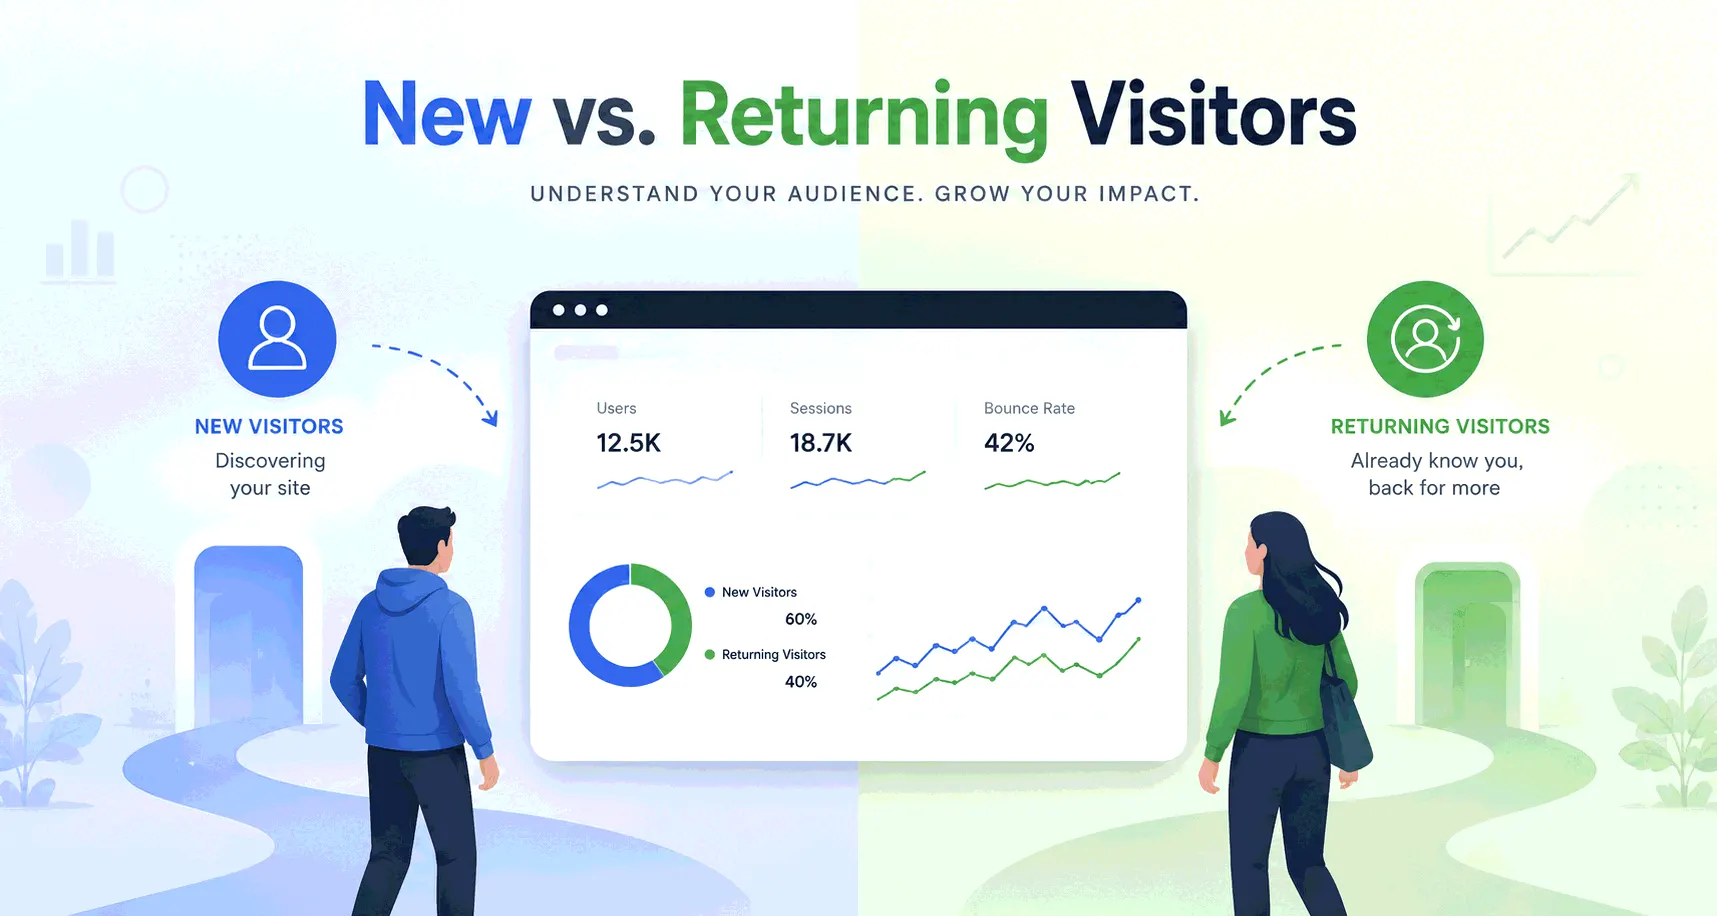
A web analytics tool calls you a returning visitor if it has seen your browser before — that's the entire test. On your first visit, the tool plants an identifier (in GA4, a first-party cookie that also fires the first_visit event) and files you under new. Come back with that identifier intact and you're returning. There's no memory of you in this, only of the identifier: the split is really 'browsers we recognized' versus 'browsers we didn't'.
That distinction does useful work. New visitors measure reach — whether search, ads and referrals keep finding fresh people. Returning visitors measure pull — whether anything about the site earns a second trip. The two answer different business questions, which is why the ratio between them gets read as an acquisition-versus-retention gauge.
Why 'new' is always inflated
The test fails in one direction only: a recognized browser is genuinely a returner, but an unrecognized one is frequently a regular in disguise. The identifier is fragile. Safari caps script-set cookies at seven days — twenty-four hours if the visit arrived through an ad click — so an iPhone reader who comes back weekly is born again every single week. Anyone who clears cookies or browses privately resets to new. And the same person on their laptop and their phone is two browsers, hence two 'new' visitors, unless they're signed in to something that stitches devices together, which by default they are not.
None of this is a setup mistake — it's the same structural fragility that makes analytics undercount in general, applied to memory instead of visibility. The practical rule: treat the returning number as a floor. Your real regulars are more numerous than the report admits, your real reach is smaller, and the inflation is worst in mobile-heavy, privacy-conscious audiences. Fully cookieless tools sit at the far end of this trade — some can't connect visits across days at all, which is a deliberate privacy choice with the split as its price.
What is a good new vs returning visitor ratio?
There's no universal good ratio, because the right split is a property of the business. A newsy site living off search can run 60%+ new and be thriving — a high share of one-time readers is what winning at search looks like. A grocery-style store should be majority returning, since its whole model is repeat purchase; a luxury store with a two-year purchase cycle will read overwhelmingly new and be fine. SaaS marketing sites sit in between: heavy new traffic while prospecting works, with the returning share creeping up as evaluations progress.
Published benchmark tables for this metric are best treated as scenery — the ranges differ source to source, and every one of them inherits the undercounting bias of whatever tool produced it. Two comparisons beat them both: your own split three months ago, and the split cut by traffic source. Search and paid should skew new; email and direct should skew returning. When a channel breaks that pattern — a newsletter audience reading as mostly new, say — you've usually found a measurement artifact rather than an audience change.
If you want a rough compass anyway, reason from the business model rather than a table. Sites that live on search discovery - blogs, news, reference content - commonly sit around 70-80% new, and that's health, not failure. Repeat-purchase commerce and community sites should see returning share climbing toward parity or beyond, because coming back is the product working. SaaS marketing sites typically read 60-70% new while acquisition runs. These are shapes, not targets: a number is only wrong when it disagrees with how your business is supposed to work, and the inflation of "new" described above means every real returning share is higher than the one on your screen.
Reading it without fooling yourself
The level is noisy; the trend is the signal. A returning share that climbs quarter over quarter means something is compounding — content worth revisiting, a product pulling people back — and that conclusion survives the undercounting, because the bias is roughly constant while the trend is not. A returning share collapsing after a redesign or a consent-banner change, by contrast, is more often the identifier breaking than the audience leaving. Check measurement before strategy.
Two comparisons to refuse: your split against a competitor's, and your split across two different tools — the definitions underneath are too different for either to mean anything, a problem this library has covered in general. And when the question you actually care about is 'how loyal is my audience', pair the split with visits per visitor from the visitors, visits and pageviews post: the split says how many people came back at all, the ratio says how hard they did.
The practical takeaway
The new-vs-returning split is a decent compass and a poor odometer. Trust its direction over time, read its level per traffic source with the undercounting in mind, and let your business model — not a benchmark table — decide which way it should lean. When it moves suddenly, suspect the measurement first. When it drifts steadily, believe it.