Website analytics for small business, without the analyst
Most small businesses have analytics installed and nobody who reads it. The handful of numbers worth an owner's time, a twenty-minute weekly routine, and how to pick a tool that doesn't fight back.

The problem isn't data, it's time
Most small businesses are past the have-a-website question - 83% of US small businesses have one, per Clutch's 2025 survey. The common condition is a site with analytics installed during setup and a dashboard nobody has opened since. That's not a discipline failure; the standard tools were built for people whose job is reading them, and a small business doesn't have that person.
The fix is not more data. Web analytics earns its place in a small business by answering three working questions - where should I spend my marketing effort, is what I'm doing working, and is anything broken - and answering those takes a handful of numbers and about twenty minutes a week.
The five numbers worth an owner's time
That's the short list. The full fourteen-metric version exists when you want it, but a small business that watches these five consistently is ahead of most that track everything.
Ignore the rest of the dashboard until one of these moves:
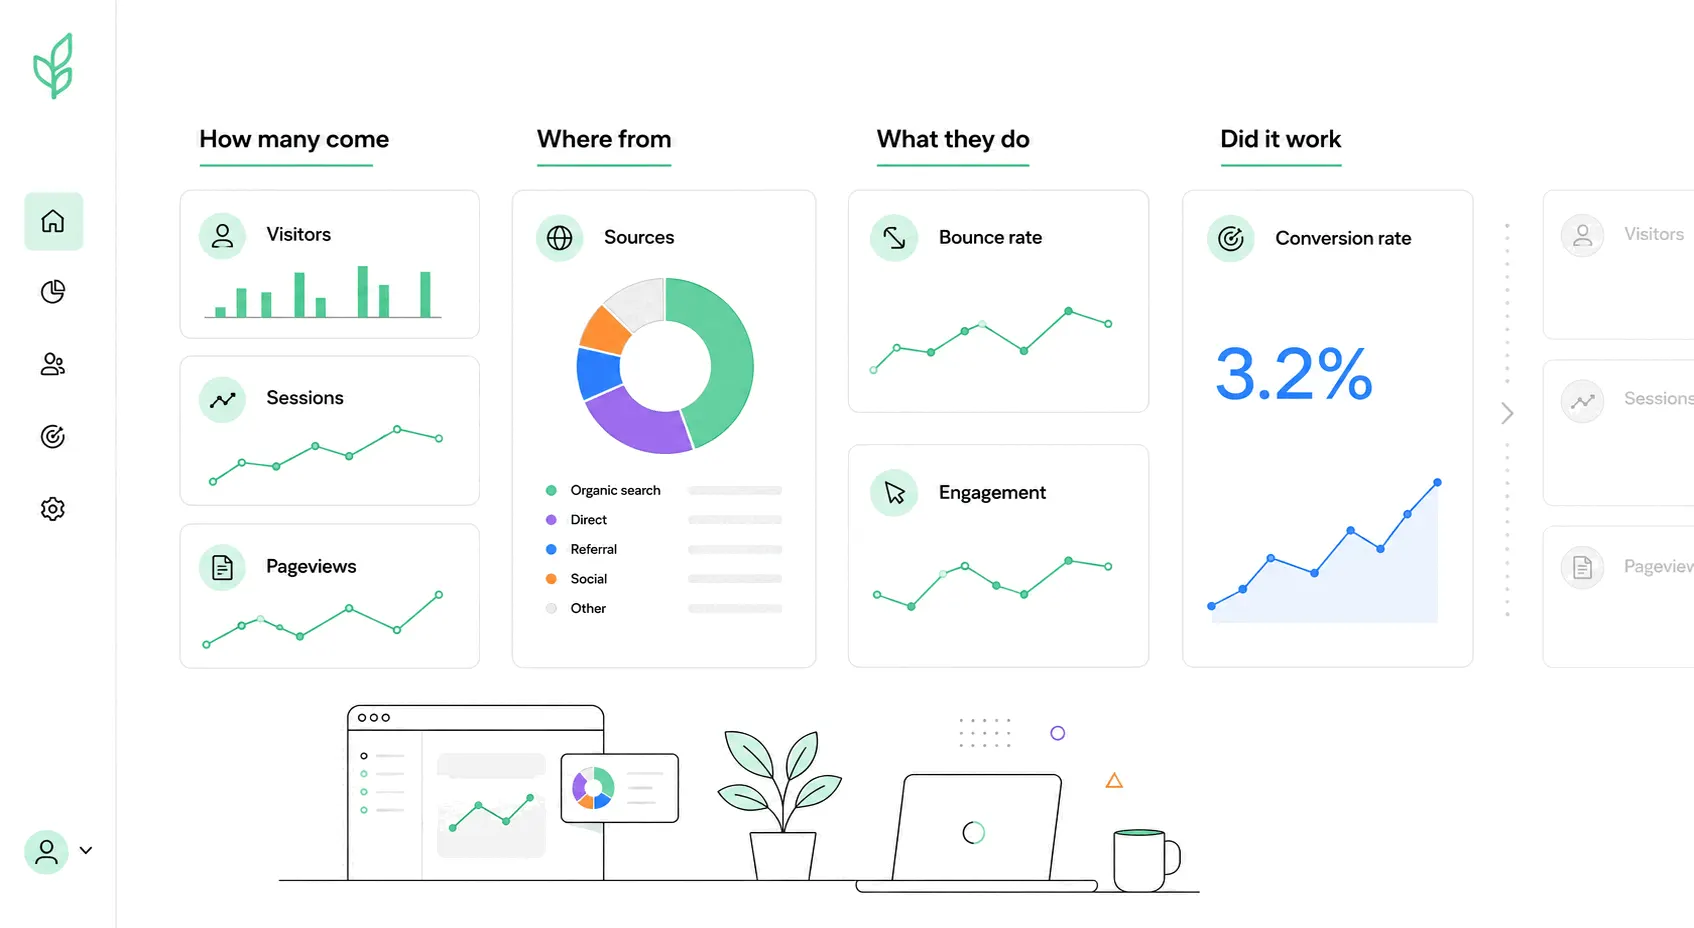
- Visitors, as a trend - not the absolute count, which mostly measures the size of your niche, but the direction over months. Up, flat or down is the whole reading.
- Traffic sources - the split between search, social, referrals and direct. This is the effort-allocation number: it tells you whether the Instagram posting or the blog writing is the thing bringing people in. Where each channel's boundaries sit is worth ten minutes once.
- Top pages - which pages people actually visit. Usually a surprise the first time, and it decides what to write, update or promote next.
- Conversion rate - the share of visitors who do the thing the site is for: call, book, buy, fill the form. It needs a one-time setup that most owners skip, and it converts every other number from trivia into information. What counts as good varies wildly by industry, so benchmark against your own last quarter, not a listicle.
- One engagement number - bounce rate or engagement rate, either works - as a smoke alarm. Stable is fine; a sudden change says something broke or something you changed mattered.
The twenty-minute weekly routine
Once a week, same day, open the dashboard with one question - the default is "what changed since last week, and which source or page changed it". Glance at the five numbers, chase the one that moved, write one sentence down. The sentence matters: three months of one-liners is how you learn what normal looks like for your business, and normal is what makes anomalies visible.
Monthly, compare against a fair period - the same month last year if your business is seasonal, not last month, and mind that an honest comparison accounts for month lengths and holidays. If a number has genuinely dropped, there's a checklist for finding out why before assuming the worst. Resist checking daily; day-to-day numbers are mostly noise, and the habit dies of boredom within a month.
Picking a tool when nobody has time to learn one
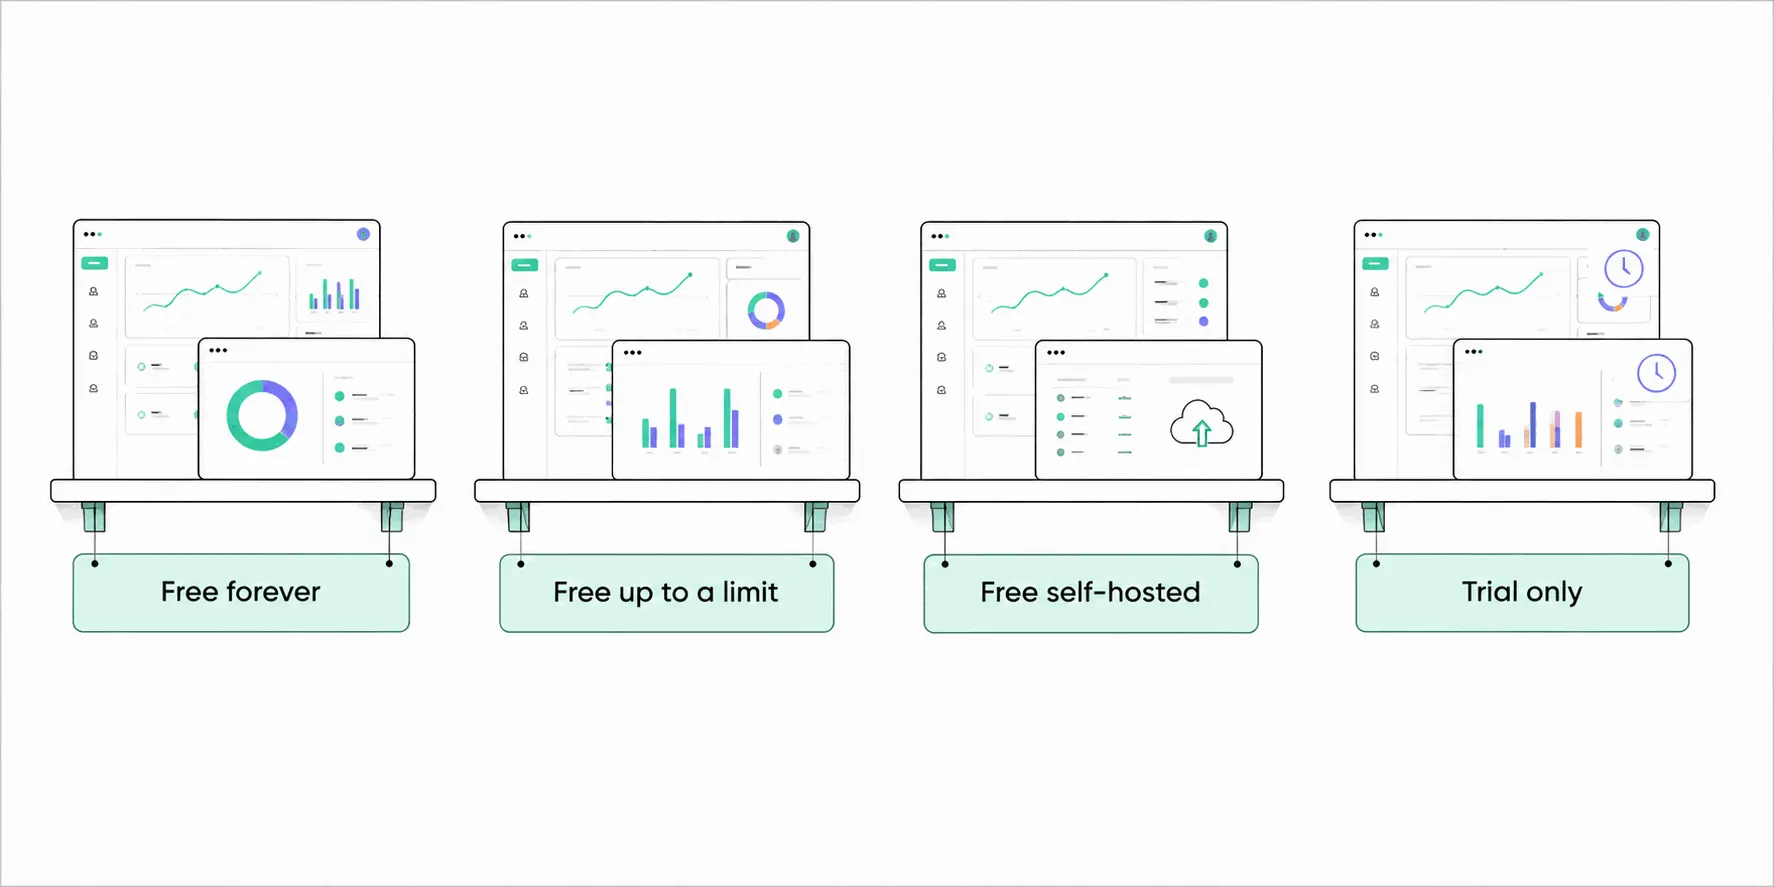
The criteria are different for a small business than for a marketing department. Readable in one glance beats powerful. Conversion tracking must be included, not an add-on, because conversion rate is the number that pays for the habit. And the price should be zero or close to it at small-business traffic levels - there are genuinely free options at every level of depth.
Google Analytics is free and is the tool most small businesses have installed; it's the right call if you run Google Ads, and otherwise tends to be the reason the dashboard never gets opened - the case for the simpler alternatives is really a case about whether the tool gets read. Bigdelta sits in that simpler generation: the five numbers above on one screen, conversion tracking included, free up to 100K pageviews a month - roughly all of them, for a typical small-business site - plus session replays for the days when a number moves and you want to see what visitors actually experienced.
If your website is an app
One carve-out: if customers log in and use your site as a product - a booking portal, a SaaS, a members area - the questions change from "who visits" to "who stays", and that's a different kind of analytics. The five numbers above still cover your public pages; the product side needs its own measures.
Mistakes worth skipping
The recurring ones, from businesses that gave up on analytics once already: treating the visitor count as a scoreboard instead of a trend; comparing a 28-day month against a 31-day one and reacting to the "drop"; tracking follower counts and rankings as if they were site metrics; and trusting the numbers as a census when a slice of real visitors never shows up at all thanks to ad blockers. The numbers are a good sample. Read direction and proportion, not decimals.
The other one is quitting because the data was boring. Small-site data often is - flat lines, small counts. Flat is information: it says the current effort maintains, and growth needs a new effort, which is exactly the kind of decision analytics exists to trigger.
The practical takeaway
Install one readable tool, verify it's counting, set up conversion tracking the same afternoon, and put twenty minutes on the calendar weekly. Five numbers, one question, one written sentence. A small business that does this for a quarter knows more about its marketing than most competitors with ten times the dashboard.