How to analyze website traffic
Checking your numbers takes a minute; making them say something is the actual work. A method for traffic analysis - the splits that matter, honest comparisons, and the junk to subtract first.
What does analyzing traffic actually mean?
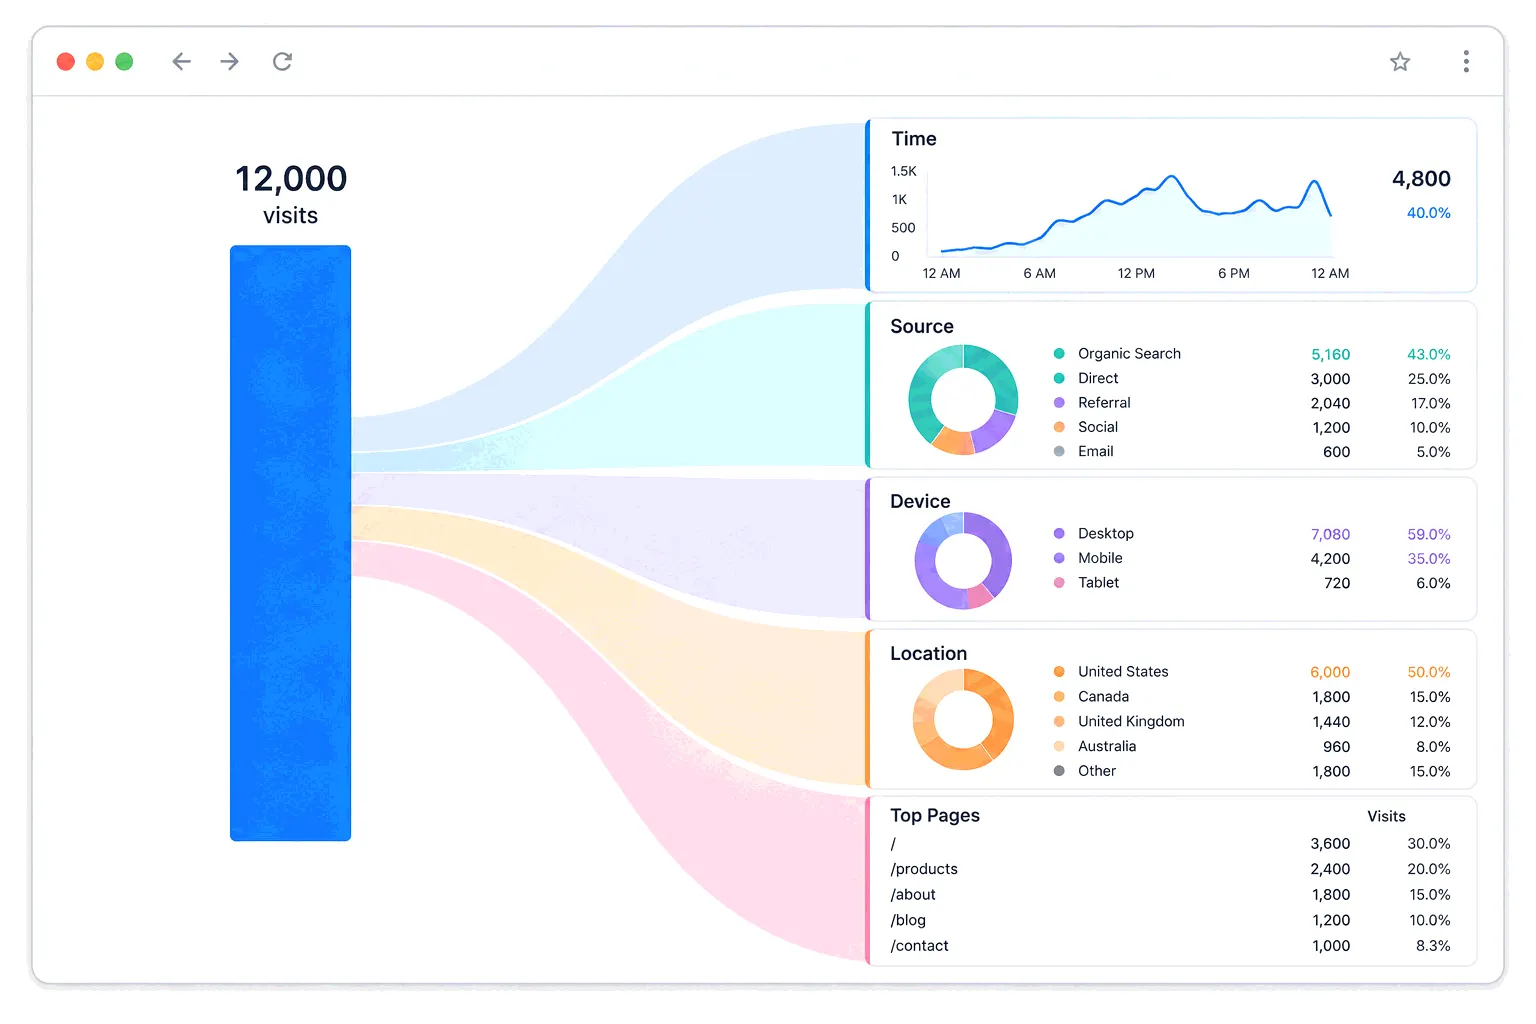
Checking traffic and analyzing it are different jobs. Checking reads the total: 12,000 visits last month. Analysis splits that total until it explains something - which pages earned the visits, which sources sent them, whether the number is drifting up or down once you strip out the noise. The total on its own carries no lesson. 12,000 is neither good nor bad until you know what it was the month before and where it came from.
The method is the same whatever tool you use: start from a question, split the total along the dimension that could answer it, and compare like with like. The report names differ between Google Analytics and the lighter tools; the moves don't.
Start from a question, not a report
Opening the dashboard to "see how things are going" produces scrolling, not findings. Analysis starts with something you actually want to decide: is the blog earning its keep? Did the redesign help mobile visitors or hurt them? Which source sends people who stick around? A question tells you which split to make and when you're done.
If you don't have a question yet, borrow one: what changed since last month, and which segment changed it? That one never runs out.
The five splits that do most of the work
The real findings appear when you cross two splits. "Traffic is down 15%" is a worry; "mobile search traffic to the pricing page is down 40% while everything else held" is a lead you can chase. Where each source category begins and ends is worth understanding before you trust the source split, and the new-vs-returning cut has its own measurement quirks.
Nearly every finding in traffic analysis comes from cutting the total one of five ways:
- By time - the same chart over a longer window. A week of data shows weather; a year shows climate. Trend direction matters more than any single number.
- By source - where visitors came from. GA4's Traffic acquisition report sorts arrivals into about twenty default channels; for most sites the ones that matter are search, direct, referral, social and paid.
- By landing page - which pages actually receive the arrivals. A handful of pages usually carries most of the load, and knowing which ones changes what you write next.
- By device - desktop and mobile often behave like two different audiences visiting two different sites.
- By new vs returning - whether you're attracting strangers or serving regulars, since growth and loyalty fail in different ways.
Compare like with like
Most wrong conclusions in traffic analysis are comparison mistakes, not data mistakes. February against March is 28 days against 31 - a built-in 10% "growth" before anything real happened; compare daily averages instead. A retailer's November tells you nothing about its November-to-January slide except that holidays end; compare against the same month last year when seasonality is in play. And a month with five weekends behaves differently from one with four if your traffic is weekday-shaped.
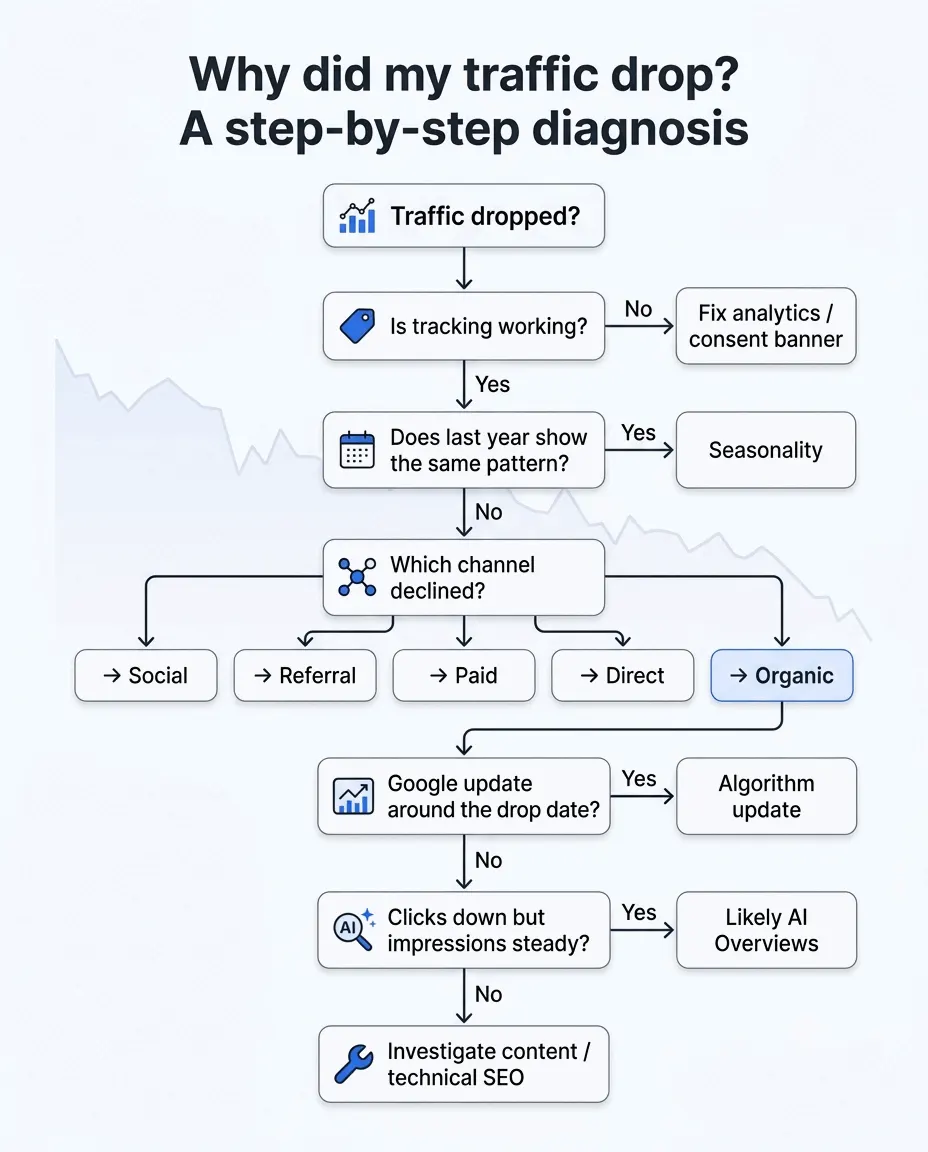
When a comparison does show a real drop and you need to find the cause, that's a diagnosis job with its own checklist - tracking breakage, seasonality, channel loss and Google updates, in that order.
Subtract the junk before you conclude
Some of your traffic isn't people. Imperva's 2026 Bad Bot Report puts automated traffic at roughly half of everything moving on the internet - an internet-wide figure, not your site's, but the direction applies everywhere. Analytics tools filter the bots they recognize and miss the rest, so a sudden spike from one country or one hosting provider deserves suspicion before celebration.
The error runs the other way too. Ad blockers and privacy browsers keep a meaningful share of real visitors out of your numbers entirely, and the direct-traffic bucket quietly collects visits that belong elsewhere. None of this makes the numbers useless - it makes them a sample. Trends and splits survive sampling; decimal points don't.
Where the numbers stop
Traffic analysis locates things - the page that lost its visitors, the source that dried up, the device where conversions lag. It doesn't explain them. The pricing page's mobile drop looks identical in the chart whether the cause is a broken button, a slow load or a competitor's launch. When the split has named a page and a segment, the next tool is qualitative: watching recordings of the sessions in question, or a heatmap of the page itself.
The practical takeaway
Once a week, take one question to the dashboard. Split the total by whichever dimension could answer it, cross a second split if the first one points somewhere, compare against a period that's actually comparable, and write the finding down - one sentence, so next month you remember what normal looked like. The splits need nothing exotic: GA4 has the reports if you dig, and simpler web analytics tools put source, page and device cuts on one screen.