Scroll depth: what it tells you and how to track it
How far down the page visitors actually get, how to record it in GA4 and elsewhere, and why "90% scrolled" can mean less than it seems.

What is scroll depth?
Scroll depth is the farthest point down a page a visitor reaches, usually recorded as a percentage of the page's height. It's the raw material behind the scroll maps in every heatmap tool, but it's also a metric on its own: an event that fires when a visitor passes 25%, 50%, 75% of a page, which you can count, segment and compare like any other event.
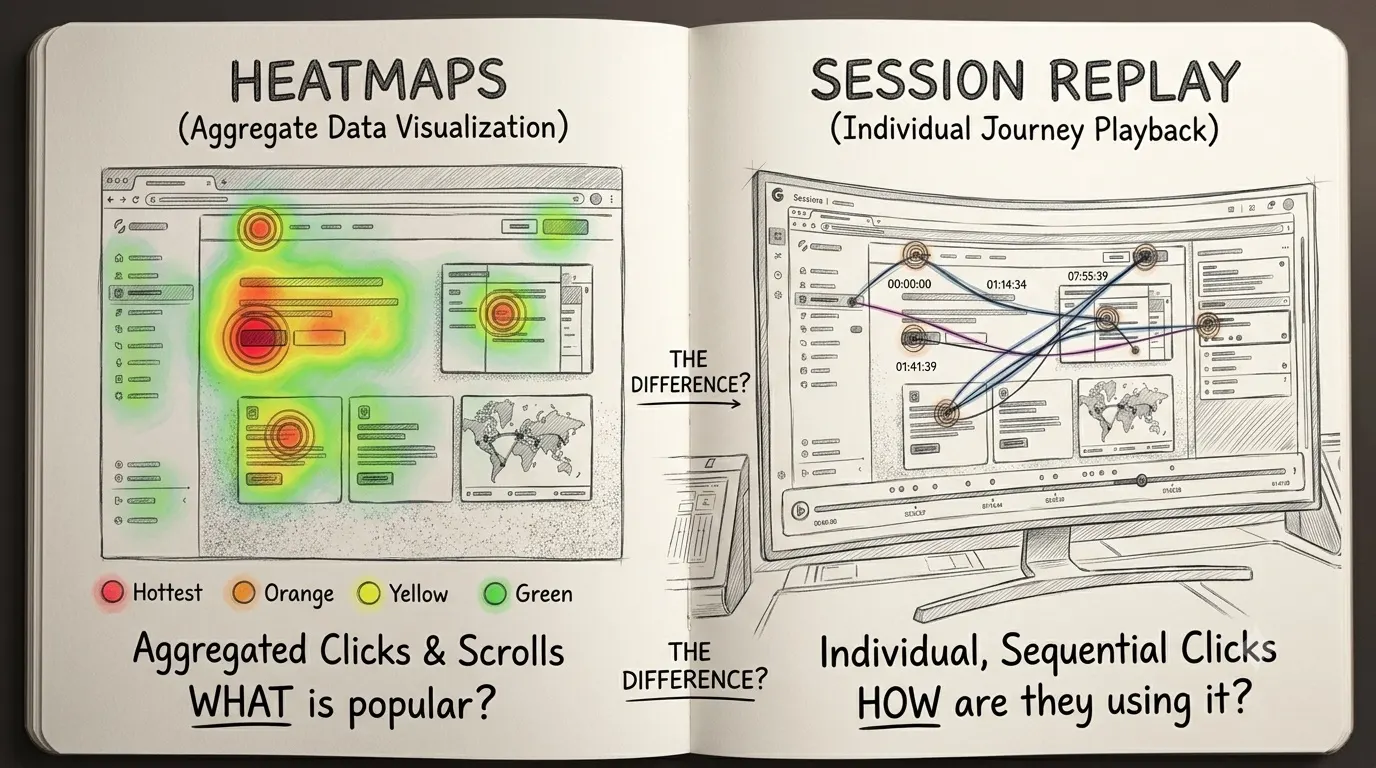
The two views answer different questions. A scroll map paints all visitors onto one picture of the page — good for seeing where attention collapses. The event stream tells you what share of visitors passed a threshold, which is the number you need when comparing two landing pages or checking whether anyone reaches the section you spent a week writing.
What GA4 tracks out of the box
GA4's enhanced measurement tracks scrolling out of the box, but barely: a single scroll event, fired the first time a visitor reaches 90% of the page, threshold not adjustable. Ninety percent is effectively the footer. You'll know who finished the page and nothing about where everyone else gave up — the difference between a reader who left at 30% and one who left at 85% is invisible.
Real thresholds take Google Tag Manager: its scroll depth trigger accepts any list of percentages or pixel values ("25, 50, 75, 90"), fires each once per pageview, and passes the threshold as a variable you can send to GA4 as an event. That's the standard setup, and it's a build-it-yourself afternoon. Heatmap and analytics tools that record scroll continuously — Bigdelta's heatmaps among them — skip the configuration entirely, since the same script that powers the scroll map already logs every visitor's depth.
Two things scroll events don't do in GA4, despite the folklore: they don't reset when someone scrolls back up (the event fires once, at the deepest point), and they don't count toward the engaged-session bar unless you explicitly promote a scroll event to a key event — which inflates engagement rate and is usually a mistake.
How far do people actually scroll?
The two studies everyone in this field cites are old enough to say so plainly. Chartbeat analyzed 25 million sessions in 2013 and found most visitors do scroll — about two-thirds of visits go below the fold — and that engagement time actually peaks below it, partly because impatient visitors start scrolling before the page finishes loading. Nielsen Norman Group's eyetracking work found 57% of viewing time stays above the fold (2018), down from 80% in their 2010 study: people scroll more than they used to and still spend most of their attention at the top.
The practical reading: expect a sharp drop in the first quarter of the page, don't take it personally, and put anything the visit depends on where the majority still is. What you shouldn't do is import anyone's percentages as a benchmark — scroll depth depends on page length, device mix and content type too much for cross-site numbers to mean anything.
Four ways the percentage misleads
Short pages ace the test by existing. A page that fits in one viewport registers 100% scroll for every visitor, engagement or not. On short pages the metric is noise; read time-on-page instead.
Lazy loading moves the goalposts. On pages that load content as you scroll — infinite feeds especially — the page height grows under the visitor, so "75%" refers to a page that didn't exist when they started. Pixel thresholds hold up better than percentages there.
Mobile scrolls farther and means less by it. A phone shows a fraction of what a desktop screen shows, so mobile visitors must scroll more to see the same content — mobile and desktop depths aren't comparable, which is why scroll maps render the two separately. Compare mobile to mobile.
And scrolled isn't read. Passing the 50% line means the visitor's viewport crossed it, possibly at flick speed. Scroll depth pairs with time to be meaningful — a page where visitors reach 80% in nine seconds has a skimming problem, not a reading audience.
Single-page apps inherit their usual caveat, too: without route-change tracking, "the page" never changes, and depth numbers smear across everything the visitor saw. Session recordings are the reliable fallback there.
What to actually use it for
The highest-value move is checking one page — the one your business depends on — for a mismatch between where the important content sits and where visitors stop. If the signup CTA lives at a depth 30% of visitors reach, that's a layout decision you can reverse this week, and the scroll data will tell you whether moving it worked. The same check catches false bottoms, the layouts that look finished mid-page and quietly end most visits; the heatmap post covers spotting them on a scroll map.
On content, scroll depth is an honesty meter for length: if half your readers never see the second half of your articles, the second half is where conclusions shouldn't live. And in an A/B test, depth makes a good secondary metric — two variants with equal conversions but very different scroll patterns are telling you something the conversion number can't.
The practical takeaway
Scroll depth tells you where the page ends for most people, which is rarely where it ends for you. GA4 alone only marks the finishers; set real thresholds through Tag Manager or use a tool that records depth continuously, read mobile and desktop separately, distrust the number on short or lazy-loaded pages, and pair it with time before calling anyone engaged. Then act on the one insight it delivers reliably: whatever matters most on the page has to live above the line where your visitors stop.