How to build a funnel in Google Analytics 4
Funnels are not in GA4's reports at all: they live in Explore, behind a template with its own vocabulary. Where to find it, how to define the steps, the open-versus-closed choice that changes your numbers, and the retention setting to fix before you need it.
Where funnels live in GA4
From the left navigation, open Explore and pick the Funnel exploration template. Explorations are available on every GA4 property, free tier included, so nothing here requires the paid version. If you have never opened Explore before, the surprise is that it is a workspace rather than a report: you assemble the funnel from building blocks in a settings column, and the chart redraws as you change them.
The old Universal Analytics goal funnels, the ones defined in admin settings and locked to page URLs, are gone. A GA4 funnel is built from events, which means anything you track can be a step, and the funnel is defined at analysis time rather than in advance. You can build a funnel today over data your site collected last month, with one important retention caveat covered below.
One nearby thing is easy to confuse with this. The standard Reports section contains a few fixed funnel-shaped views, like the checkout journey report for ecommerce properties, and Google's ads-side tooling talks about funnels too. Those are pre-built and not editable. When people say "GA4 funnels" they almost always mean the Explore version, the one you assemble yourself, and that is the one this guide covers.
Defining the steps
A funnel takes up to ten steps. Each step is a condition built from events and their parameters or from dimension values, so "session_start", "view_item", "begin_checkout" and "purchase" are all valid steps, and so is "page_location contains /pricing". The one thing a step cannot be built from is a metric, so there is no step for "revenue above 100" as a number on its own, though an event parameter condition like purchase value at or over 100 works.
Pick the smallest set of steps that answers your question. Landing page, signup form, account created is a funnel. Ten micro-steps through a checkout is also a funnel, but every extra step splits your traffic into smaller and noisier numbers. The advice in funnel analysis applies here unchanged: start coarse, then split the step the data points at.
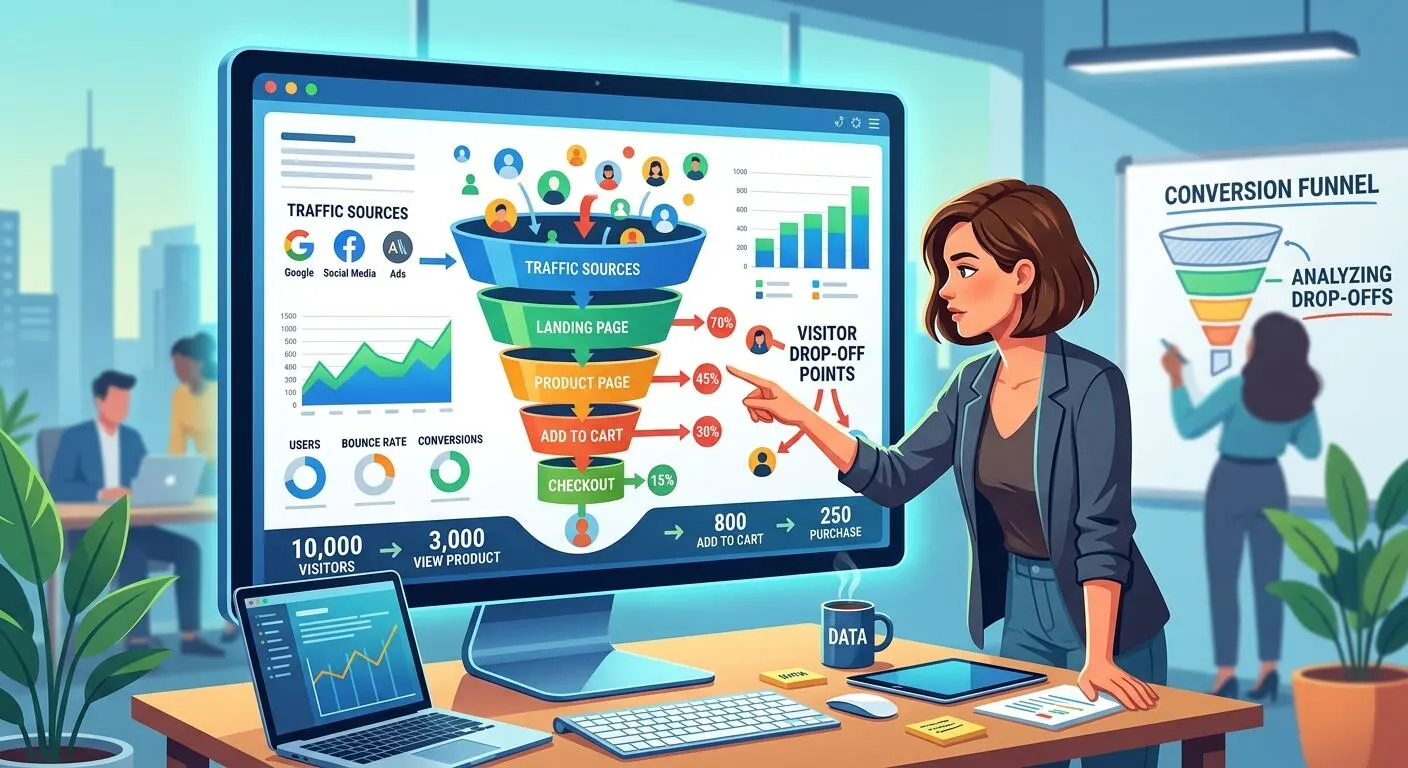
A worked example makes the workspace less abstract. Say you want the classic store funnel. Step one: the "session_start" event, named Arrived. Step two: "view_item", named Viewed a product. Step three: "add_to_cart". Step four: "begin_checkout". Step five: "purchase". Each step gets typed into the step editor in the settings column, each with "is indirectly followed by" as the relationship, and the chart draws itself as you go. If your store runs on the standard GA4 ecommerce events, all five of those exist already and the funnel costs you nothing new. For a content or SaaS site, swap in your own events, a pricing pageview, a "sign_up", whatever your tracking already records, and if the action you care about is not an event yet, that is the prerequisite to fix first, covered in conversion tracking in GA4.
Two settings control how strictly GA4 chains the steps together. Each step can be "indirectly followed by" the previous one, meaning anything may happen in between, or "directly followed by", meaning it must come immediately next. There is also a "within" option to require a step inside a time window. Directly-followed-by sounds rigorous and is usually a mistake on real traffic, because visitors wander: someone who views a product, checks the returns policy, then adds to cart has left a "directly followed by" funnel even though they did exactly what you hoped.
Open or closed?
The toggle that changes your numbers most is Make open funnel. In a closed funnel, the default, people must enter at step one, and anyone who misses a step falls out and stays out. An open funnel lets people enter at any step, so someone landing directly on the checkout still counts there.
Neither is wrong. A closed funnel answers "of the people who started this journey, how far did they get", which is the cleaner reading for a designed flow like signup. An open funnel answers "who passes through each stage, however they arrived", which fits shop-style browsing where entry points are everywhere. Just note which one you used before quoting a conversion rate, because the same traffic produces different numbers under each mode.
Reading the result
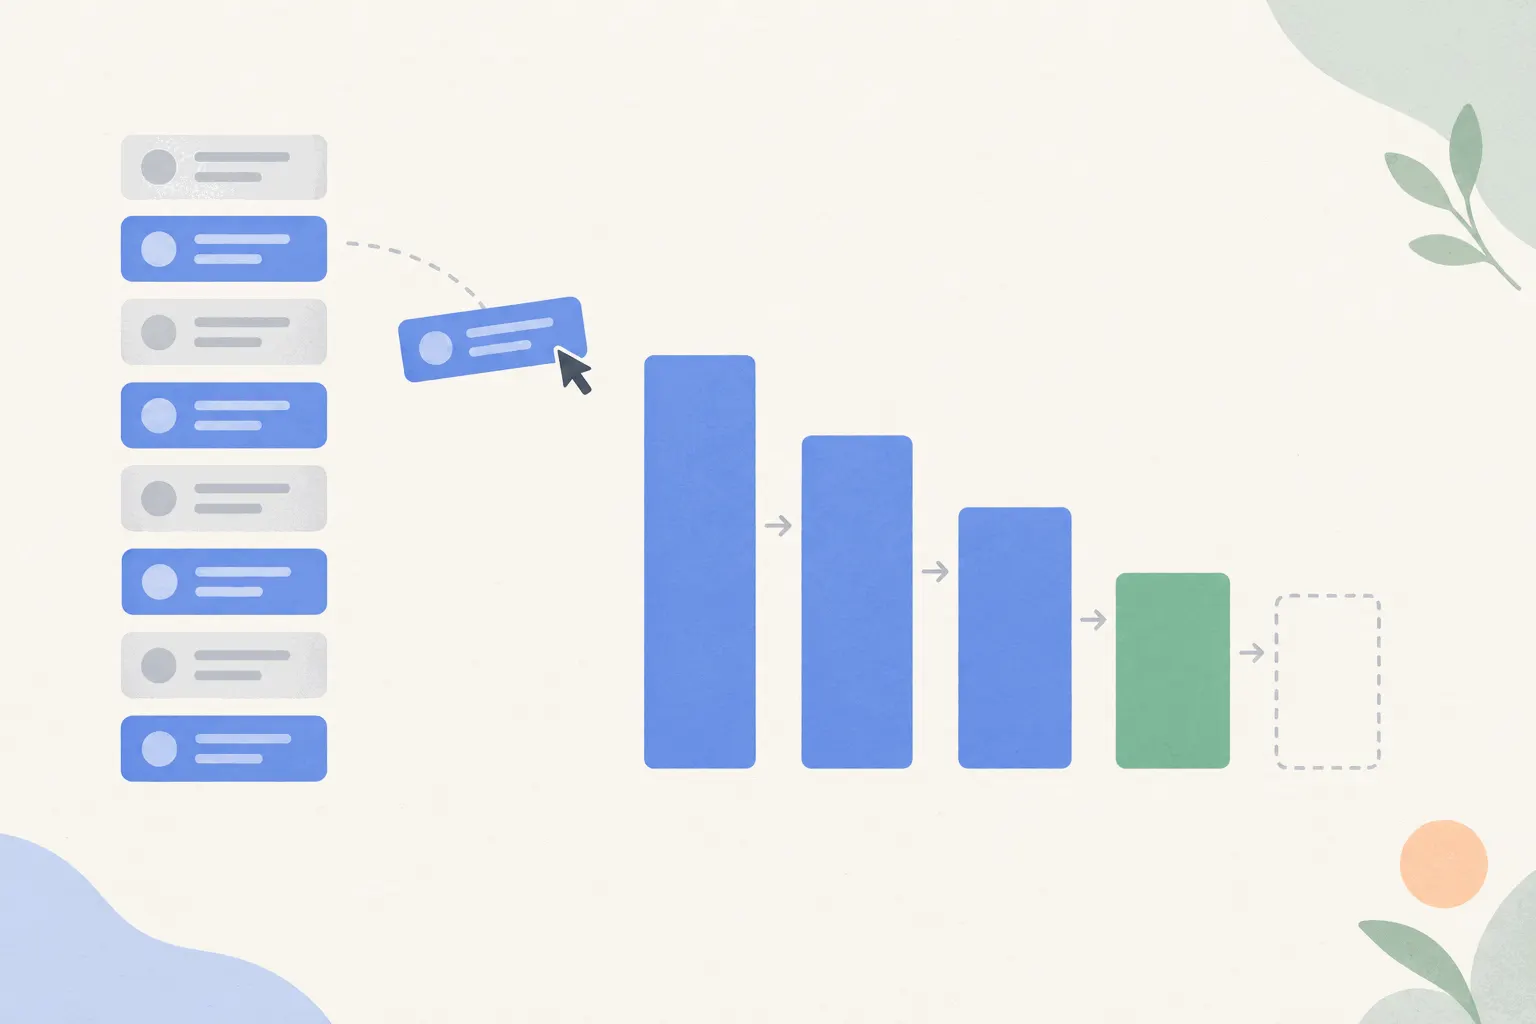
The standard view is the stepped bar chart with a table underneath: users at each step, completion rate to the next step, plus abandonment counts between the pairs. That between-steps number is the whole point of the exercise, and the biggest gap is where your attention should go.
Three features earn their space once the basic funnel works. Show elapsed time adds the average time between steps, which separates a hesitation problem from a navigation problem: thirty seconds between cart and checkout reads very differently from two days. The trended funnel swaps the bars for a line chart of each step over time, useful for spotting whether a release moved a step. And the breakdown dimension splits every step by something like device category, which is often the single most revealing click, because an aggregate funnel can be two very different funnels averaged together.
For digging further, each step offers a next-action view showing the top five things users did after it, and you can lay up to four segments side by side, paid against organic traffic being the classic comparison.
The limits that bite
Three of them, all documented, all regularly discovered the hard way.
Explorations run on event-level data, and event-level data is governed by the retention setting, which on the free tier is two months by default and fourteen months at most. Standard reports are not affected, which is why a property can chart a year of traffic while its funnel exploration comes up short. If you have never touched the setting, your funnels can only see two months back, and raising it only applies to data collected from that point on. Go check it now. It is one admin toggle.
Big properties meet sampling. When a query covers more than ten million events, explorations switch to a sample and flag it with a data-quality icon. Most small and mid-size sites never hit this, but if you do, shorten the date range before trusting fine differences between steps.
And explorations are not reports, so some dimensions and metrics available in reports don't exist here, and filters match case-sensitively where the reports search does not. If a funnel silently shows zero, a mistyped lowercase path in a filter is a common reason.
When a simpler tool is the better fit
Funnel exploration is genuinely capable, and the price is that every funnel is assembled by hand in a workspace that takes some learning. Simpler analytics tools flatten that curve. Bigdelta's funnels accept any URL pattern as a step, so a pageview funnel works from day one with nothing to instrument, show conversion and drop-off between every pair of steps, and let you click a drop-off to open the session recordings behind it, which is the "why" a step table cannot give you. The same trade-off runs through the GA4 tutorial: GA4 gives depth, lighter tools give speed, and plenty of teams keep one of each.
The practical takeaway
Explore, Funnel exploration template, up to ten steps built from events, indirectly-followed-by unless you have a strong reason, and check whether open or closed matches your question before quoting the number. Then fix the retention setting before you need it, because the funnel you want in November is limited by the toggle you left on two months in September. Once the chart exists, its reading is ordinary funnel work: find the biggest leak, segment before concluding, and treat funnel analysis as the companion piece.