How to use Google Analytics 4
GA4 answers most questions a site owner has - once you know its five odd concepts and the six click-paths that reach the numbers. A tour of the tool as it actually is in 2026, including what it hides and where it stops.
Why GA4 feels hard
It's not you. Google Analytics 4 replaced a tool people had used for fifteen years with a different data model, different names for familiar things, and reports that hide numbers the old version led with. The result answers more questions than its predecessor and makes you work harder for the first one. This tutorial assumes GA4 is already installed and takes the shortest honest path: the concepts that make the interface make sense, then the exact clicks to each answer.
Five concepts that unlock the rest
With those five in place, the interface stops being mysterious and starts being merely large.
Most GA4 confusion traces back to one of these:
- Everything is an event. A pageview is an event, a click is an event, a purchase is an event. There are no separate hit types - just events with parameters - which is why every report is ultimately counting events.
- "Key events" are what conversions used to be. Google renamed on-site conversions to key events; the word "conversion" now belongs to the ads side. Older tutorials saying "mark it as a conversion" mean Admin > Key events today.
- The default user number is active users, not everyone. Most reports lead with users who engaged; total users exists but hides in report customization. If GA4 shows fewer "users" than an older tool, this filter is usually why.
- Engagement replaced bounce. A session counts as engaged if it clears roughly ten seconds, a key event, or a second page - and engagement rate is the headline metric. Bounce rate still exists but starts hidden.
- Numbers settle late. Realtime is minutes; everything else processes over 24-48 hours, so yesterday can legitimately change overnight. Judging a day before it's processed is the classic false alarm.
The map: where everything lives
The left rail has four areas. Home is an auto-generated dashboard - fine to ignore. Reports is where you'll live: it opens with a snapshot, holds Realtime, and then splits into two collections - Life cycle (Acquisition, Engagement, Monetization, Retention: what visitors did) and User (Demographics, Tech: who they were). Explore is the build-your-own-analysis workbench for questions the standard reports can't answer. Advertising matters only when Google Ads is in play.
One orientation trick pays for the whole tour: Acquisition answers "where did they come from", Engagement answers "what did they do". Nearly every everyday question is one of those two.
Six questions, six click-paths
Those six paths cover the daily and weekly questions. Everything else in Reports is a variation on them, and Explore exists for the day a question doesn't fit any of it.
The answers a site owner actually looks for, and where they are:
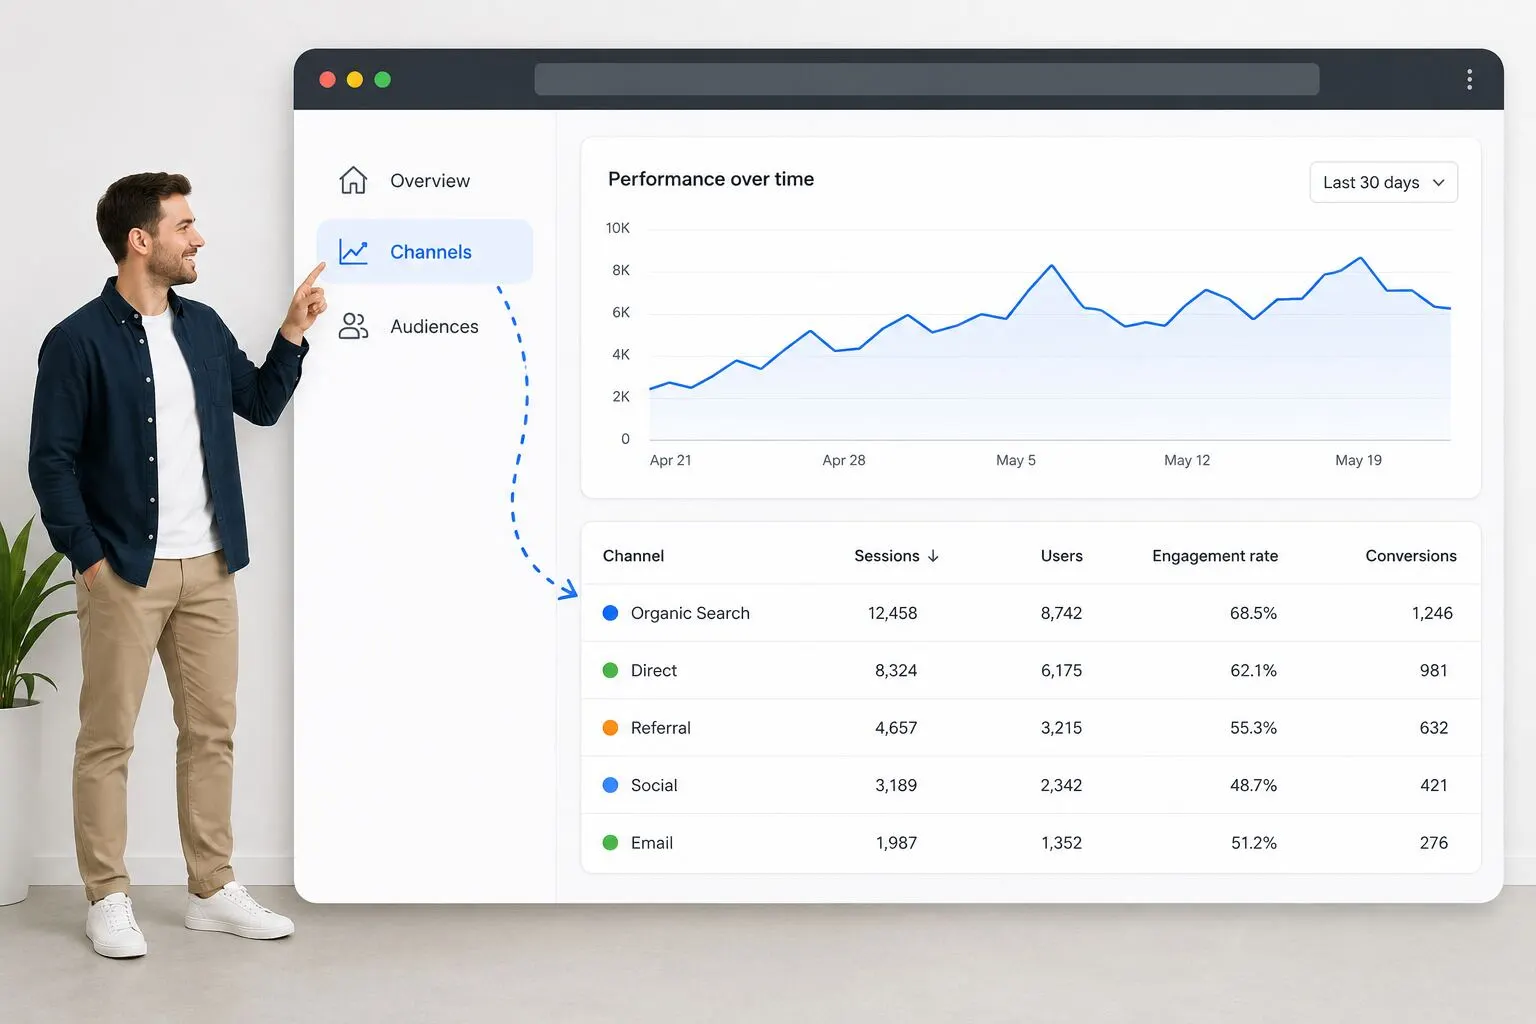
- How much traffic, from where? Reports > Acquisition > Traffic acquisition - the workhorse report, walked through in detail here.
- Which pages do people read? Reports > Engagement > Pages and screens; sort by views, and add other metrics via the pencil if you need them.
- Is anyone converting? Reports > Engagement > Key events - which stays empty until you define key events in Admin, the single most common reason a GA4 setup 'shows nothing'.
- Who's on the site right now? Reports > Realtime - the live view, with its own rules and limits.
- Where are visitors from, on what devices? The User collection: Demographics for country and city, Tech for device, browser and screen size.
- What do people search Google for before arriving? Not in GA4 at all until you link Search Console (Admin > Product links) - and then the two tools' numbers won't match, for documented reasons.
Make the data trustworthy before trusting it
Three defaults quietly degrade a new property. No key events means the conversion half of every report is blank. Unfiltered internal traffic means you and your team inflate every number - define your IPs and activate the filter (Admin > Data streams > Configure tag settings, then Data filters). And the 2-month default on event-level retention means Explorations forget most of your history - raise it to 14 months. All three are five-minute fixes covered in the setup guide; all three only work forward, which is why they're worth doing before the data matters.
What GA4 hides, and where it stops
Some absences are just buried: bounce rate exists but must be added to reports by hand, and total users sits behind the same customization pencil. Some are structural: with Google Signals on, thresholding blanks out small segments; Explorations cap at 14 months of history however long you retain data beyond it; and busy properties can hit sampling in Explore, where GA4 analyzes a subset and extrapolates.
And some things GA4 simply doesn't do. It has no heatmaps, no session replays, and no way to watch an individual struggle with a page - the entire qualitative layer lives in other tools. Knowing where the boundary sits saves hours of hunting for features that aren't there.
Worth knowing in 2026
Two recent changes deserve a mention. GA4 now classifies visits from AI assistants - ChatGPT, Gemini and the like - into their own channel, so that traffic is visible instead of hiding in referrals. And key events gained configurable lookback windows, useful mainly if you compare attribution across tools. Google ships changes continuously; when a screenshot in any tutorial doesn't match your screen, the release notes usually explain what moved.
The practical takeaway
Learn the five concepts, bookmark Traffic acquisition and Pages and screens, define your key events, and let the rest of the interface stay unexplored until a real question drags you in - that's how people who use GA4 well actually use it. And if you notice the tool costs you more attention than the answers are worth, that's a real signal too: GA4 is built to be everything for everyone, and simpler analytics exists precisely for sites whose questions fit on one screen.