How to check website traffic in Google Analytics
Where the traffic numbers actually live in GA4 - the one report that answers most questions, what the metrics mean, and the delays and gaps to know about before you trust the numbers.
Where to look first
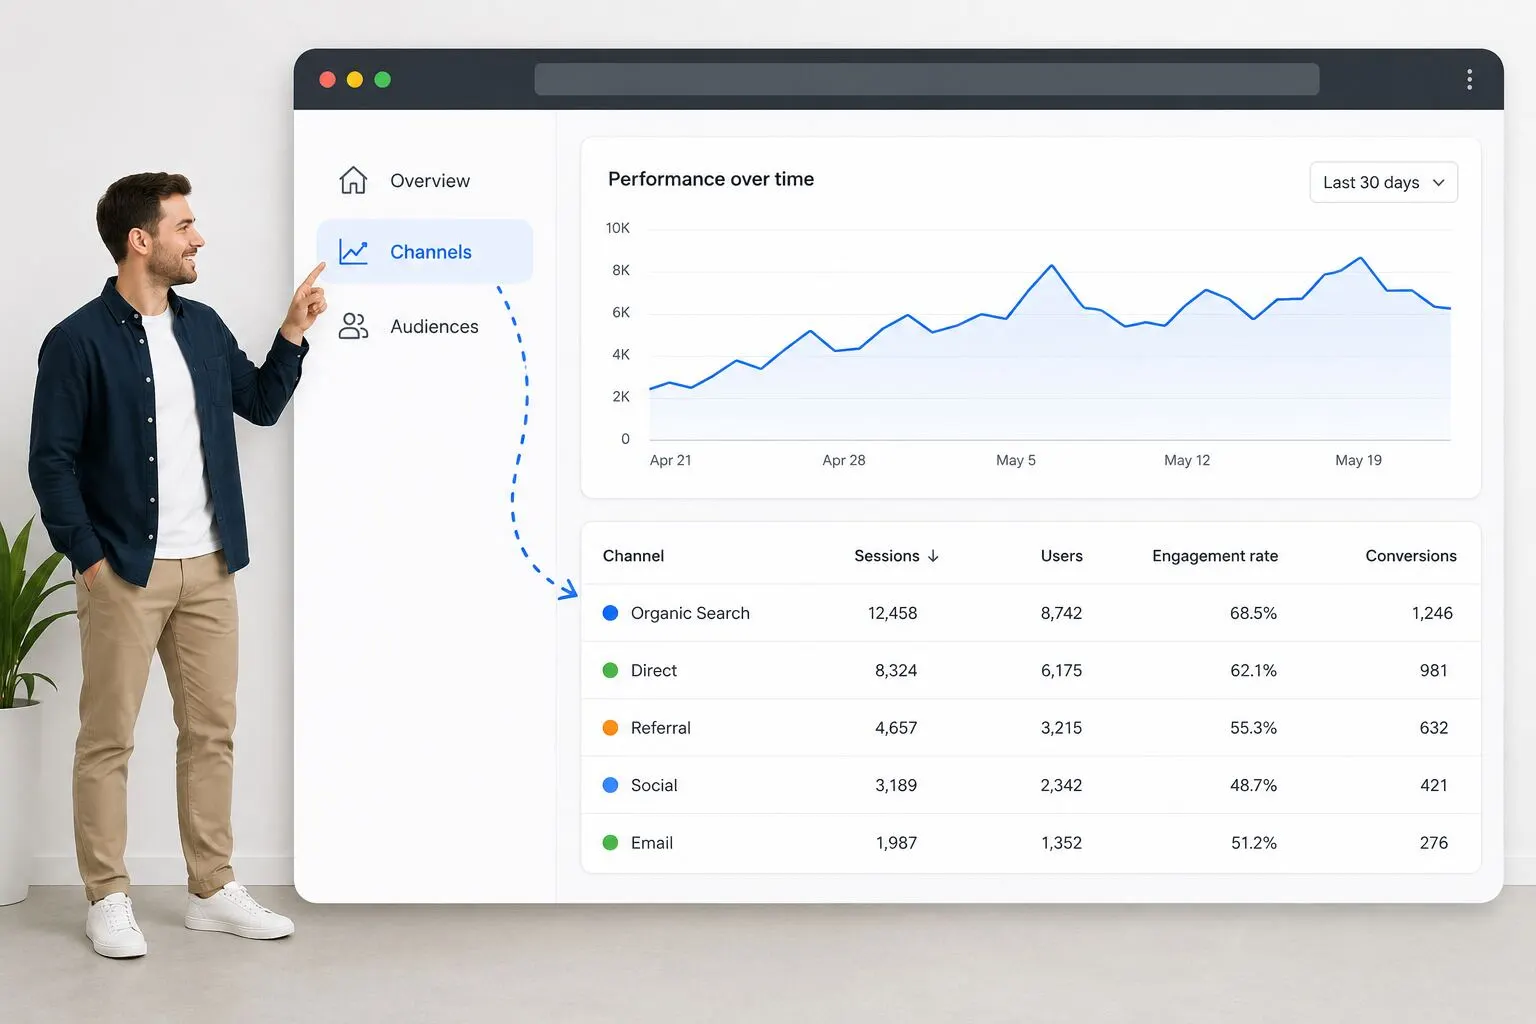
Google Analytics opens on a Home page of summary cards, which is fine for a glance and useless for a question. The traffic numbers live one level down: in the left menu, open Reports, then Acquisition, then Traffic acquisition. That single report - sessions, broken down by where they came from - answers most versions of "how much traffic do I get?". For what's happening on the site right now, Reports → Realtime shows the last 30 minutes instead.
Everything in this post describes GA4, because that's the only Google Analytics there is: Universal Analytics stopped processing data on July 1, 2023, and Google deleted its remaining data a year later. Guides that mention "Audience Overview" or "bounce rate" screenshots with orange charts are describing the dead product.
The report that answers most questions
Traffic acquisition shows sessions grouped by default channel - Organic Search, Direct, Referral, Organic Social, Paid Search and the rest - with engagement rate, engagement time and event counts alongside. Change the date range in the top-right corner, and use its search box to filter for one channel or source.
GA4 has a confusingly similar sibling report, User acquisition, and the difference matters. User acquisition credits everything to the source that brought a user the first time; Traffic acquisition credits each session to the source that started it. Google's own example: someone finds you through Google search, then comes back directly ten times. User acquisition shows Google 11, direct 0; Traffic acquisition shows Google 1, direct 10. Neither is wrong - one asks "where do my people originally come from", the other "what starts my visits". For day-to-day traffic checking, Traffic acquisition is the one you want.
What the metrics actually mean
GA4 counts "users" three ways, and the reports don't always say which one you're looking at. Total users is everyone who triggered any event in the range. Active users - the number most GA4 reports lead with - counts people who engaged (a session of ten seconds or more, or a conversion-style event) plus first-time visitors, who qualify automatically. New users is first visits only. If your user count looks lower than an older tool's, this filtering is usually why.
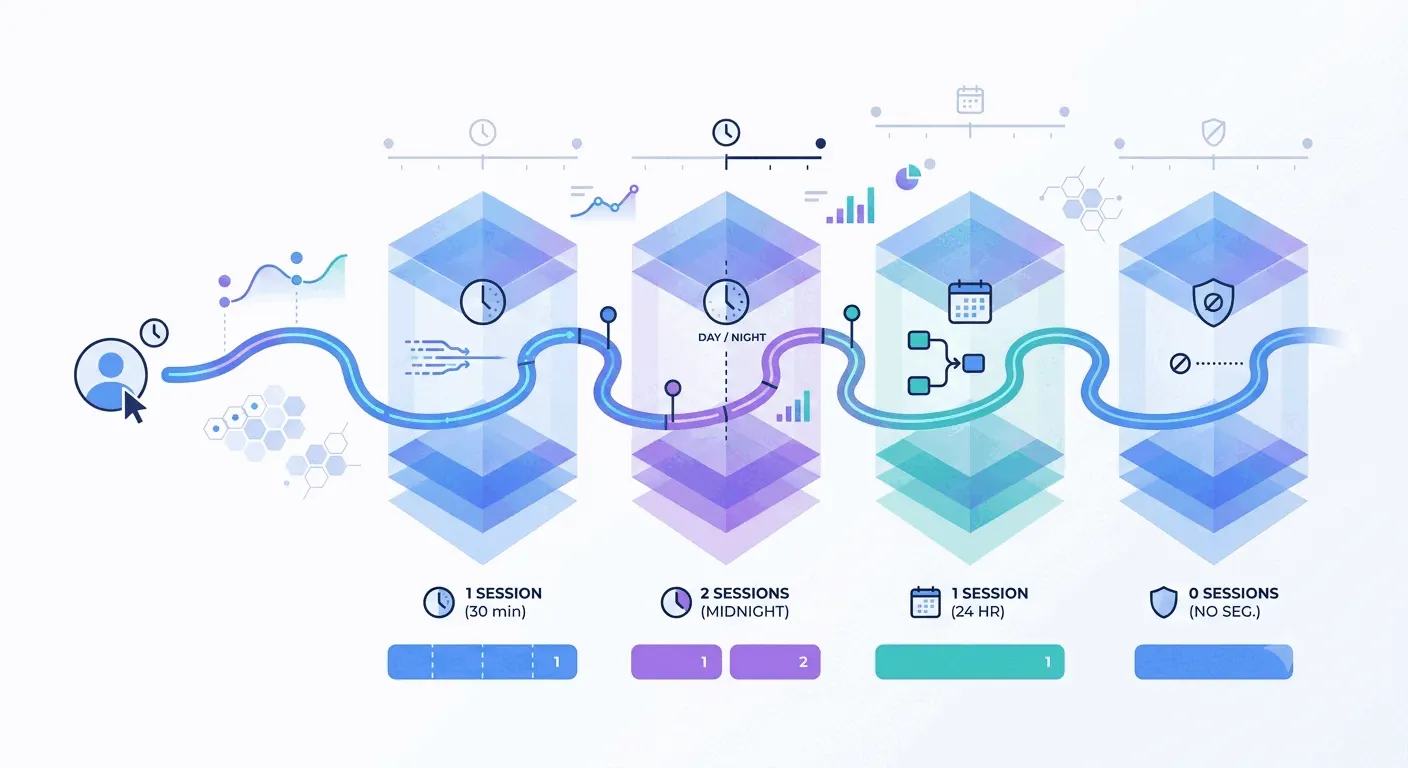
Sessions are visits: a session starts when someone arrives and ends after 30 minutes of inactivity, with more edge cases than you'd expect. Views (in Engagement → Pages and screens) are pageviews - the biggest, most flattering number, counted every time any page loads. The difference between visitors, visits and pageviews trips up almost everyone comparing numbers across tools.
Checking traffic to a specific page
Reports → Engagement → Pages and screens lists every page with its views and active users. Search for the page path to isolate one page, or sort by views to see what carries the site. For which pages visitors arrive on - a different question - use Engagement → Landing page, which starts each session at its first page.
Comparing this month against last
The date picker has a Compare toggle that overlays a second period on every chart in the report. Use it with care: February against March compares 28 days against 31, and a month heavy in weekends against one that isn't. Same-period-last-year is the honest comparison for seasonal sites. Analyzing traffic properly is its own discipline; the Compare button is just the door in.
The gotchas nobody warns you about
One more gap sits outside Google's control: ad blockers and private browsers stop the GA script from loading at all, so a slice of your real visitors never appears in any report. GA4's numbers are a good sample, not a census.
Five GA4 behaviors that make traffic numbers look broken when they aren't:
- Data is late by design. Today's numbers take 2–6 hours to appear, a full day settles in about 12, and reports can keep shifting for 24–48 hours after collection. Yesterday looking low at breakfast means processing, not disaster.
- "(not set)" rows appear when a dimension has no value - most often missing UTM parameters on campaign links, or a misfiring tag.
- Demographic breakdowns vanish on small date ranges. GA4 withholds rows below privacy thresholds; widen the range and they often come back.
- Explorations sample. Past 10 million events, the freeform analysis tools switch to estimates - standard reports don't.
- Event-level data is deleted after 2 months by default. Admin → Data retention lets you extend it to 14 - do this on day one; it can't recover what's already gone. Standard aggregate reports aren't affected.
If GA4 feels like more than you need
It usually is. GA4 is built for teams running ad campaigns across properties, and checking simple traffic in it means walking past a lot of machinery. If your questions are "how many visits, from where, to which pages", a lightweight analytics tool answers them on one screen - and there are several ways to check traffic without Google Analytics at all. For estimating traffic to a site you don't own, GA can't help; that's a different job with different tools.
The practical takeaway
Bookmark Reports → Acquisition → Traffic acquisition and Reports → Engagement → Pages and screens - between them they cover sessions, sources and page-level traffic, which is most of what anyone means by "checking traffic". Read Active users knowing it's the engaged subset, give today's data six hours before believing it, and extend the retention setting before you need what it deletes.