What is website behavior analytics?
The analytics layer that watches what visitors do on the page - heatmaps, replays, funnels, frustration signals - rather than counting how many arrived. What it covers, and what the security industry means by the same phrase.
Two industries share this term
"User behavior analytics" means two unrelated things. In cybersecurity it's UEBA - software that models employee account activity to catch insider threats and compromised credentials, the thing Microsoft and CrowdStrike sell to security teams. On the web it means understanding how visitors use your site. Search the bare phrase and you'll mostly find the security kind; this post is about the website kind.
Behavior analytics vs your traffic numbers
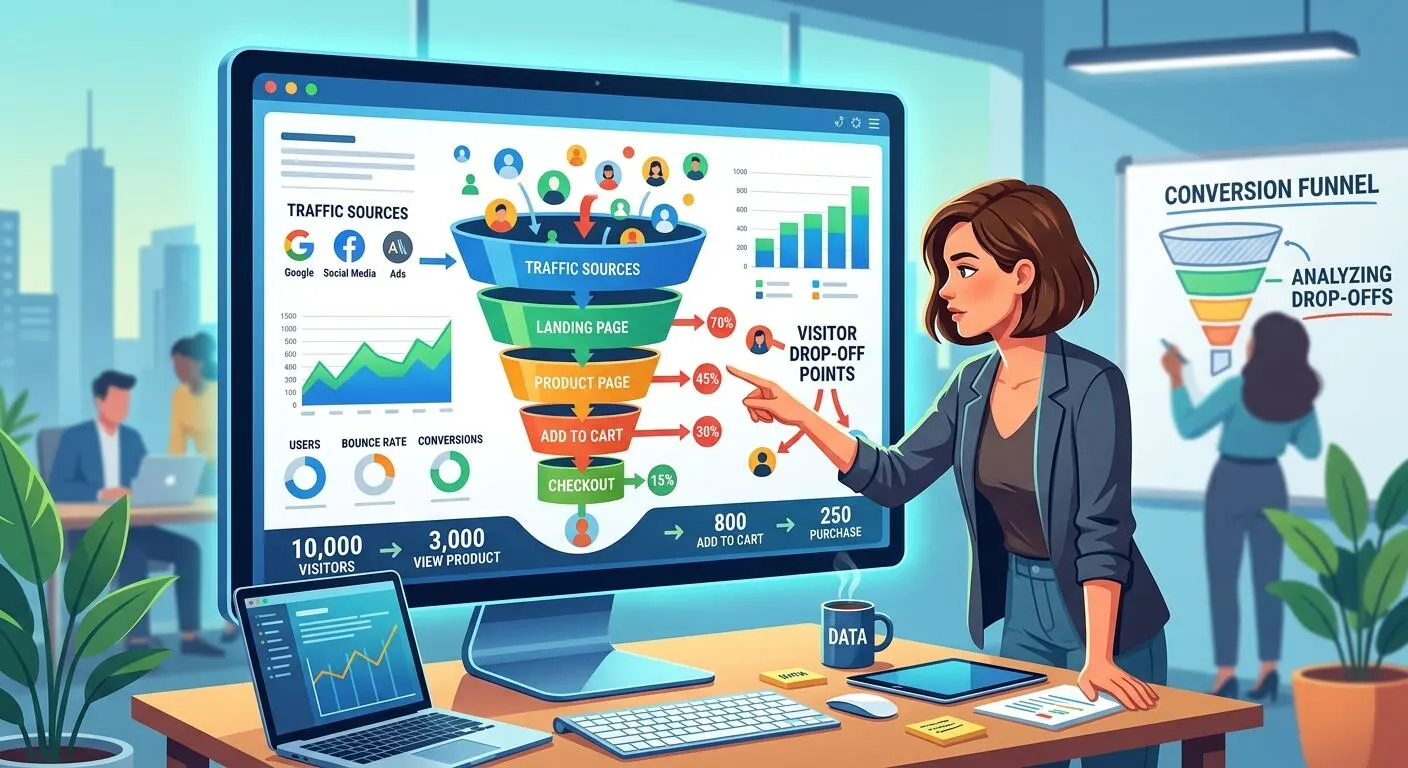
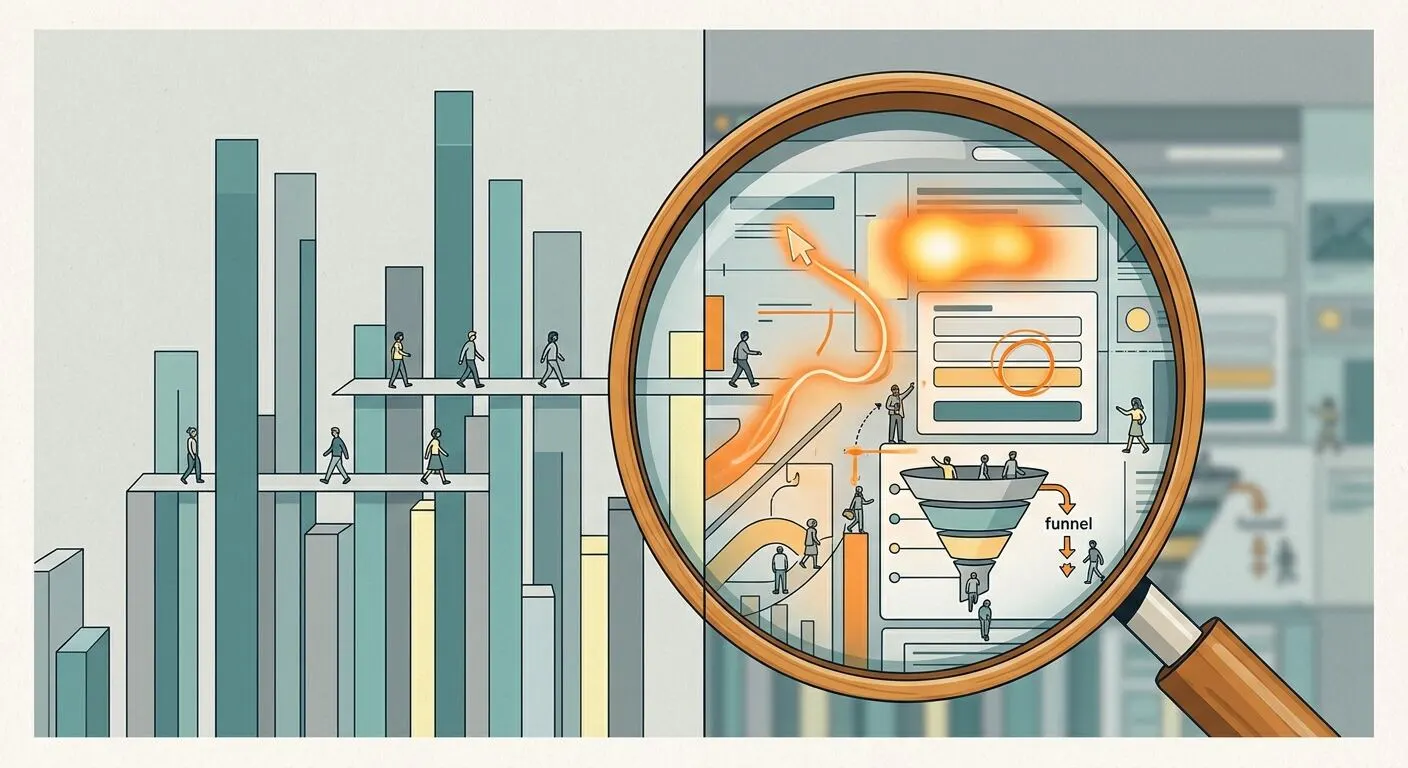
Web analytics counts arrivals: sessions, pageviews, sources, bounce rates. Behavior analytics records what happens between arriving and leaving - where clicks land, how far the page scrolls, the order fields get filled in, the moment a visitor gives up. The two answer different halves of the same question: your traffic numbers say 10% of checkouts finish, behavior data says which step loses people and what they did right before leaving.
That's also why behavior tools arrived as a separate category. Counting needs one beacon per pageview; recording interaction detail means capturing clicks, scrolls and mouse movement continuously, which is a different data problem with different privacy stakes.
The toolkit
Behavior analytics in practice is a small set of instruments, each with its own post here:
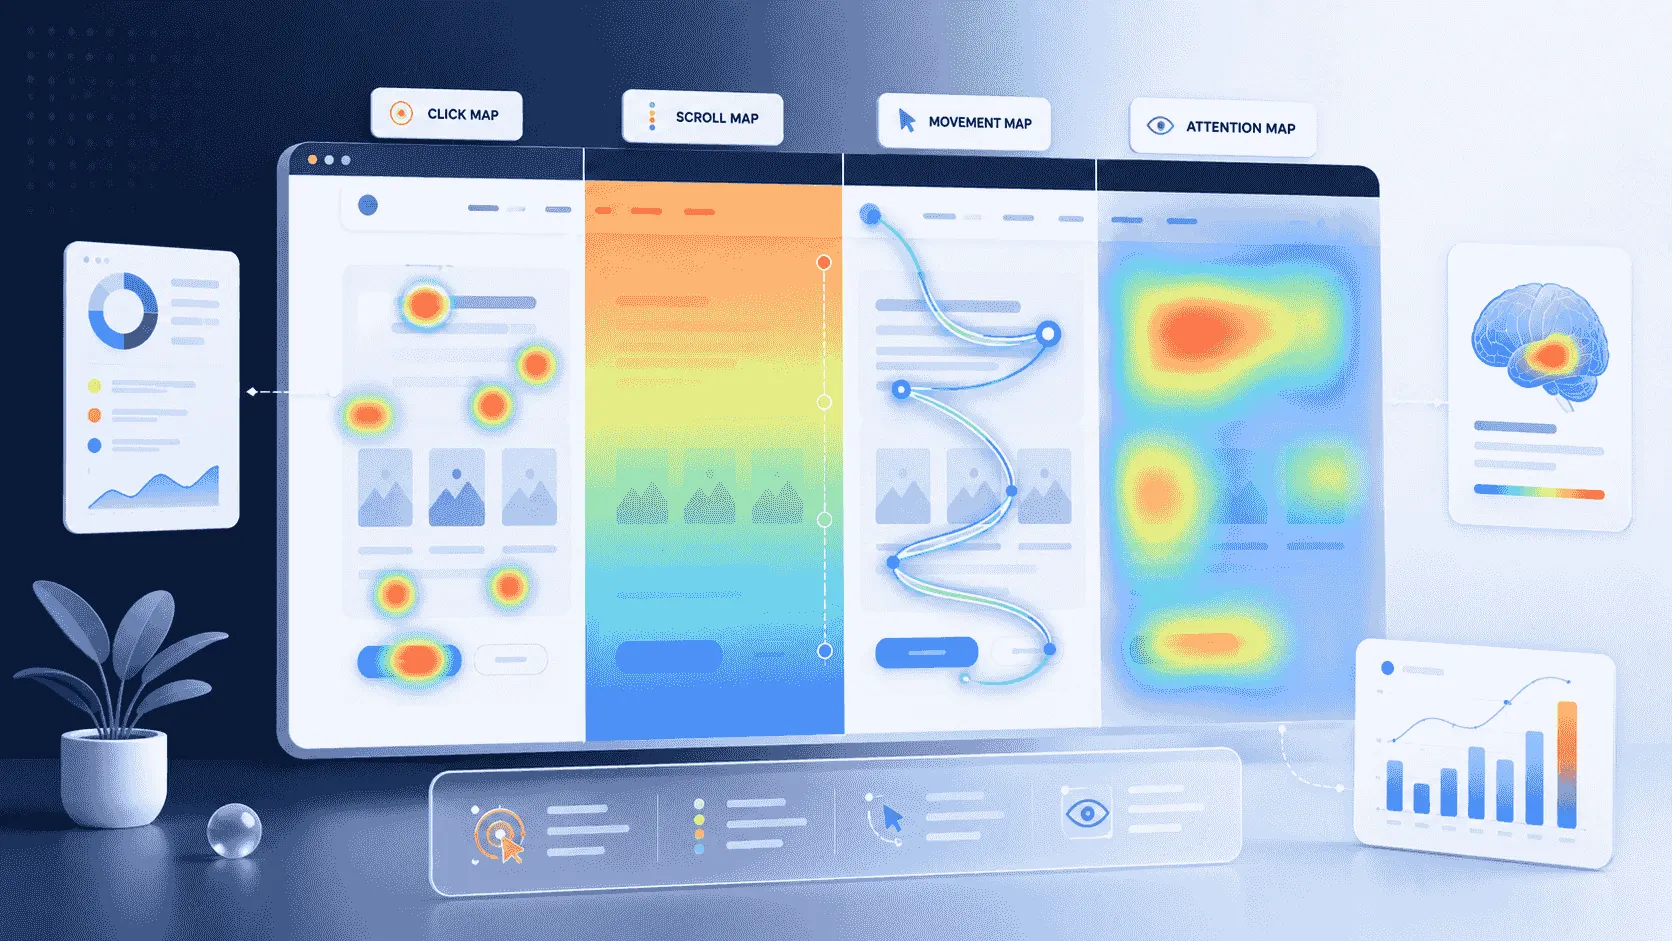
- Heatmaps - clicks, scroll depth and attention aggregated across all visitors of a page into one picture. The four types have their own explainer.
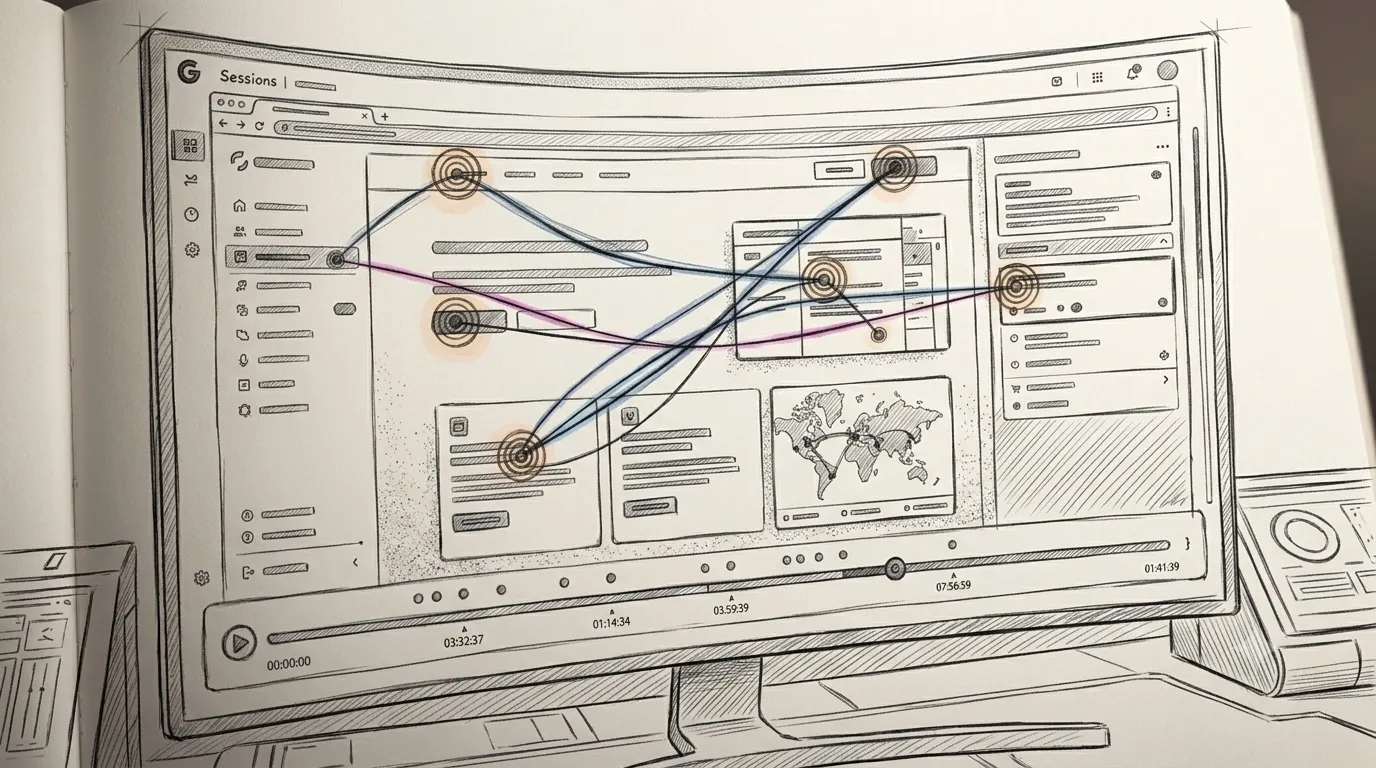
- Session replay - a reconstruction of one visitor's visit, for watching exactly how something went wrong.
- Funnels - step-by-step drop-off through a signup or checkout flow, locating where people quit.
- Event tracking - named actions you choose to measure: button clicks, video plays, downloads.
- Form analytics - which field stalls people and where they abandon.
- Scroll depth - how far down the page reading actually gets.
Frustration signals
The behavior category's distinctive contribution is automated frustration detection. Tools flag rage clicks (rapid repeated clicking on an unresponsive element), dead clicks (clicks that change nothing), error clicks (a click followed by a JavaScript error) and, in Fullstory's documented set, the thrashed cursor - a mouse moved erratically by a confused or waiting visitor. Exact thresholds vary by vendor and mostly aren't published, so treat the flags as pointers rather than comparable metrics.
Their value is triage. Nobody watches a thousand replays; a list of sessions flagged for rage clicks on the checkout button is a short queue worth an afternoon.
What it looks like in practice
Take the best-studied behavior problem on the web: about seven in ten online shopping carts get abandoned before purchase. Baymard Institute's research attributes the biggest share of avoidable abandonment to costs that appear late - shipping and taxes surfacing at the final step. That finding is behavior analytics in miniature: the traffic number (checkout conversion) flagged a problem, and interaction-level evidence located the cause.
On your own site the loop is the same at smaller scale. A funnel narrows the problem to a step, the heatmap or replay shows what visitors do at that step, you change the page, and the funnel says whether it worked.
The privacy side
Behavior data carries heavier privacy obligations than pageview counting, session replay most of all - it records individual visits, which is why regulators treat it separately. France's CNIL has a draft recommendation specifically on session replay, and consent plus input masking are the working baseline; the practical checklist has its own post, and the US litigation angle its own as well. Aggregated heatmaps sit at the milder end: coordinates and elements rather than individual recordings.
The practical takeaway
Behavior analytics is the why-layer on top of your visitor counts: heatmaps and funnels for the aggregate picture, replays and frustration signals for the individual one. In Bigdelta the layer ships with the analytics - heatmaps, replays and funnels run off the same script as the visitor counting, filtered by the same segments. Wherever you get it, start with one page and one number that bothers you, and let the behavior data explain that number before you collect any more. Turning this data into a design routine, with the metrics to baseline, is covered in what UX analytics is.