Does Google Analytics have heatmaps?
No - GA4 ships no heatmap, and Google retired its last click-overlay years ago. What GA4's own events can approximate, and how sites actually get heatmaps alongside it.
The short answer
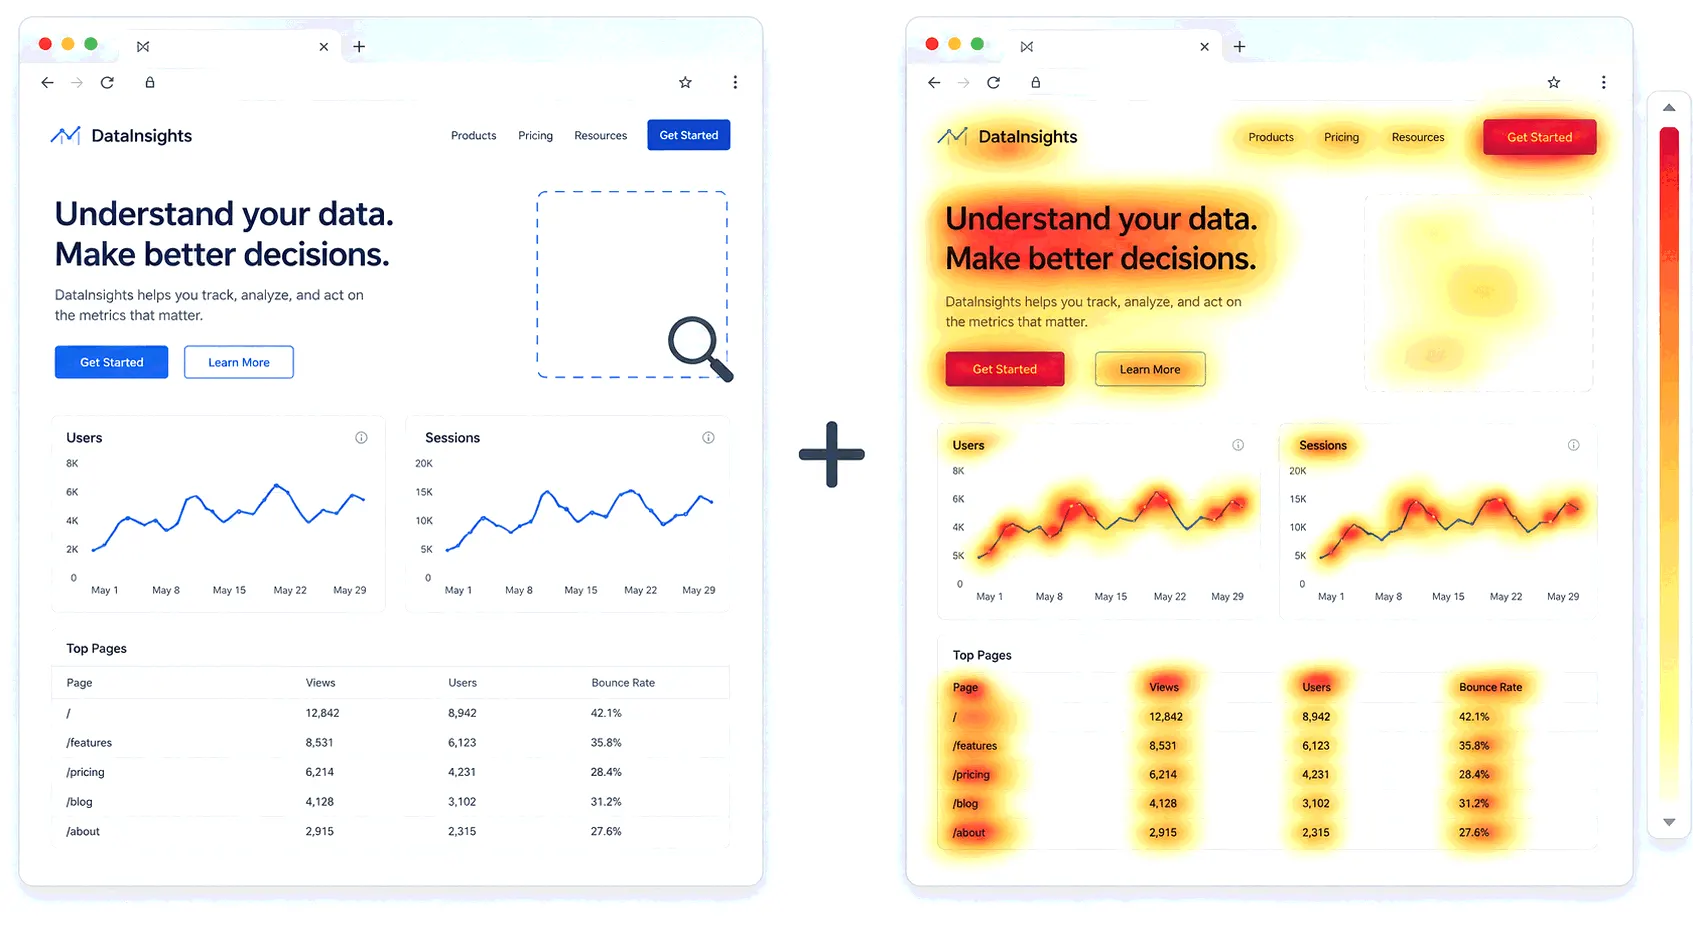
No. Google Analytics 4 has no heatmap feature - no click overlay, no scroll map, nothing that paints visitor behavior onto a picture of your page. Its reports are tables and charts, and Google has announced nothing that would change that. If you want the colored overlay that shows where visitors click and how far they scroll, it comes from a second tool running alongside GA4.
That's the whole answer; the rest of this post is what happened to the heatmap-ish things Google used to offer, how close GA4 can get on its own, and what to actually use.
Google used to have one, sort of
Universal Analytics had In-Page Analytics - click percentages overlaid on a live view of your page - and later a "Page Analytics" Chrome extension that did the same job. Google deprecated both back in 2017 and never rebuilt them for GA4; Universal Analytics itself stopped processing data on July 1, 2023, and its stored data was deleted the following year. So the last Google-made click overlay died two product generations ago.
A caution for anyone searching the Chrome Web Store: extensions named "Page Analytics" still exist there, some rebuilt for GA4 with good ratings. They're third-party tools trading on the old name, not Google's - judge them as you would any extension you're granting access to your analytics account.
How close can GA4 get on its own?
Closer than nothing, far from a heatmap. With enhanced measurement on, GA4 records a scroll event when a visitor reaches 90% of the page - one line, finishers only, nothing about where the audience thinned out along the way. Real scroll tracking through Tag Manager improves on that with thresholds of your choosing. Clicks are thinner still: GA4 captures them automatically only when they leave your site or download a file, so the button, menu and image clicks a heatmap lives on are simply not in the data.
The determined can push further - define custom click events, export the raw data to BigQuery through GA4's free export, aggregate by element. What comes out is a table of click counts, built with engineering time plus query costs, and still missing the picture-of-the-page rendering that makes a heatmap readable at a glance. It's a fine project for a data team with a specific question; as a route to heatmaps it's rebuilding, expensively, what the dedicated tools ship on day one.
What sites actually run alongside GA4
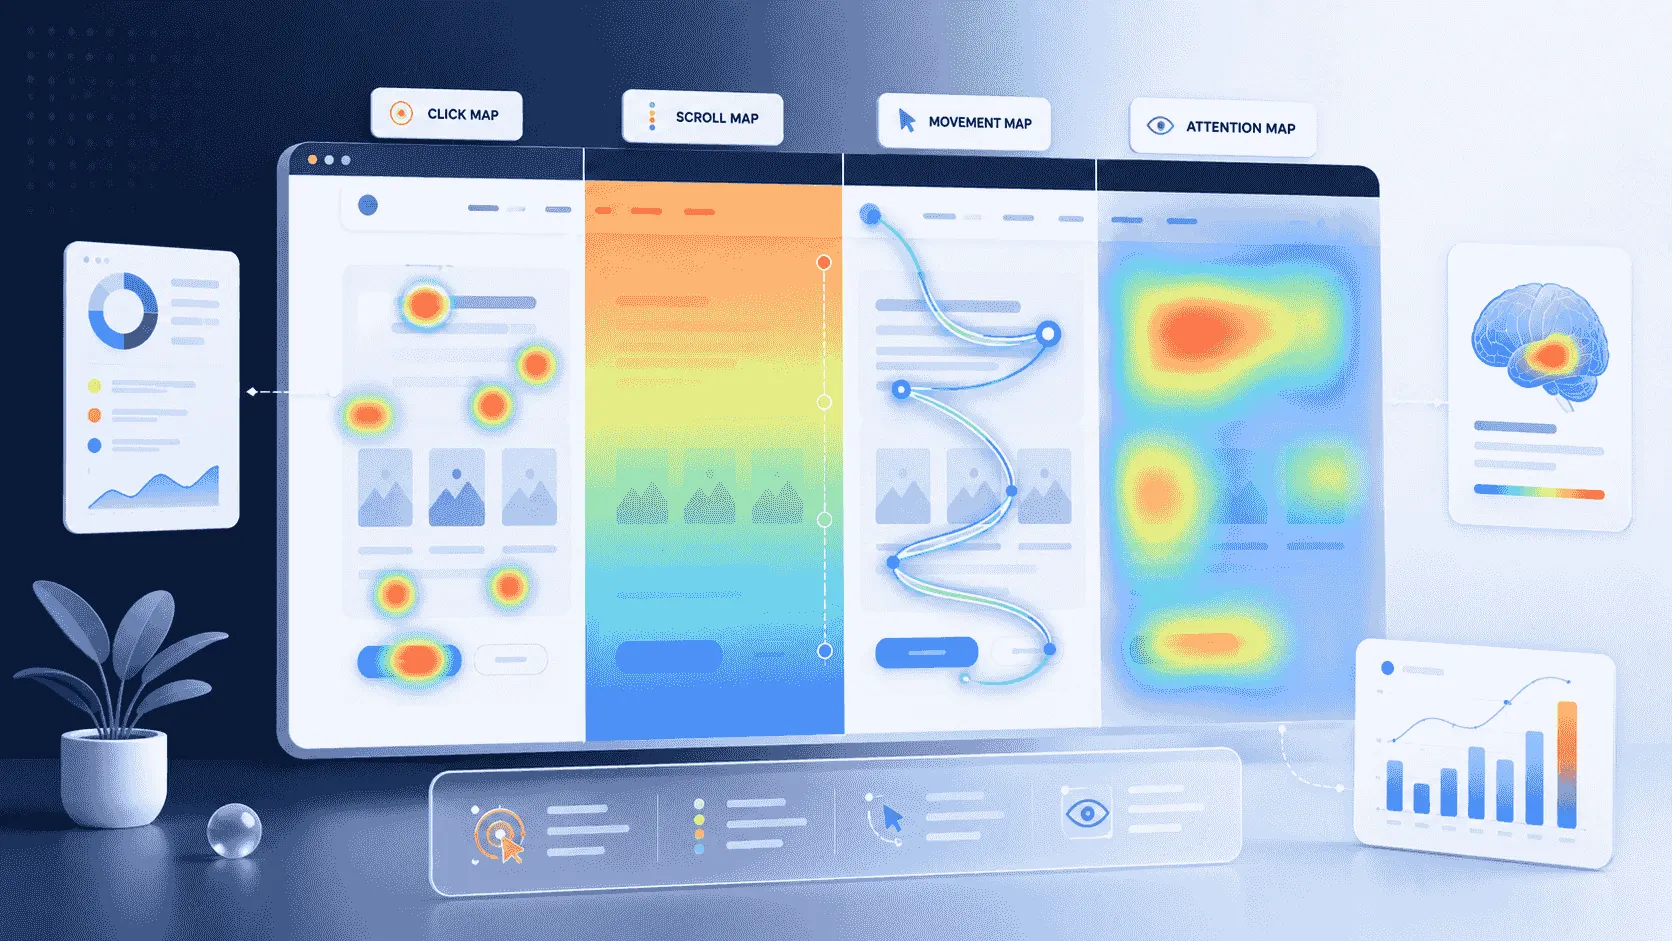
A heatmap tool, of which there are plenty - this is one of the most crowded corners of analytics. Microsoft Clarity is the free giant, with click and scroll maps and an official GA4 integration documented by Microsoft. Hotjar effectively defined the category, and its alternatives fill several tiers of pricing. Bigdelta's heatmaps sit inside its analytics rather than beside them: click, scroll, attention and move maps, built per device, filterable by page and traffic source, updating continuously as visits arrive - so the "what happened" numbers and the "where on the page" picture come from the same tool instead of two.
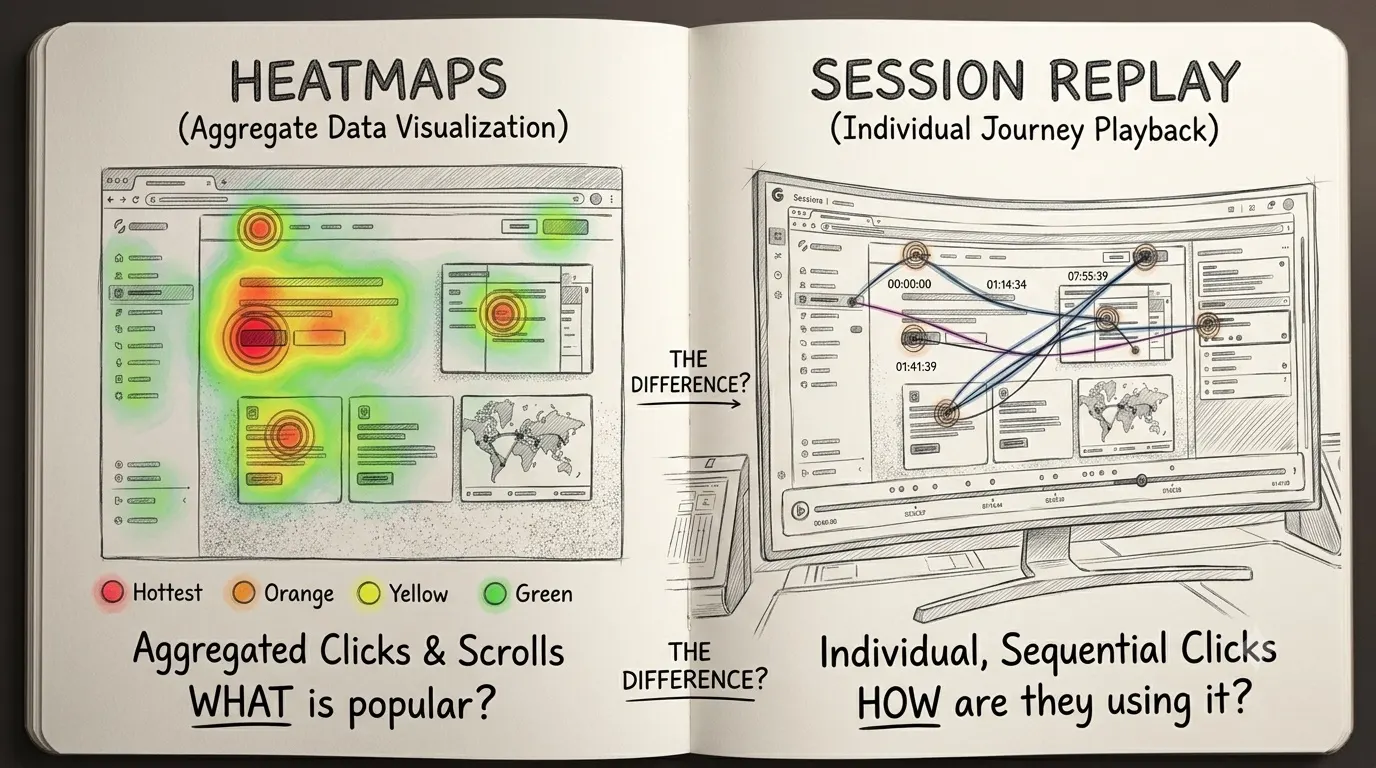
Whichever you pick, the pairing logic is the same: GA4 (or any counting tool) tells you which pages gain and lose visitors; the heatmap tells you what those visitors do once they're on the page. If you're weighing heatmaps against watching individual visits instead, that comparison has its own post.
The practical takeaway
Stop looking for the heatmap button in GA4 - it isn't there and never was. Keep GA4 for counting if it's serving you, add a heatmap tool for the seeing, and start with the one page your business depends on: a week of click and scroll data on a pricing or signup page usually pays for the setup time by itself.