What is conversion analytics?
Conversion analytics measures whether visits turn into signups, purchases and enquiries. What the core numbers mean, how the data is collected, and the undercounting to expect.
What conversion analytics means
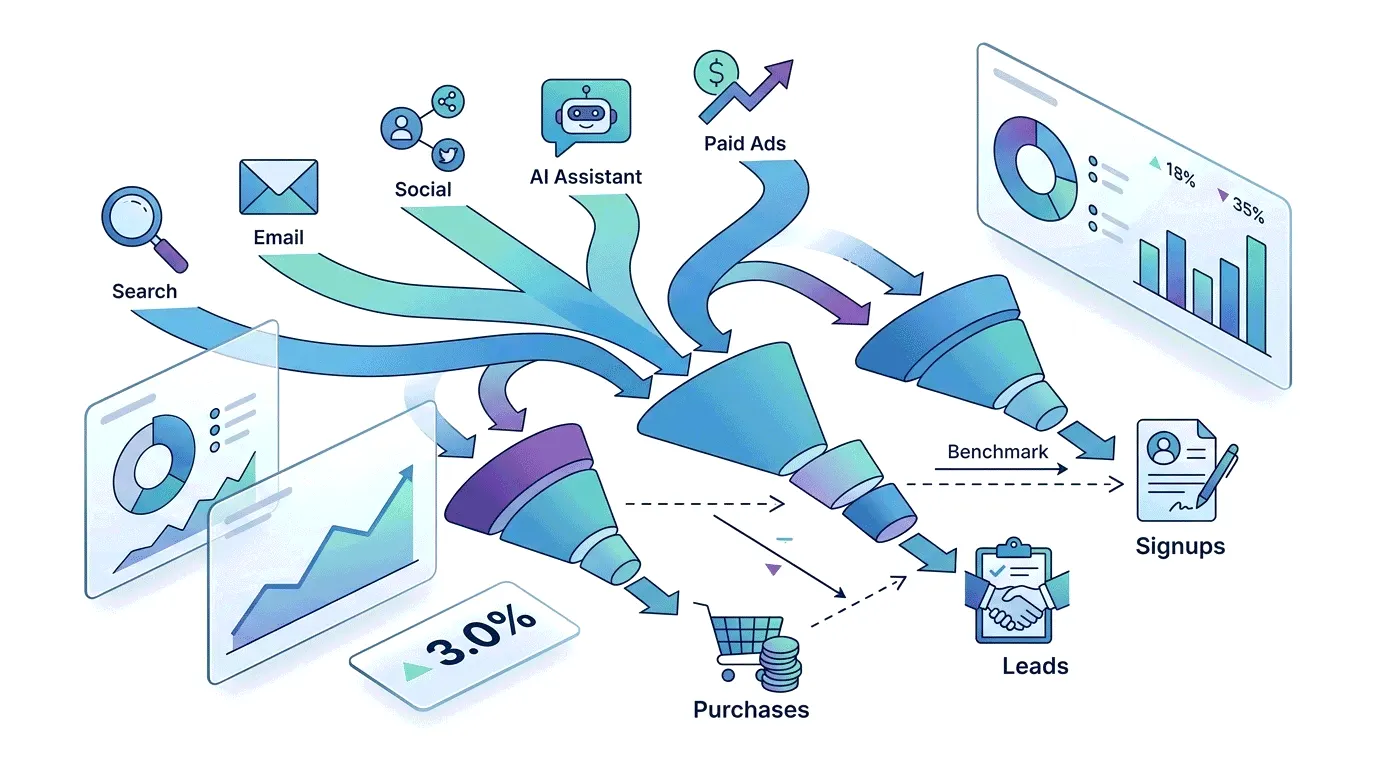
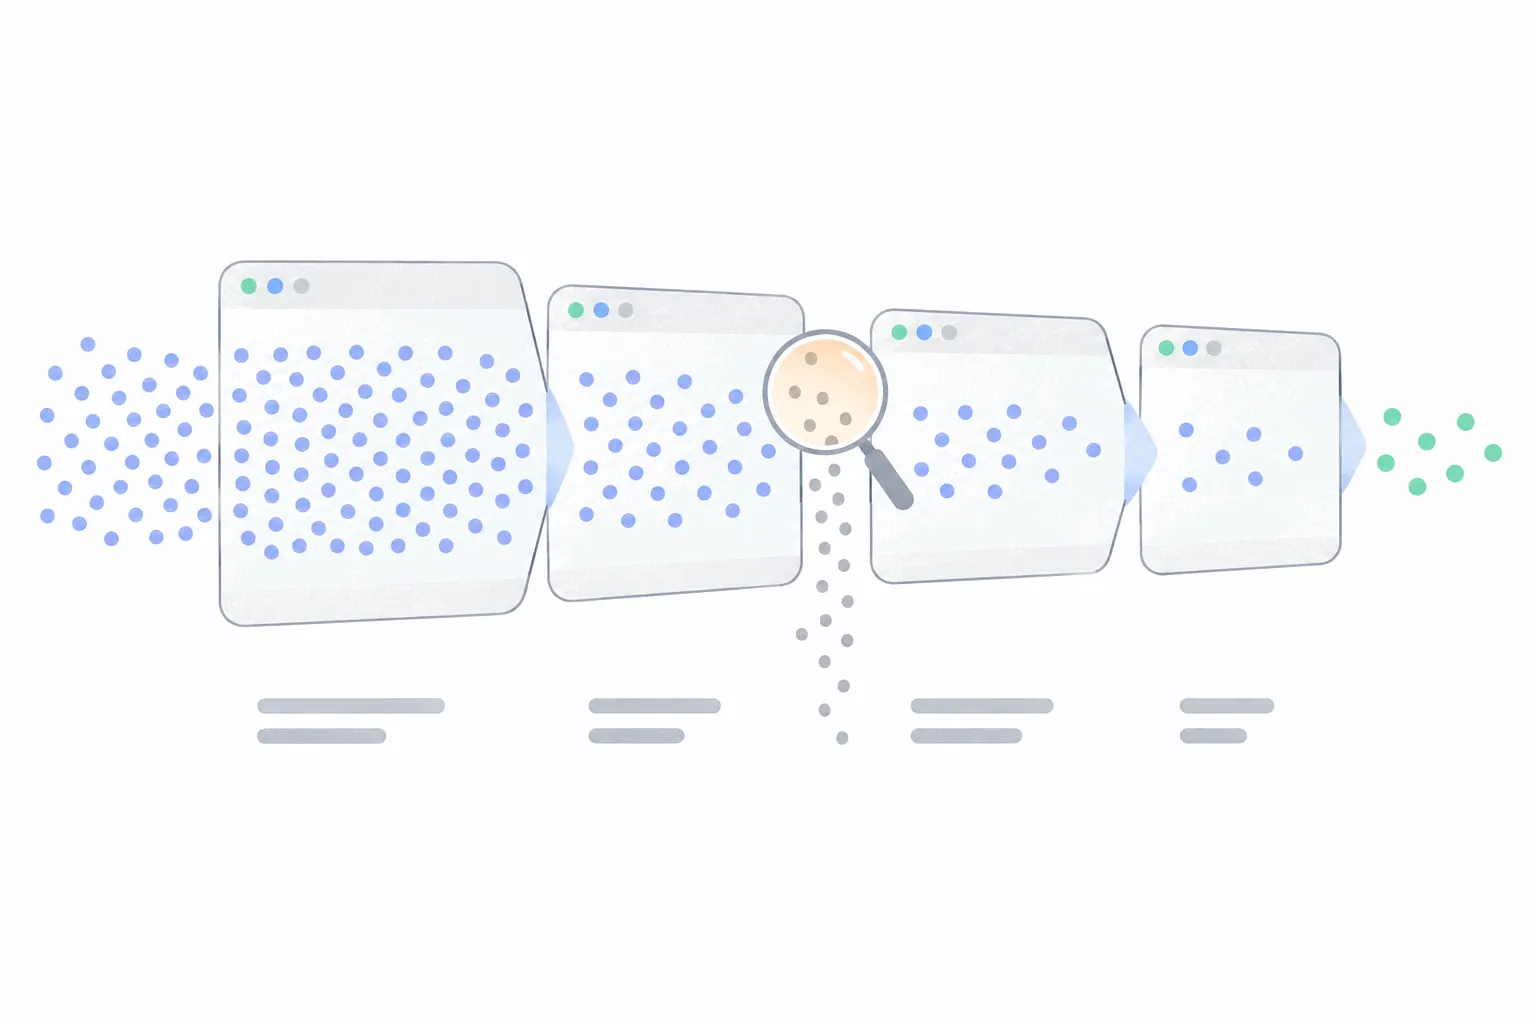
Conversion analytics is the part of web analytics that measures whether visits end in the actions a site exists to produce. Traffic analytics counts arrivals: how many people came, from where, and to which pages. Conversion analytics picks up where that stops and asks how many of those visits became a customer, a subscriber or a lead, and which ones.
The two can move in opposite directions, which is why the distinction earns its own name. A blog post can double a site's traffic while the new readers buy nothing, and a price change can leave traffic flat while sales climb by half. A site that only watches arrivals cannot tell those weeks apart. What web analytics covers as a whole is the wider map, and this post is about the conversion corner of it.
What counts as a conversion
A conversion is whatever action the site exists to produce. On a store it is a completed purchase. On a SaaS site it is a signup or a booked demo. On a service or local business site it is a submitted contact form or a phone call. On a content site it is usually a newsletter signup, since that is the moment a passing reader becomes an audience.
Most sites also track a few smaller actions on the way to the main one: an add to cart, a pricing page view, a started trial. These supporting conversions are useful for diagnosis, and they belong one rung below the main number in any report. When everything is called a conversion, the word stops meaning anything, so decide which single action is the business and hold that line.
The core numbers
The first number is the count: how many conversions happened in the period. It is the number the business feels, and for a store it comes with revenue attached, so revenue per conversion and total revenue sit next to it.
The second is the conversion rate, and it hides a choice. Divide conversions by visits and you get the share of visits that included the action, so out of every hundred sessions, how many converted. Divide by visitors instead and you get the share of people who converted, counting each person once however often they came back. The second number runs higher, because one buyer often took three visits to decide.
Google Analytics keeps both and names the base in each: session key event rate and user key event rate, key event being its current word for a conversion it reports on. Whichever tool you use, check which base a rate is built on before comparing it with anything, and name the base when you report it.
One counting rule differs by tool and by conversion type. Some tools count a conversion once per visit however many times the event fires, others count every occurrence. For a lead form, once per visit is usually right, since three submits from one person are one lead. For purchases, every occurrence is right, since two orders are two orders. Check the setting rather than assuming it.
Where the data comes from
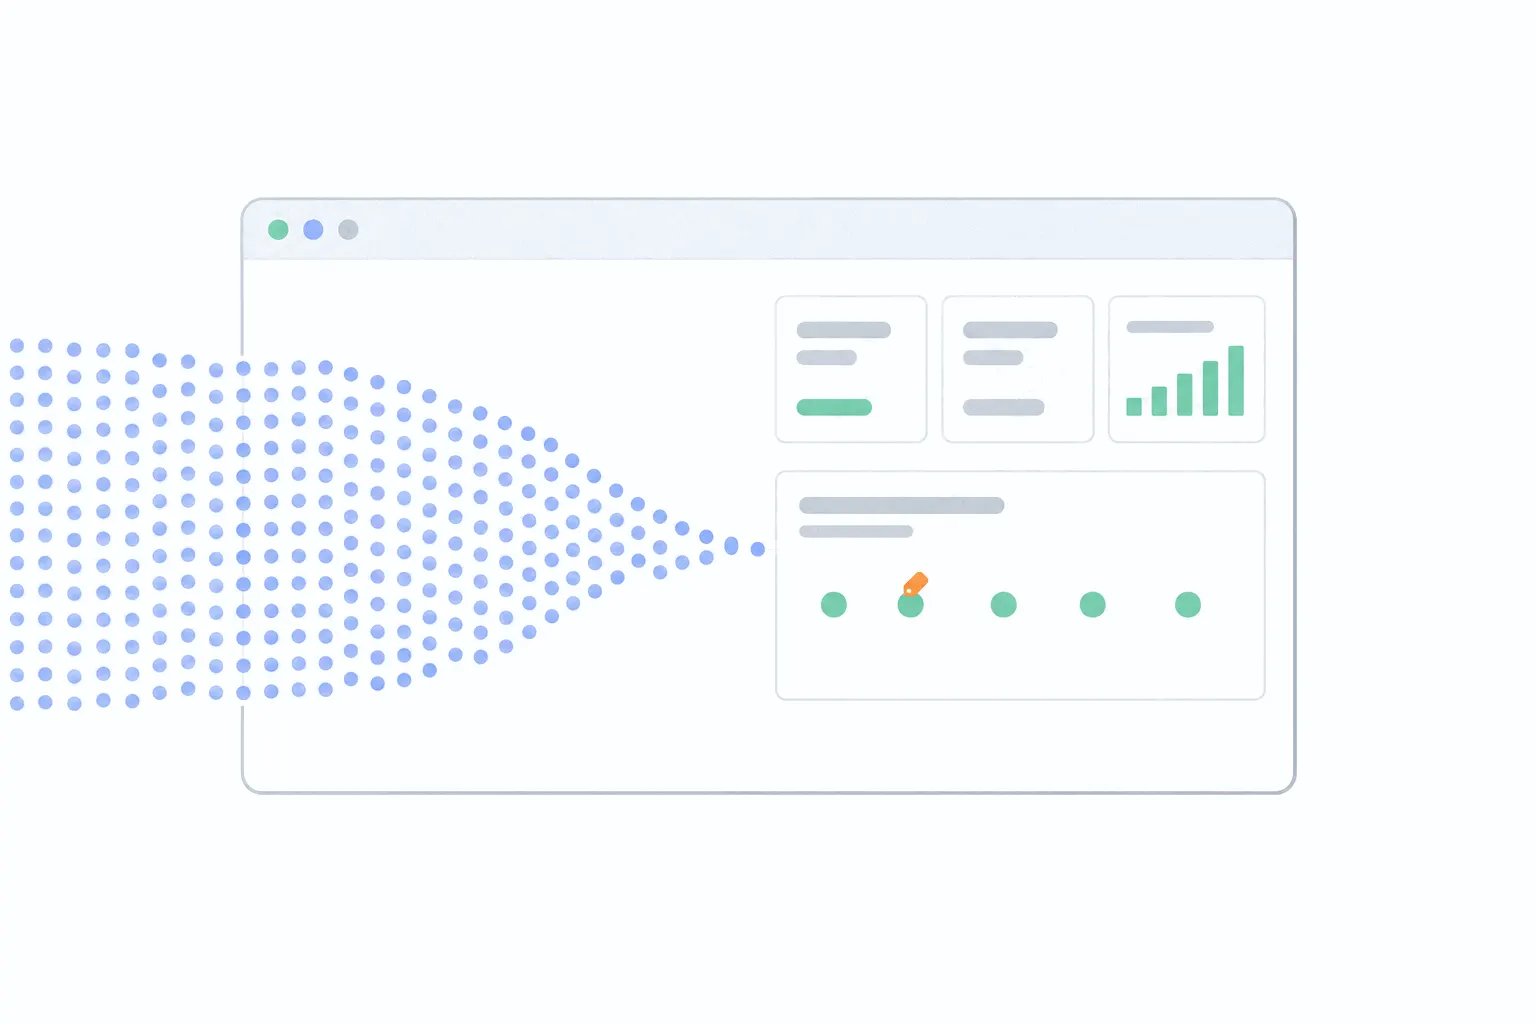
Nothing is a conversion until someone defines it. Analytics tools record pageviews on their own, but a conversion is a meaning laid on top: this event, a form submit or a purchase or a signup click, is the one that counts. Google's own definition of a key event is an event that measures an action particularly important to the success of your business, and the marking is manual by design.
In practice that means choosing which events to track, then flagging one or two of them as conversions in whatever tool you run. The mechanics per tool, thank-you pages, event goals and the rest, are covered in how to track website conversions. A conversion defined wrongly poisons every number downstream, so this setup step deserves more care than it usually gets.
Which visits convert
The count says how many. The more useful product of conversion analytics is who: which traffic sources, campaigns and landing pages the conversions came from. A channel that brings a tenth of the traffic and a third of the conversions is underfunded, and that shape is invisible until conversions are cut by source.
Crediting a source is attribution, and it deserves one honest caveat. Most tools credit the last meaningful click, but real journeys are messier: an ad seen on Monday, a search on Thursday, a direct visit to buy. Different tools resolve that differently, which is one reason your analytics and your ad platforms disagree about the same sales. Treat source-level conversion numbers as strong evidence rather than bookkeeping truth.
Two more cuts pay their way: device, since a checkout that converts on desktop and fails on phones is a common find, and new versus returning visitors. For the steps between arrival and conversion, funnel analysis is the dedicated method.
The numbers worth watching weekly
Three lines cover most sites: conversion count, conversion rate on a named base, and revenue where money changes hands, each against the same period last month or last year. The count says whether the business moved. The rate says whether the site got better at its job or just busier. The comparison base matters more than the number itself, and what a good conversion rate looks like covers the benchmark question properly.
When one line moves, the diagnosis starts with the cuts above: source first, then landing page, then device. A falling rate with steady traffic usually means the traffic mix changed, and one source-level look settles it.
Which tools do conversion analytics
Every general web analytics tool reports conversions once events are defined, from Google Analytics down to the lightest privacy-focused counter. The differences sit in how much definition work is needed and how far the tool follows the visitor. Product analytics tools go deeper on what happens inside an app after signup, and web analytics vs product analytics draws that line.
Some tools also connect conversions to the money behind them. Bigdelta, for example, attributes every visit to its source and links visits to subscription revenue, so the channels and landing pages that drove revenue show up in the same report as the conversions.
What the numbers miss
Conversion data undercounts. Ad blockers and declined consent banners stop analytics scripts for a share of visitors, and those people still buy. The result is that real conversions run higher than reported ones, and conversion rate is distorted less than the count, since both sides of the division shrink together. Dark traffic covers the size of the invisible share.
Two more gaps are structural. Delayed conversions land days after the visit that earned them, and land on whichever visit the attribution window catches. And offline conversions, a phone call, an in-person sale, a bank transfer, never enter the web data at all unless someone wires them in. A services business that converts by phone can look like a failing website and be a thriving company.
From measuring to improving
Conversion analytics produces the numbers. Working through why a page underperforms and what to change is its own method, covered in how to do a conversion analysis. The division of labour is clean: this discipline tells you the signup rate fell and the fall is mobile-only, and the analysis work takes it from there.
The routine that makes the numbers useful is small. Define the one conversion that is the business, watch the three weekly lines, and cut by source when something moves. A site that does that much knows more than most.