How to add analytics to a Replit app
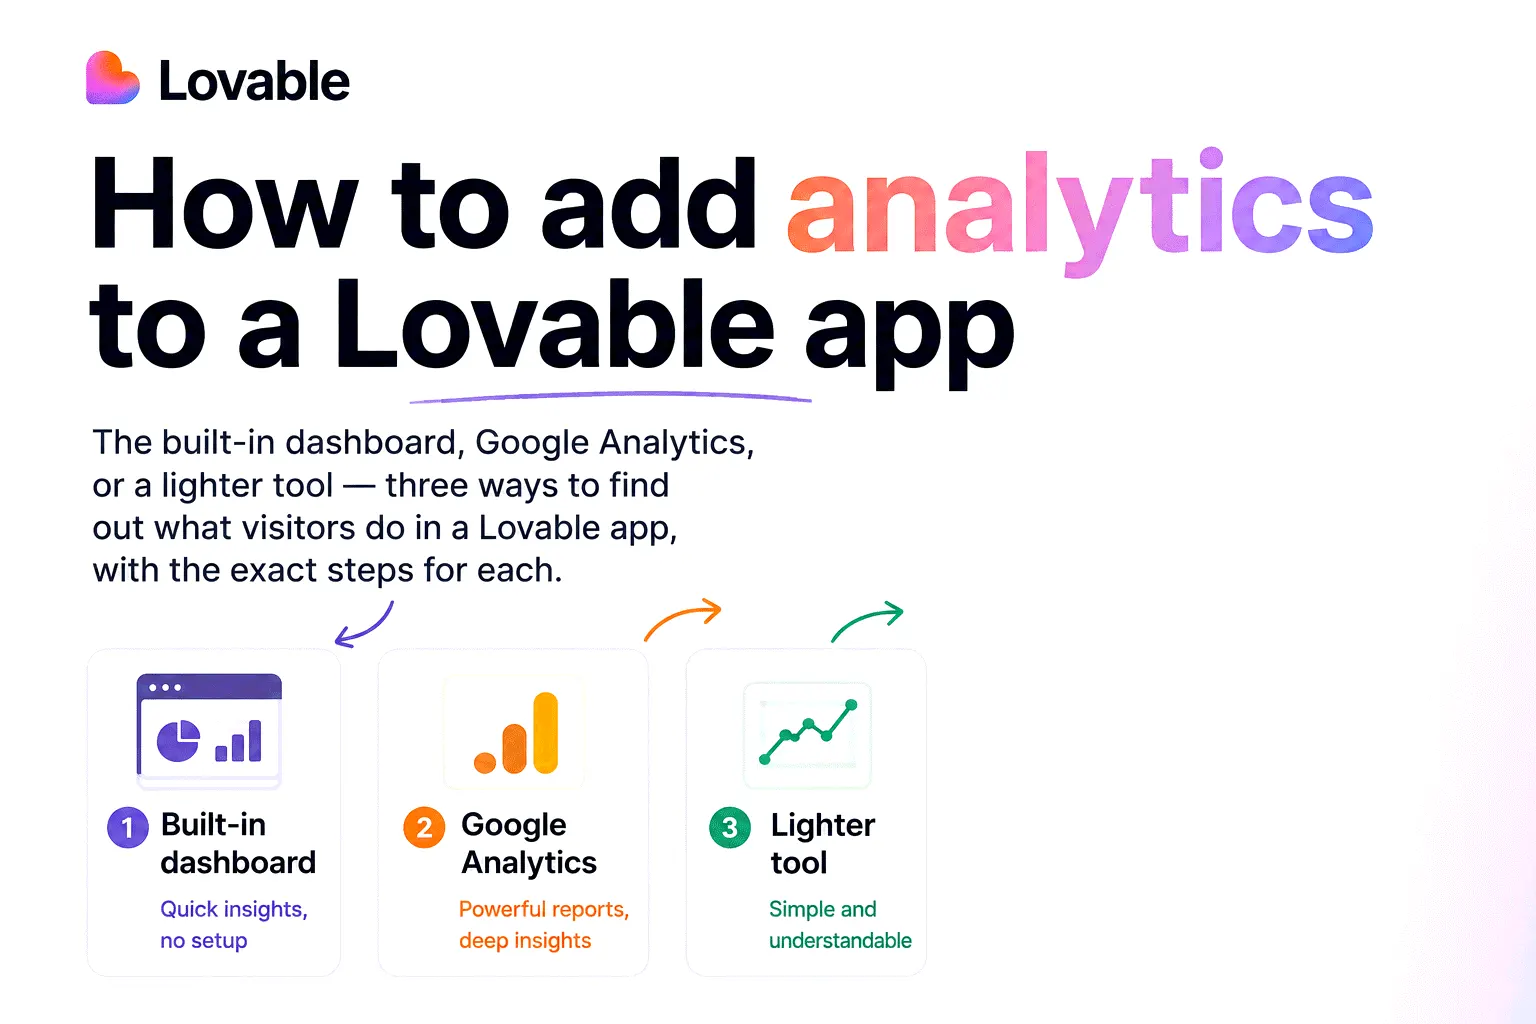
The built-in telemetry, Google Analytics, or a lighter tool — three ways to see what people actually do in a Replit app, with the exact steps for each.
Doesn’t Replit already track this?
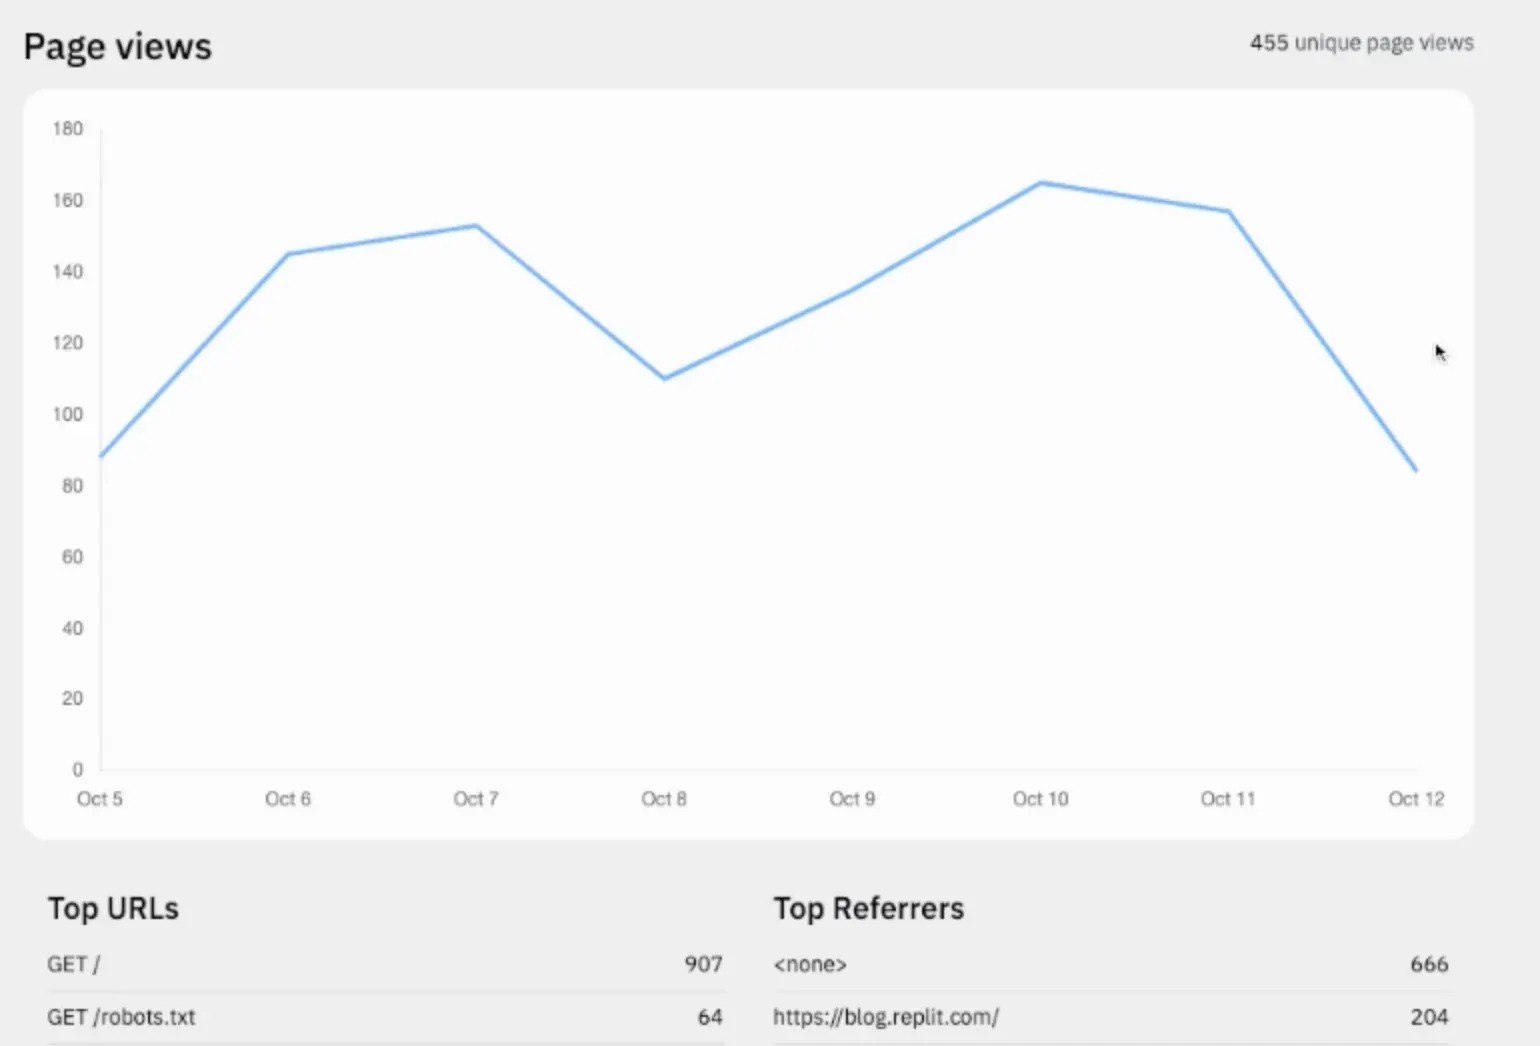
Partly. Every app deployed on Replit collects deployment analytics with no setup: an Analytics tab with page views per hour, top URLs, referrers, countries and devices, and a Monitoring tab with uptime, status codes and resource usage. As infrastructure telemetry it’s genuinely useful — when the app breaks, the answer is usually in there. We’ve written up what it covers and where it stops.
Where it stops is at people. Replit counts a page view as an HTTP request, so uptime checkers and crawlers inflate the numbers while a visitor who browses six screens of a React app registers as roughly one request. Nothing below the request level gets recorded — no clicks, no paths through the app — and history goes back seven days. The Growth dashboard Replit added in 2026 doesn’t change this either: its SEO agent helps the app get found, and has nothing to say about what visitors did once they arrived. Answering that takes a visitor-analytics tool, which is what the rest of this guide is about.
How does adding an analytics tool to Replit work?
The same way it works everywhere: one script tag in the head of the app. Every web analytics tool, from Google Analytics down to the smallest privacy counter, hands you a snippet; the snippet needs to end up in the HTML; visits start registering on the next page load.
Replit gives you two ways to get it there. The first is to ask — paste the snippet into the chat and tell Agent to add it to the head of the app. The second is to do it yourself: Replit is a full editor with a file tree, so you can open the app’s index.html and paste the tag in by hand. A one-line change doesn’t need a prompt.
Either way, the published app doesn’t update itself. Edits live in the workspace until a deploy pushes them out — hit Republish, open the live app once, and check the tool’s dashboard for your own visit.
How do you add Google Analytics to a Replit app?
Installing is the quick part. GA4 tracks pageviews out of the box, but the click on your signup button isn’t an event until you define it — through GA4’s event builder or Google Tag Manager, a second product with its own learning curve — and fresh custom events can take a day or two to reach the standard reports. The reports also speak GA4’s dialect: engaged sessions, key events, attribution models. It all works; most people budget a weekend or two before it does.
The default answer. Four steps:
- Create a GA4 property at analytics.google.com (a Google account is the only prerequisite).
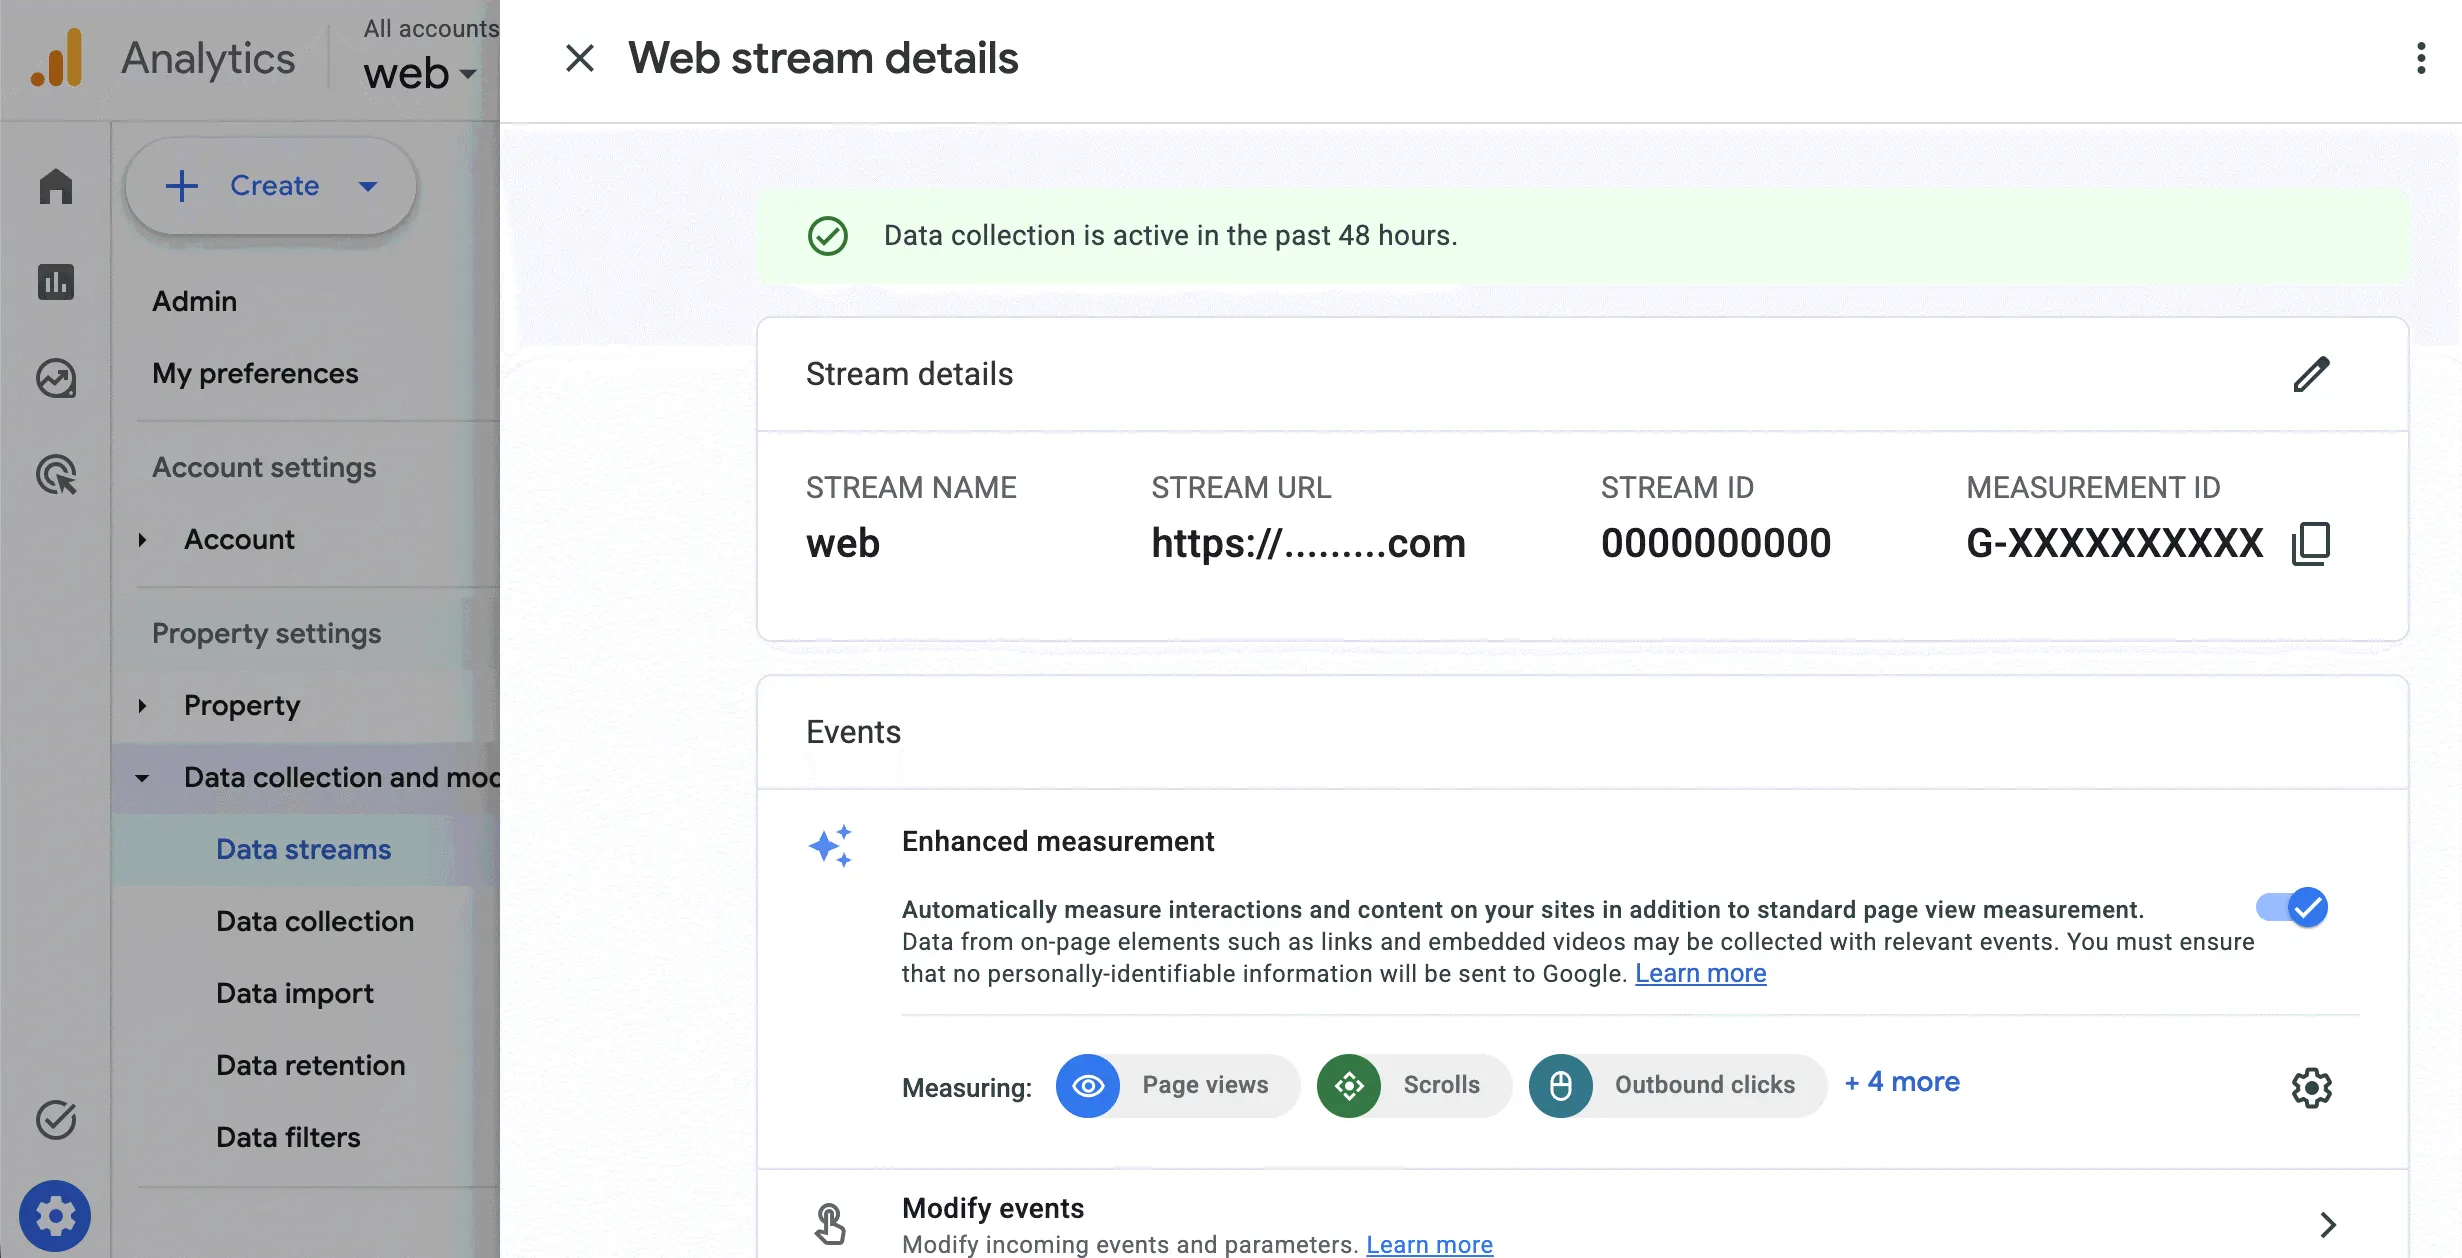
- Add a web data stream with the published app’s URL — the .replit.app address or your custom domain. GA4 hands you a Measurement ID that looks like G-XXXXXXX; it’s always findable under Admin → Data streams.
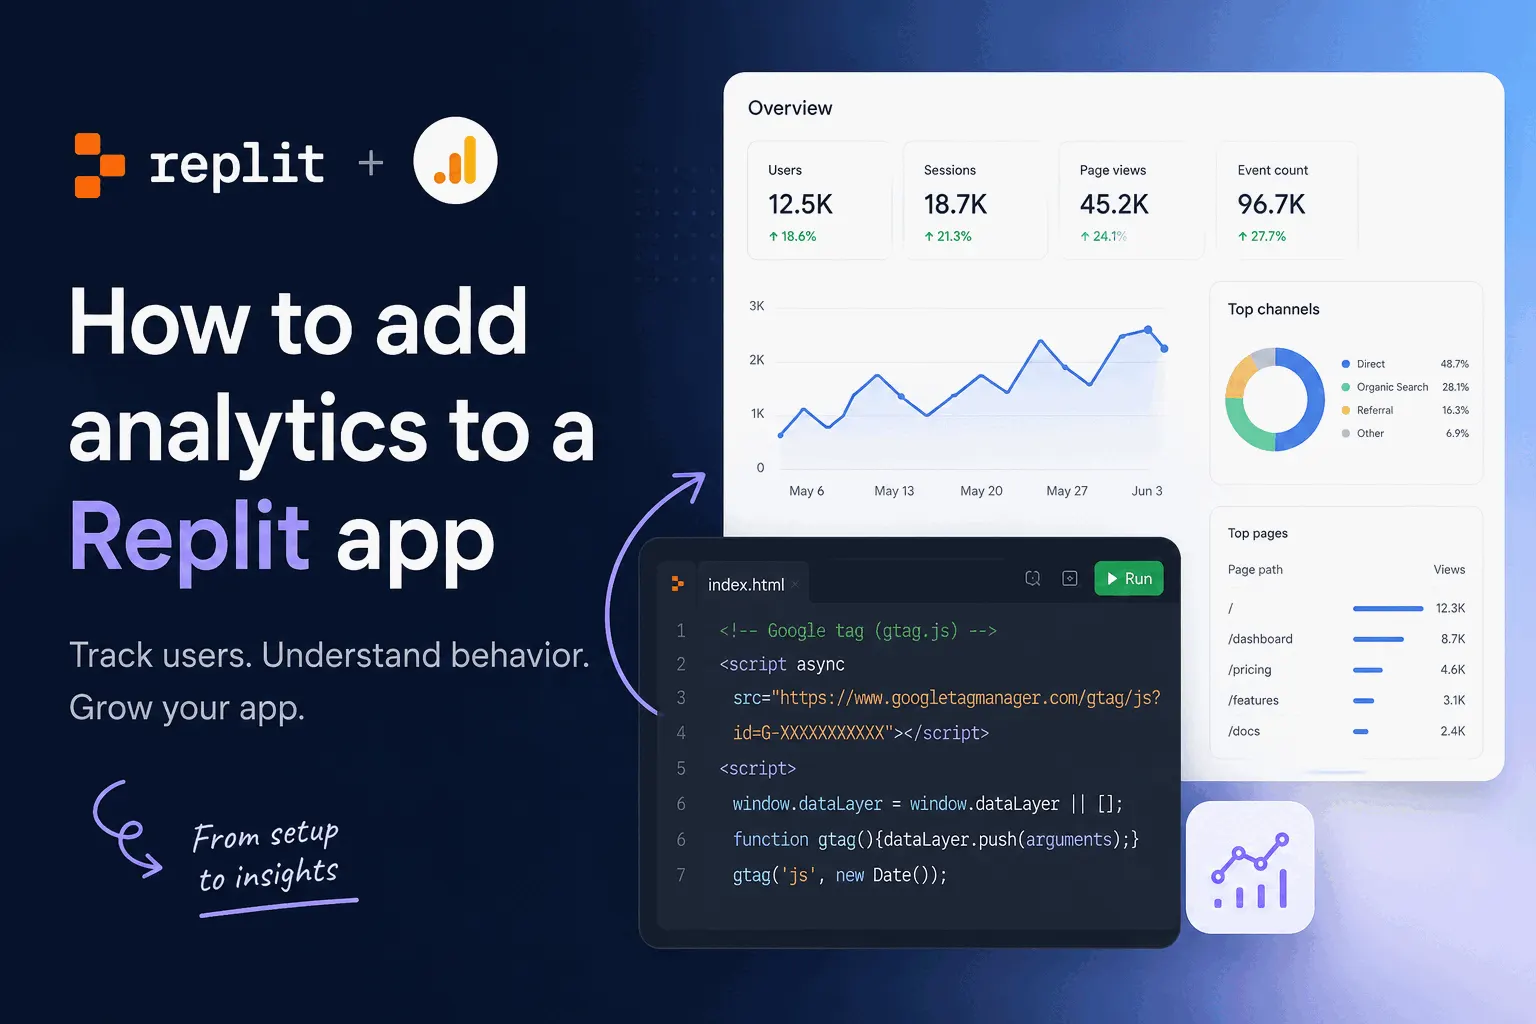
- Ask Agent to add the Google Analytics gtag snippet with that ID to the head of the app — or paste it into index.html yourself — then republish.
- Open the app in another tab and watch the Realtime report in GA4. Your own visit should show up within a minute; that confirms the install.
Related: GA4 vs simpler tools
What’s the lighter way to get event tracking?
A tool that captures events on its own. Bigdelta — our product, so weigh the pitch accordingly — installs by the exact route above: one Agent prompt or one pasted line, republish, done. From the next visit it records pageviews, clicks and form events without any defining, so “did anyone click the signup button” has an answer on day one rather than after an evening in a tag manager.
Replit apps differ from most builder apps in one way that matters here: Agent projects usually ship with a real backend. Bigdelta has server-side SDKs alongside the snippet, so events only the server knows about — a completed checkout, a webhook, an API call — can be tracked from the backend and tied to the same user. The Replit integration page has the setup for both.
None of this dethrones GA4 for the cases GA4 is built for. BigQuery exports, audience syncing into ad platforms, an analyst who lives in the reports — projects with those needs should pay GA4’s setup cost and get its depth. A week-old Replit app wondering whether anyone uses the new feature has cheaper questions.
Related: Bigdelta + Replit setup
Can you watch recordings of people using your Replit app?
Yes, through the same snippet — session replay needs nothing extra from Replit. Bigdelta’s recordings and heatmaps come along with the analytics install above; standalone replay tools go in by the same one-tag route, and the Hotjar-style options compare here. Recordings answer the question charts can’t: a funnel shows that half your visitors quit on the form, and a replay shows which field they were staring at when they gave up. How replay actually works — DOM snapshots rather than video — is its own post.
What should you track once it’s in?
A short list. One or two events tied to whatever the app exists to do — the signup, the checkout, the export — plus the pageviews and referrers every tool gives you free. That’s enough to tell whether traffic becomes use; which events are worth defining has the longer answer, and if the launch already happened and the chart looks wrong, start with what to check when nobody signs up.
Two habits worth keeping. Install before the launch spike, because analytics starts recording at install time and the burst of launch attention is exactly the data you’ll wish you had. And leave Replit’s own dashboard alone — uptime, error codes and memory are its job, visitors are the new tool’s job, and an app needs both watched.
Related: What to track after launch