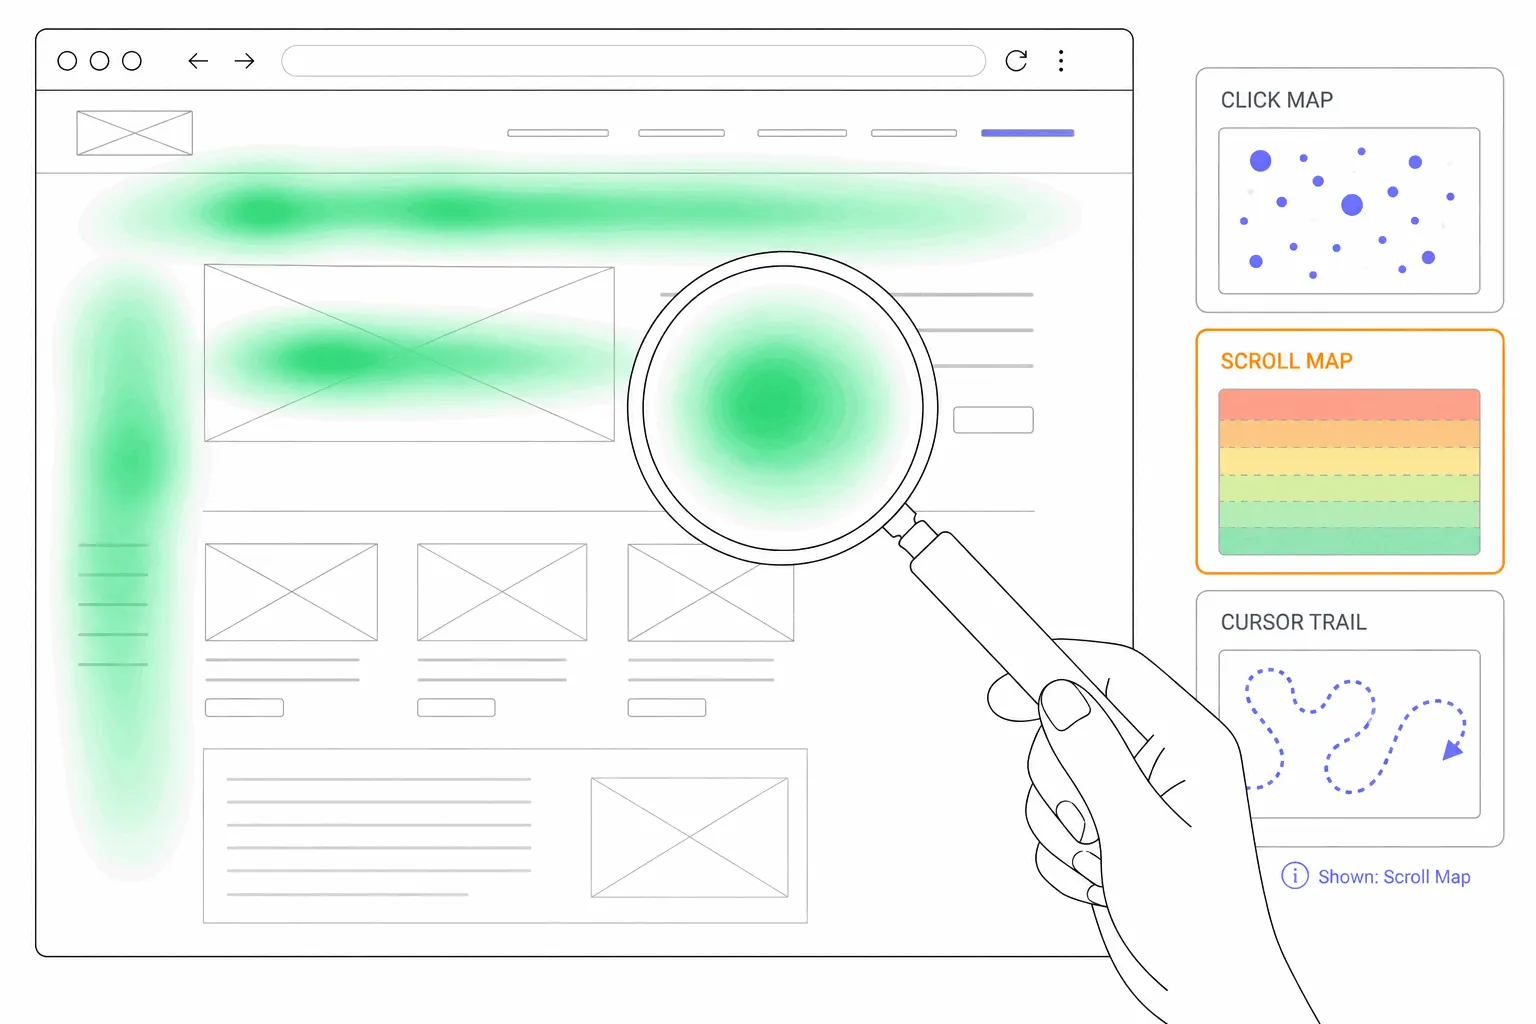
How many visits does a heatmap need?
The visit count everyone quotes is the wrong sample: a map built from 2,000 visits can rest on 12 clicks. What the tool guidance converges on, the click-count math underneath it, and what to do when a page doesn't have the traffic.

The visit count is not the sample
A heatmap is built per page, so it's natural to treat page visits as the sample size. But for a click map the real sample is smaller: it's the number of clicks on the element you're looking at. A page with 2,000 visits where a link gets clicked by 0.5 percent of visitors has 10 clicks on that link. Ten observations. Whether the true rate is 0.2 percent or 0.8 percent - a fourfold difference - is genuinely undecidable from that map, and standard proportion math says exactly that: at 95 percent confidence, 10 clicks in 2,000 visits puts the real rate anywhere in that span.
This is why two maps of the same page from different fortnights can disagree about everything below the headline elements. The navigation and the primary button collect enough clicks to be stable. The footer link that seemed to matter last month was four people.
What the published guidance converges on
There is no peer-reviewed sample-size standard for behavioral heatmaps - the guidance is practitioner-derived, and it's worth knowing that before treating any threshold as law. That said, the vendor guides cluster tightly. The common recommendation is 2,000 to 3,000 pageviews before drawing conclusions from a map. One testing platform's playbook puts a useful gloss on the low end: a few hundred sessions tells you where to look next, not what to do. And the working floor most practitioners quote is that below roughly 200 sessions a week, a heatmap is decoration rather than diagnosis.
One number that gets misapplied here: the research firm Nielsen Norman Group's finding that eye-tracking heatmaps stabilize at 39 users. That's a lab method where every participant is a recruited test user, not an aggregate of anonymous traffic, and its cousin - the five-users rule - belongs to moderated usability testing. Neither says anything about how many visits your click map needs.
A rule of thumb you can actually use
If you want one portable rule, count clicks on the element, not visits to the page. With about 100 clicks on an element, its click rate is pinned to within roughly a fifth of itself at 95 percent confidence - a 5 percent rate reads as somewhere between 4 and 6. With 25 clicks the uncertainty roughly doubles to about 40 percent of the rate, which is fine for spotting that something gets clicked at all and useless for comparing two elements.
So the question "can I put a margin of error on a heatmap" has a real answer: yes, per element, and the tool won't do it for you. Before acting on any specific spot, hover it, read the click count, and apply the rule. A decision about the page's hero can be made on a map a tenth the size of what a decision about a footnote link needs.
Scroll maps stabilize sooner than click maps
The same arithmetic explains why scroll maps feel trustworthy earlier. Every session contributes a scroll depth, so a 300-visit page has 300 observations of how far people got. The same page might have single-digit clicks on most individual elements. Dense data converges fast, sparse data doesn't, and scroll is the densest signal a heatmap tool collects.
In practice that means a scroll map is readable at a few hundred sessions, while the click map of the same page is only readable at its hottest spots. If a page is young or thin on traffic, read the scroll map first and treat the click map as a rumor.
How long to run one
Run a map for at least two full weeks, whatever the traffic. Weekday and weekend visitors behave differently, and a Monday-to-Thursday map bakes that skew in. Avoid windows that mix a campaign spike or a sale with baseline traffic - a launch day can outvote a quiet fortnight, and the blended map describes neither period. If the traffic mix changed sharply mid-window, read the periods separately.
Know which collection model your tool uses, because it changes what a date range means. Snapshot-based tools end a map at a set date or visit cap, so the window is a planning decision made up front. Continuous tools keep collecting, which allows the wait-until-stable approach but also means an old map silently spans redesigns. That's the other hard rule: when the page's layout changes, the map restarts. A composite of two layouts shows clicks on elements that no longer exist, at coordinates that now mean something else.
Low-traffic pages: change method, not patience
Below roughly a thousand visits a month, the math stops cooperating - at that rate even the 2,000-pageview floor is a two-month wait, and per-element click counts may never get there. Waiting longer helps less than switching instrument. Twenty or thirty session replays of the page carry more decision-grade information than a thin heatmap, because a replay doesn't need aggregation to show a person hesitating, missing the button, or leaving.
The other discipline on thin pages is to resist segmentation. Every filter - mobile only, one country, one campaign - divides an already small sample, and a filtered map inherits none of the trust the unfiltered one earned. Segment when the slice still clears the thresholds above, not before.
When a big sample still lies
Sample size protects against randomness, not against bias, and four biases account for most misread maps. Bot traffic lands on pages, fires clicks and inflates hotspots, so a map that disagrees wildly with common sense deserves a bot check before a redesign. Mixed devices produce a chimera - phone and desktop layouts differ, so a combined map describes neither, and every serious tool separates them for that reason. Mixed traffic sources hide real patterns too: paid visitors and organic visitors click differently, and a mid-window campaign changes who the map is even about.
The last bias is self-inflicted: changing the date range mid-analysis. A redrawn window is a different sample of different people, and conclusions don't carry across. Freeze the window, read the map, and start a fresh window for the next question.
Checking sample size in Bigdelta
Bigdelta's heatmaps update continuously as data arrives, so the practical workflow is to check what a map is resting on before trusting it: the click counts behind the hot spots, and whether the window covers full weeks of normal traffic. Filters by page, device type and traffic source make the clean per-segment maps this post argues for - and the same caveat applies, since each filter shrinks the sample it shows.
For the pages that will never accumulate a trustworthy map, the replays are the fallback built into the same tool: the sessions behind any page are a click away, which is exactly the switch of instrument a thin page calls for.
The takeaway
Two to three thousand pageviews is the sensible floor for acting on a click map, a few hundred sessions is enough to pick targets and read scroll depth, and the real unit of trust is clicks on the element - about a hundred for a rate you'd defend, and a rule you can apply by hovering. Run maps for whole weeks, restart them on redesigns, keep devices separate, and when a page can't feed the math, watch its replays instead of squinting at its colors.