How to analyze session recordings
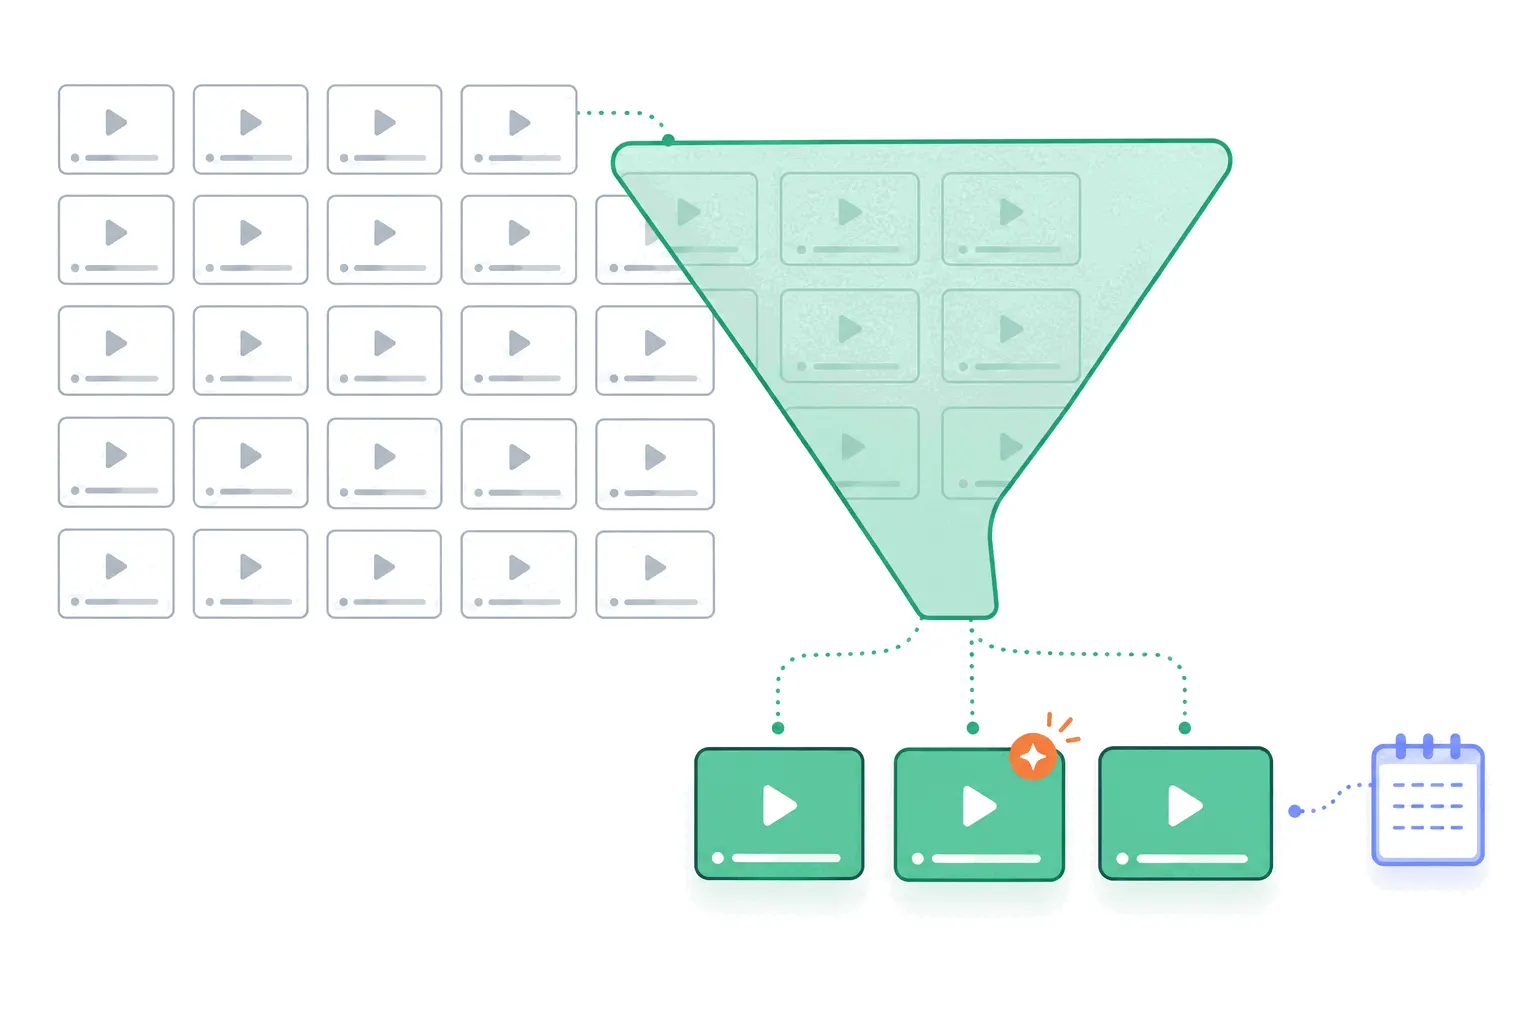
A replay tool piles up hundreds of recordings a week, and watching them in order teaches you nothing. The workflow that extracts answers: filter to the sessions that matter, watch a handful with one question, stop when patterns repeat.
The pile problem
Turn on session replay and within a week you own hundreds of recordings - a pile that grows faster than anyone can watch and mostly shows people browsing uneventfully. The instinct to "go through the recordings" fails not from laziness but from arithmetic. The fix is treating replays like the qualitative data they are: you don't read every survey response either; you sample with a question in hand.
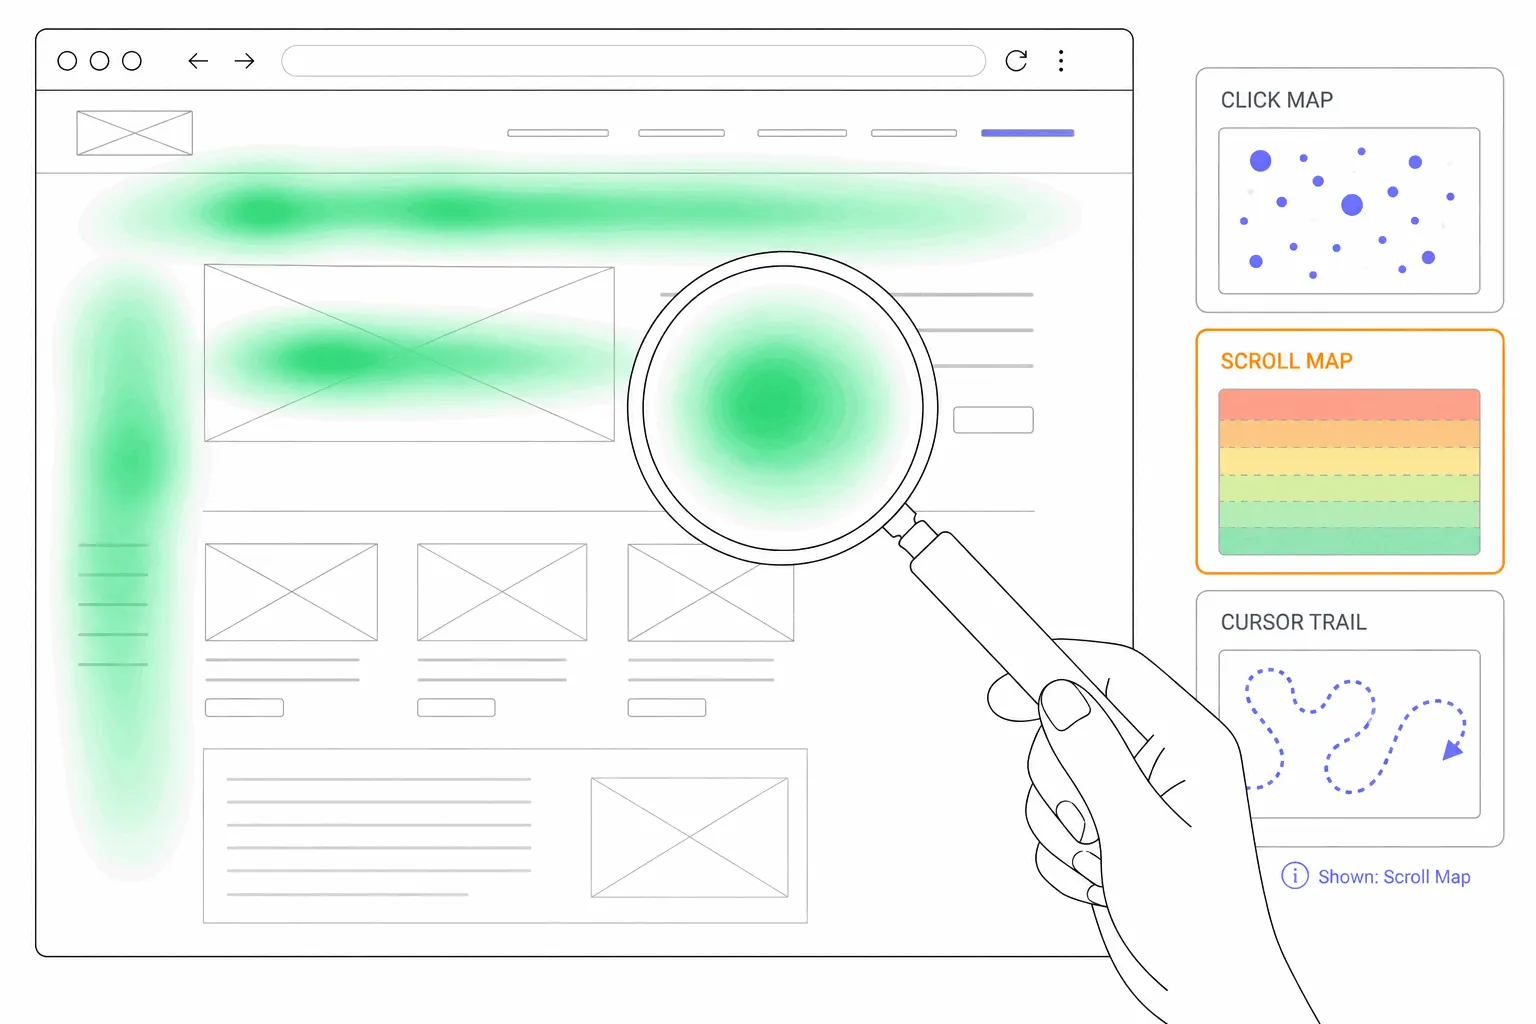
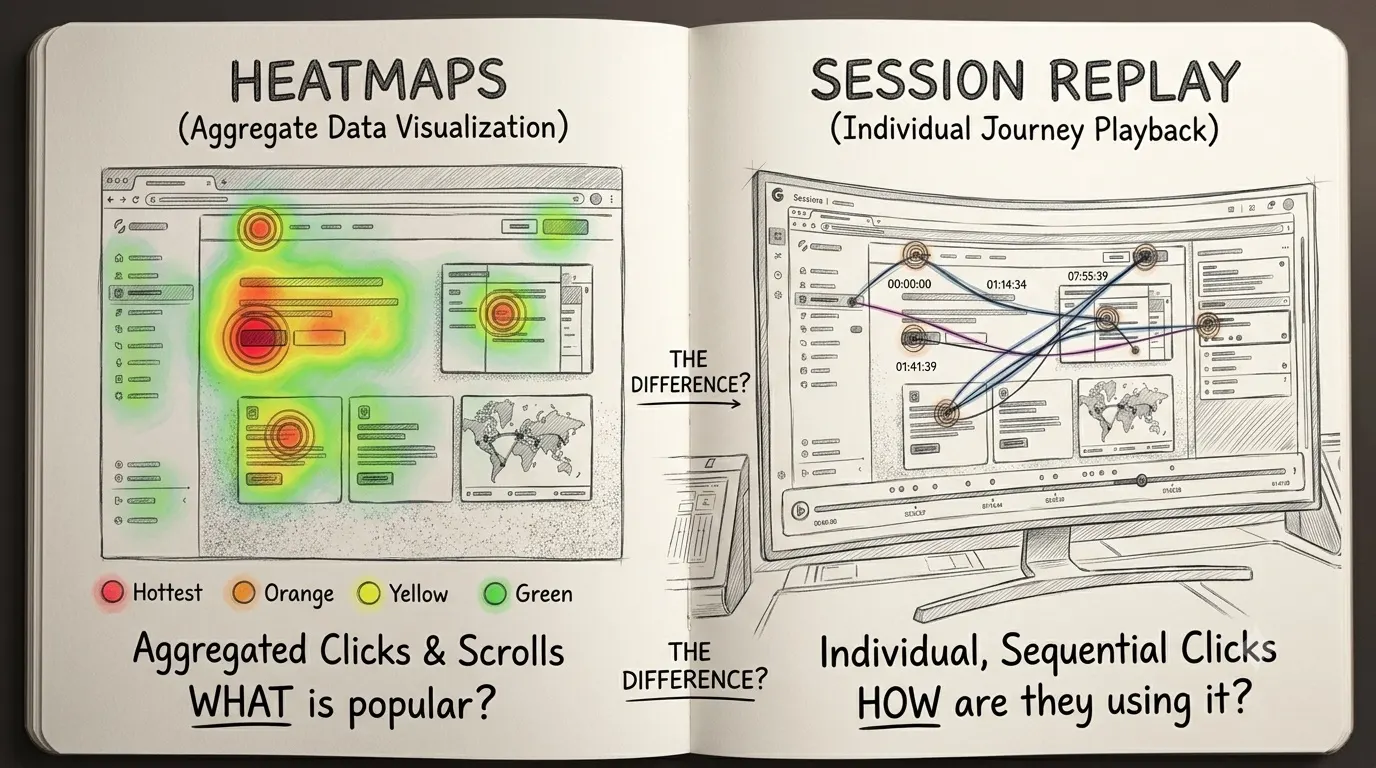
Everything below is that method - the same discipline as analyzing a heatmap, applied to footage.
Filter first, watch second
Never open the unfiltered list. Every serious replay tool filters recordings by the things you'd actually ask about - Microsoft Clarity, for instance, ships dozens of filters spanning pages visited, device, session length and behavior signals. The high-yield cuts are consistent across tools: sessions that ended on a specific page, sessions that reached the goal versus sessions that didn't, one device class at a time, and sessions carrying a frustration signal.
The filter is where the question lives. "Watch checkout sessions from mobile that didn't purchase" is analysis; "watch recordings" is television.
Frustration signals are the shortcut
Replay tools flag the moments worth watching automatically. Rage clicks - the same element hammered repeatedly - mean something looked responsive and wasn't. Dead clicks land on things that were never interactive. Excessive scrolling suggests hunting for something that isn't where expected, and quick-backs - arriving and bouncing straight out - suggest the page broke a promise. Definitions and thresholds vary a little by tool, but as recording filters they all do the same job: they sort the pile by probability of insight.
A practical starting query for any new setup: recordings from the last week, on your money pages, with a rage or dead click present. That list is short and rarely boring.
How many do you actually need to watch?
Fewer than it feels like. The classic usability research result - Nielsen Norman Group's five-users finding - is that a handful of test users surface most of a design's problems, with diminishing returns after that. The caveat: that number comes from directed testing, not passive replay-watching, so treat it as a shape rather than a law. In practice the shape holds: watch five to ten recordings matching one specific filter, and by the last few you're seeing problems you've already seen. Repetition is the signal to stop watching and start fixing.
What the small sample can't do is measure. Three of eight recordings showing a struggle doesn't mean 37% of users struggle - recordings tell you what goes wrong and how, and your metrics tell you how much.
Watch like an analyst, not an audience
Small habits multiply the yield. Watch at double speed and let the tool skip inactivity - most tools do by default. Keep notes with timestamps, one line per observed problem, because after ten sessions the recordings blur together. Tag or share the recordings that crystallize an issue; a fifteen-second clip of a real person failing persuades a teammate faster than any chart. And write the hypothesis down before watching - "people miss the continue button on mobile" - so you notice when the footage disagrees with you, which is the most valuable outcome there is.
What recordings can't tell you
A replay shows behavior, never intent - you see the visitor leave, not whether they left annoyed, satisfied or interrupted by a doorbell. When the question is why in the psychological sense, ask people directly with a survey; the replay tells you where to aim it. Privacy design also bounds what's visible: replay tools mask typed input by default, so you'll watch someone fill a form without seeing the contents - correct behavior, worth knowing before you conclude the form was empty. And most tools sample or cap what they record, so the archive is a subset, not a census - one more reason recordings are for diagnosis, not measurement.
A loop you can run weekly
Run that loop on one question a week and the recording pile becomes an asset instead of a guilt backlog.
The whole practice, compressed:
- Start from a number that bothers you - a funnel step, a page's exit rate, a form's abandonment.
- Filter recordings to exactly that situation, frustration signals first.
- Watch five to ten at speed, notes with timestamps, one hypothesis in hand.
- Stop when problems repeat; ship the smallest fix the footage justifies.
- Re-check the number that started it - the metric, not the vibes, decides whether it worked.
The practical takeaway
Session recordings reward exactly the effort they're usually denied: a question, a filter, a small sample, a written observation. In Bigdelta the replays share their segments with the analytics, so "mobile visitors who abandoned checkout" is one filter away from footage of it happening. However you get there, the method is the point - the teams that get value from replays aren't the ones who watch the most; they're the ones who never press play without knowing what they're checking for.