What is a click map?
Every click and tap on a page, painted onto one picture of it. What dead clicks and rage clicks diagnose, and when a hotspot means nothing at all.
What a click map shows
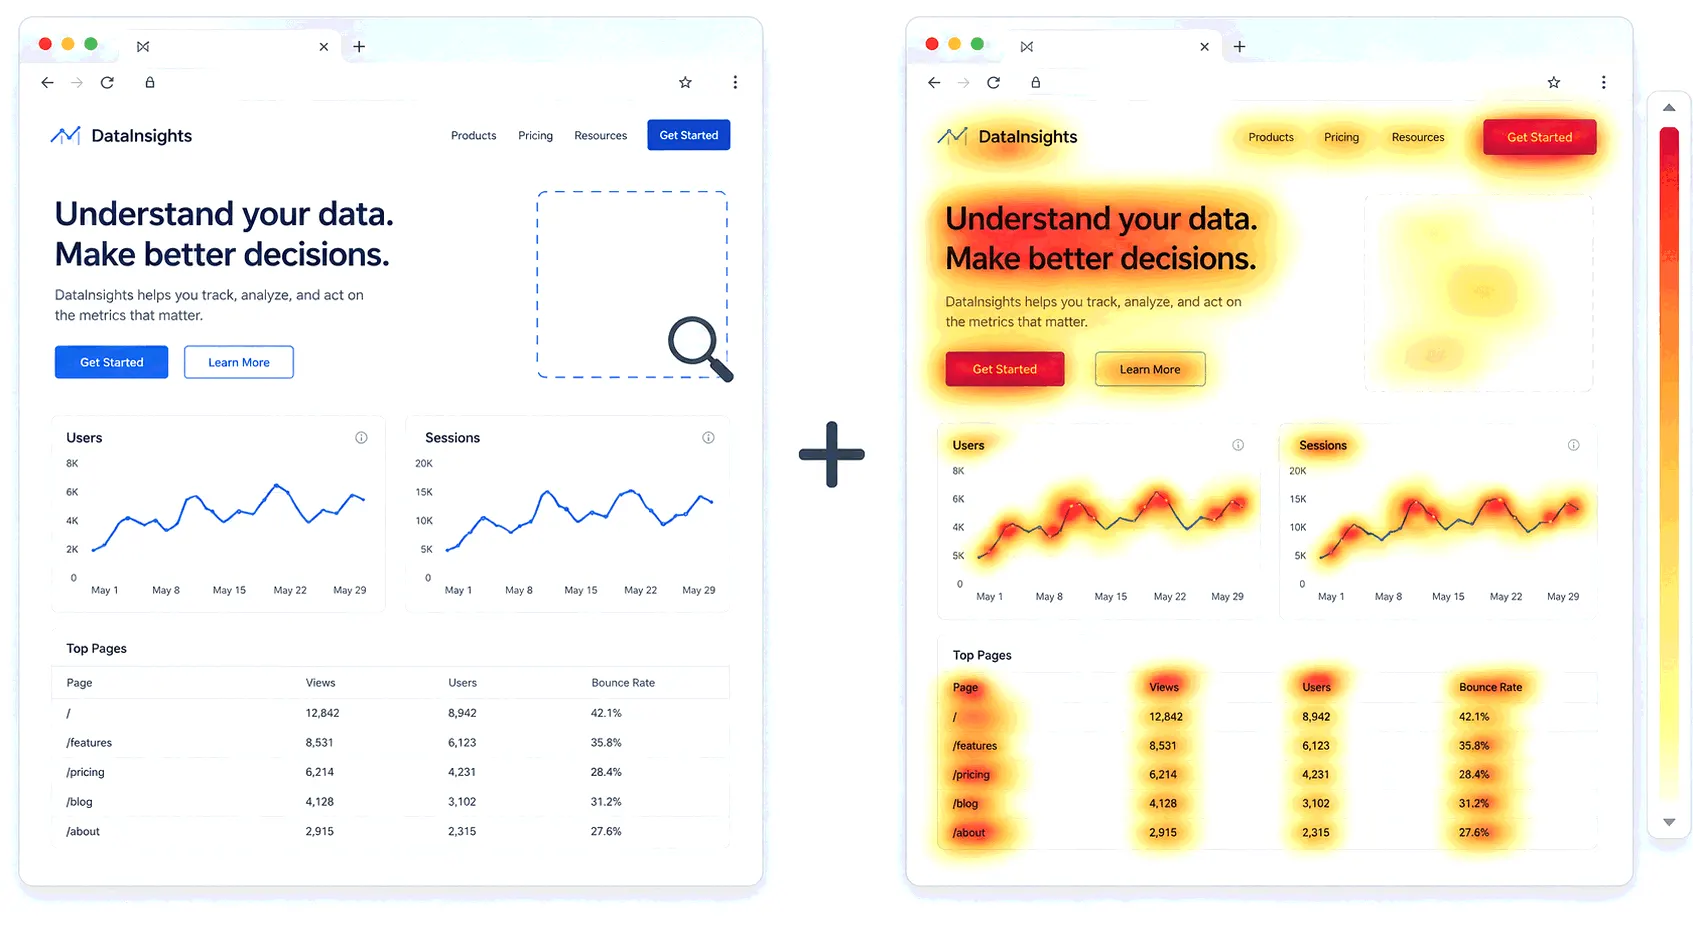
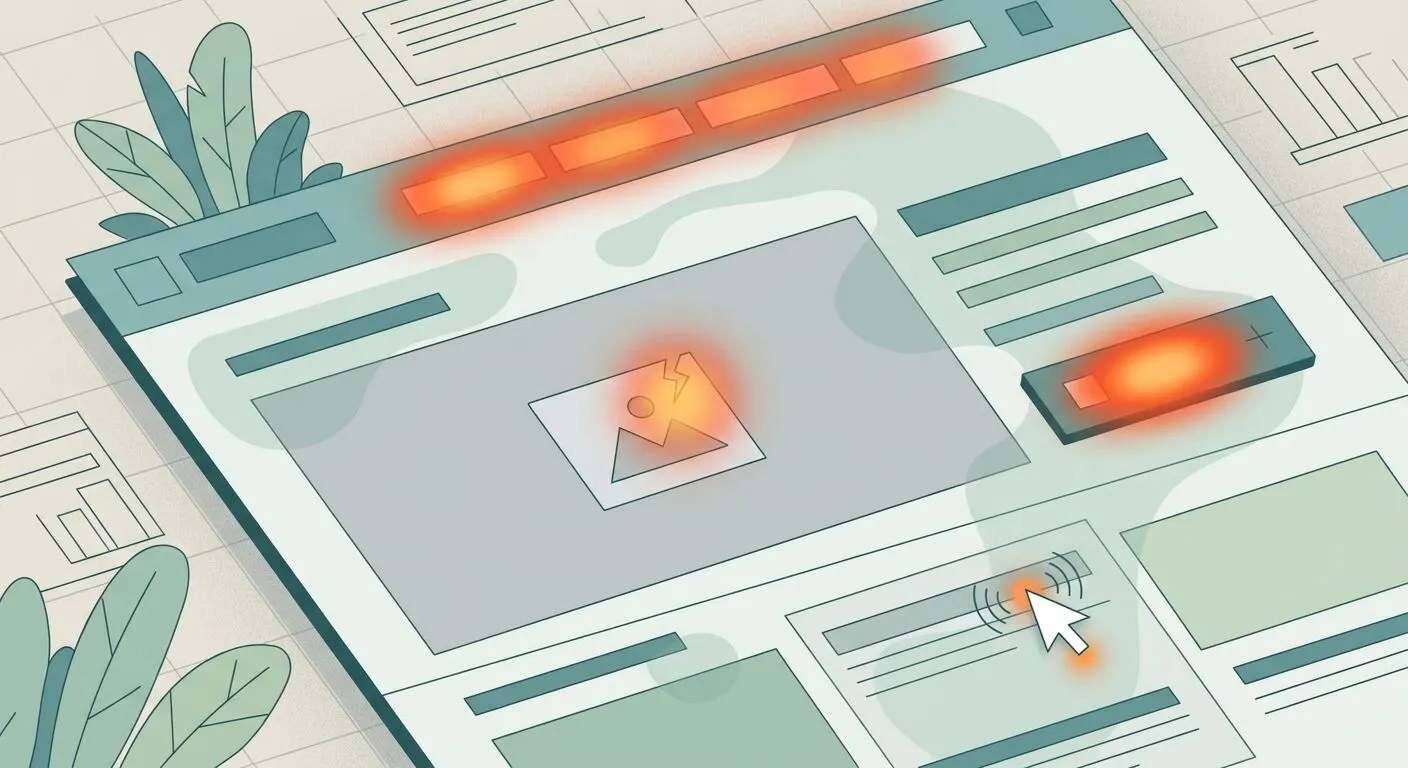
A click map takes every click visitors made on a page and paints them onto a screenshot of it - warm colors where clicks pile up, cool or nothing where they don't. It's the click layer of the website heatmap family, and usually the first one people look at, because it answers a blunt question: are people clicking the things I built to be clicked?
On desktop the map records mouse clicks; on phones it records taps. Tools build separate maps per device type, and the two rarely agree - a menu that's hot on mobile can sit ignored on desktop where the full navigation is visible.
How a click map is built
The tracking script on your page records two things per click: the position, and the page element under it - this button, that image, this stretch of text. Mapping clicks to elements rather than raw pixels is what keeps the picture honest on responsive layouts: when the signup button sits top-right on a laptop and mid-page on a phone, its clicks still aggregate to the button, not to two unrelated spots.
Collection runs continuously from the moment the script is installed, so the map is a rolling record rather than a one-off study. Most tools let you cut it by date range, device or traffic source - the same page often produces a different map for ad clicks than for search visitors.
Why not just count click events?
You can track clicks as events in any analytics tool, and for defined goals you should. What the event count can't show is everything you didn't think to measure. An event tells you the signup button got 200 clicks; the map shows another 300 on a product screenshot that links nowhere - clicks nobody defined an event for, on an element nobody expected to draw them.
That's the working division: events measure the interactions you planned, the click map surfaces the ones you didn't.
Dead clicks, rage clicks, error clicks
Three click patterns carry diagnostic weight, and most tools flag them automatically. A dead click is a click that changes nothing on the page - the visitor expected a response and got none, which usually means something looks clickable but isn't. A rage click is rapid repeated clicking on the same spot - a visitor fighting an element that won't respond, often a genuinely broken one. An error click is a click followed immediately by a JavaScript error - the page broke in response.
The exact thresholds (how many clicks, within how many milliseconds) vary by tool and mostly aren't published - common implementations flag three or more clicks within about a second and a half. The counts aren't comparable across tools for that reason; the locations are what matter. A cluster of dead clicks on an underlined heading says visitors think it's a link. Make it one, or stop styling it like one.
Where click maps mislead
Mobile taps inflate quietly: people tap to stop a scroll or to dismiss a keyboard, and those taps land in the data looking like interest in whatever they happened to touch. A warm blob on an empty area of a mobile map is usually this, not fascination with your whitespace.
The page changing under the data is the other trap. A click map is clicks joined to a snapshot of the page - redesign a section, move a button, or serve dynamic content that shifts between visits, and old clicks get drawn onto new pixels. After any meaningful layout change, date-filter the map to the new version before trusting it.
And hot doesn't mean good. Navigation and logos are hot on every site; the question a click map answers isn't "what's popular" but whether the clicks land where the page's job gets done - and what's pulling clicks away from it.
Can Google Analytics do this?
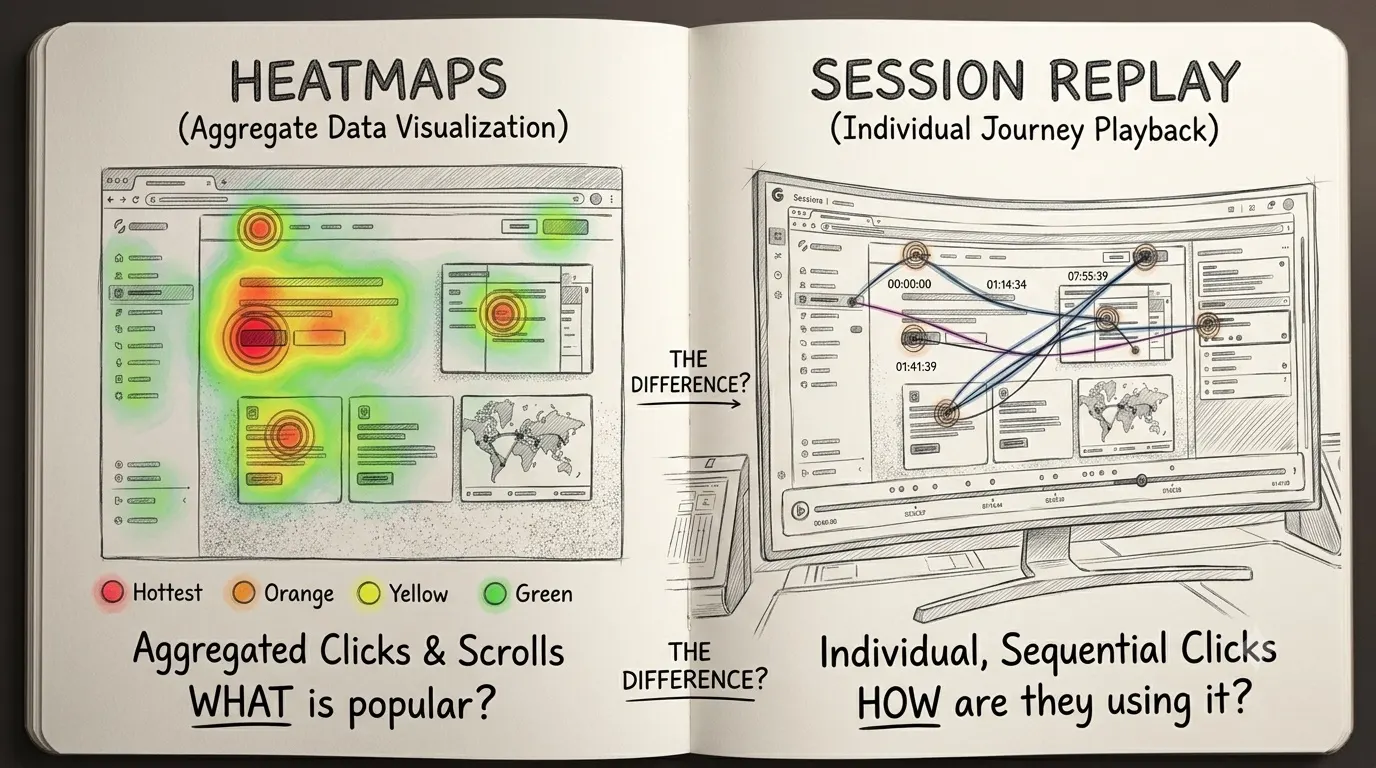
No - GA4 counts click events (outbound links and downloads automatically, others if you define them) but draws no maps. A click map needs a dedicated heatmap tool. In Bigdelta, click maps come with dead- and rage-click detection and a ranked list of the most-clicked elements per page, and any hotspot can be drilled into the session replays behind it - the map says where, the replays say what happened around the click.
The practical takeaway
Read a click map with three questions: is anything non-clickable drawing clicks (fix the styling or make it real), is the page's primary action actually in the hot zone, and do dead- or rage-click clusters line up with a recent change? Ten minutes on the click map of your highest-traffic page usually returns at least one of those - which is a good trade for ten minutes.