How to forecast organic traffic
Keyword by keyword, search traffic is more forecastable than any other channel - volume, a click-through curve, a discount for AI answers, and honest ranges. The method, the three estimates hiding inside it, and how your own data sharpens all of them.
Two forecasts that share a name
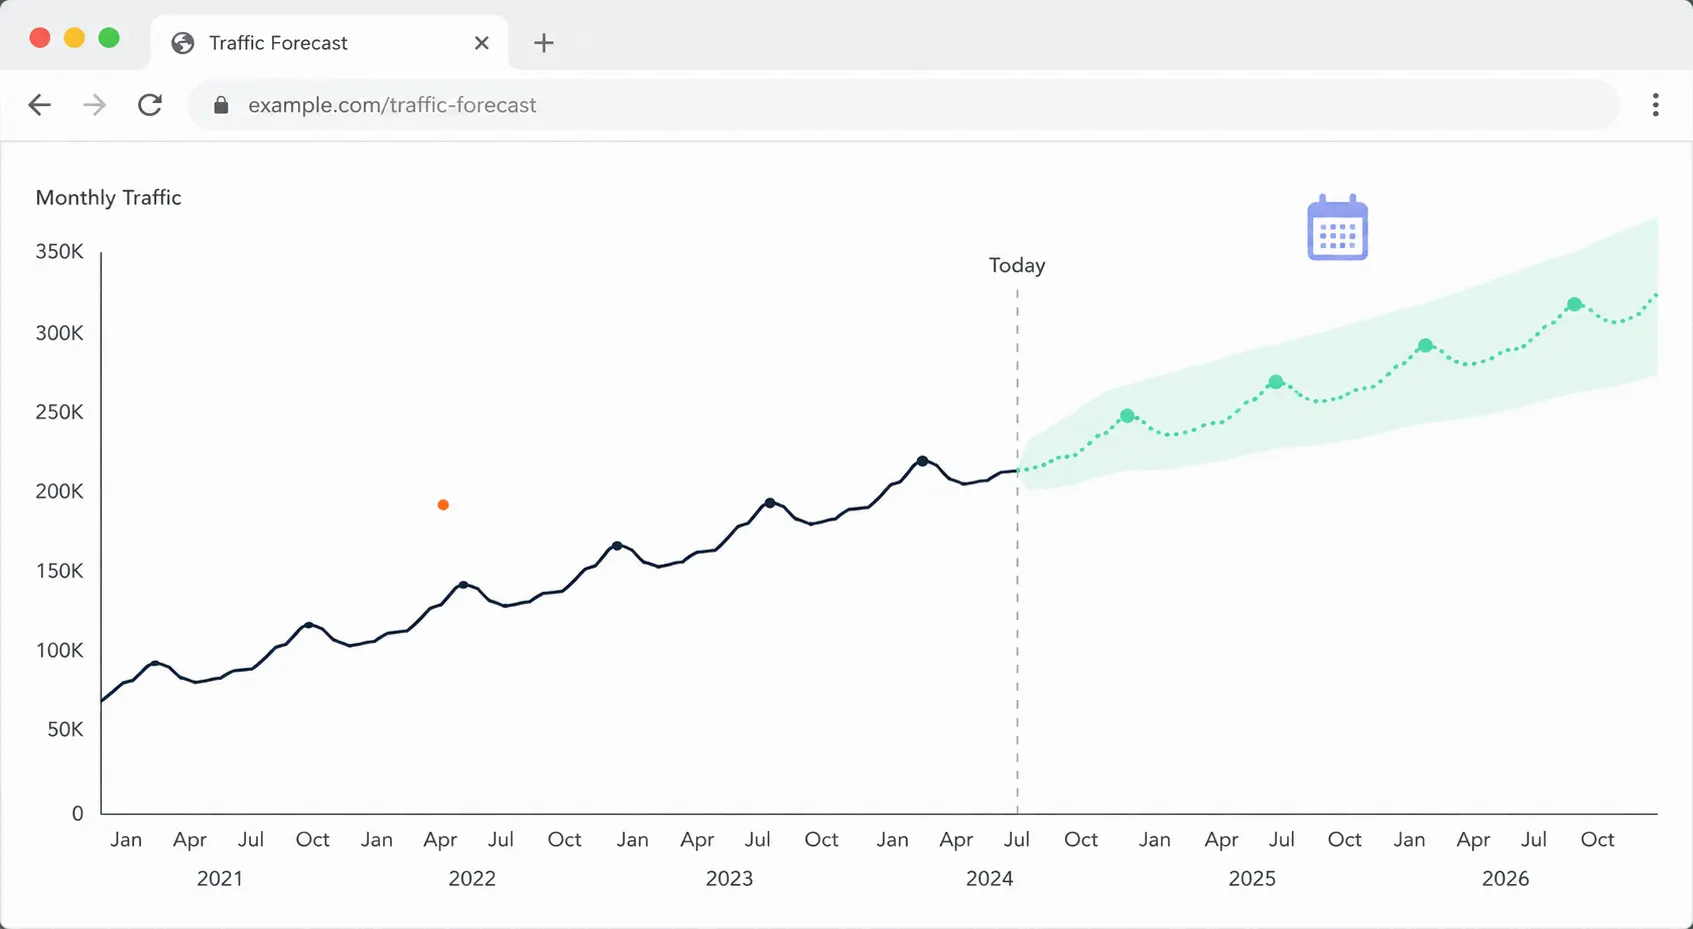
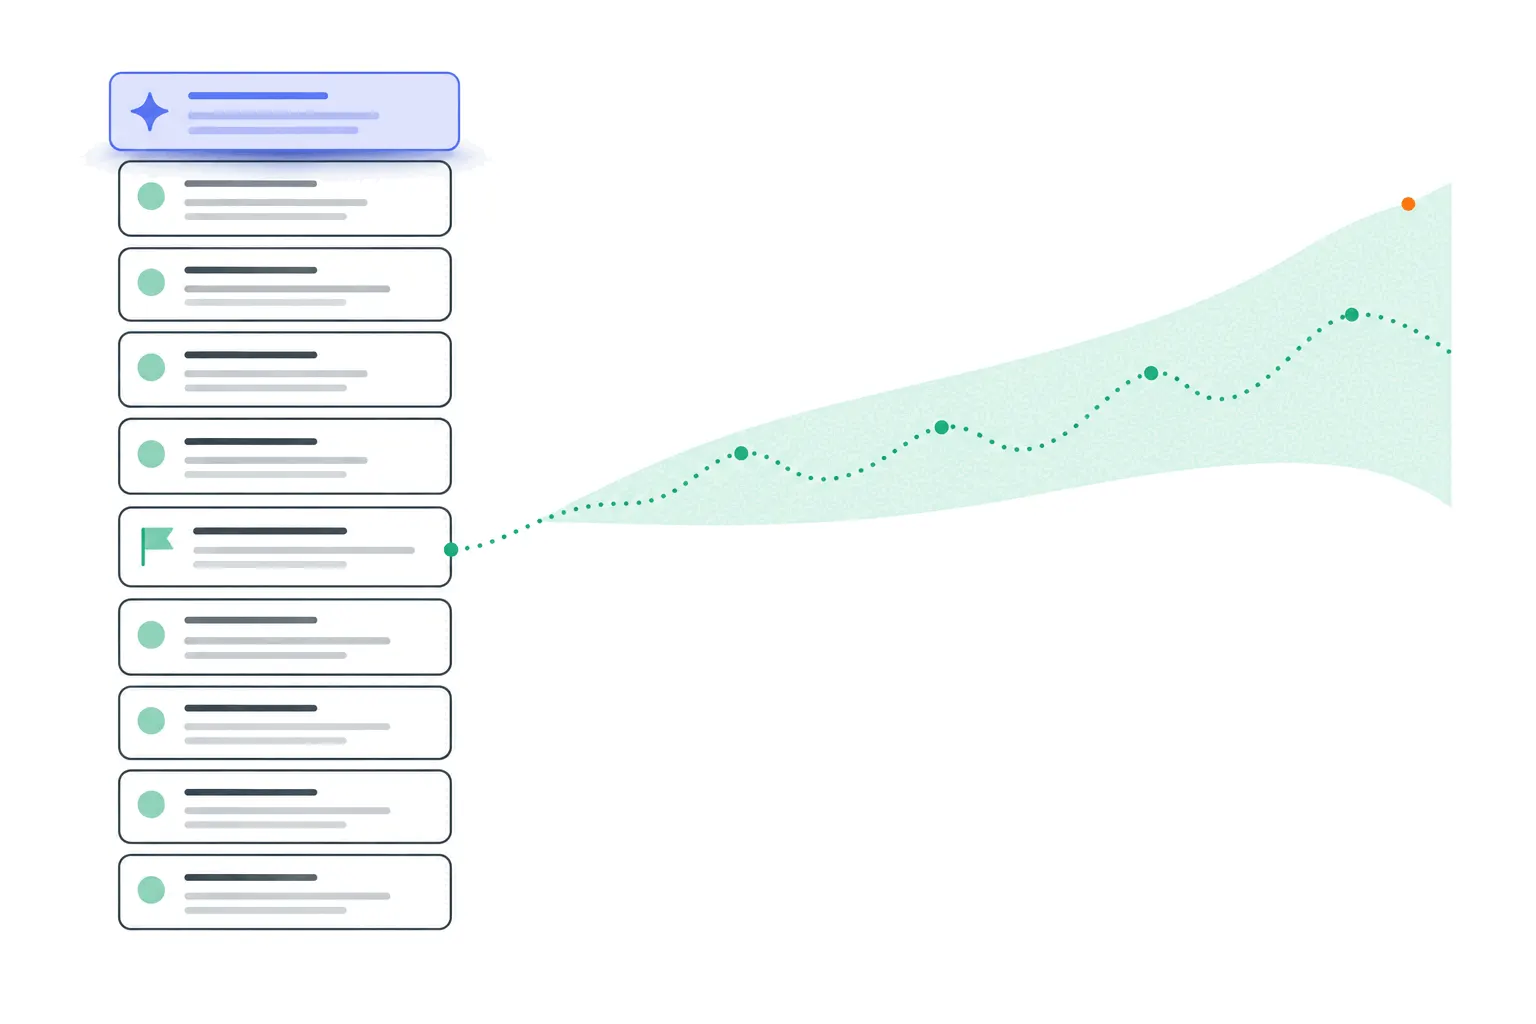
"Forecast organic traffic" means two different exercises, and mixing them produces most bad SEO forecasts. The first projects what your existing rankings will deliver - that's ordinary traffic forecasting applied to one channel, trend and seasonality on your own history, and the general method covers it. The second is the interesting one: estimating what content you haven't written or rankings you haven't earned could deliver. That's keyword-level forecasting, it's how content investments get prioritized and SEO work gets sold, and it's what this post covers.
The honest framing up front: a keyword-level forecast is a stack of estimates multiplied together. Done carefully it produces genuinely useful ranges and rankings-of-opportunities. Done credulously it produces a precise-looking number that's wrong by 5x. The method below is the careful version.
The formula, and a worked example
The core arithmetic is one line: monthly search volume, times the click-through rate you'd earn at your target position. A keyword searched 1,000 times a month, at a position that earns 10% of clicks, forecasts 100 visits a month. Build that per keyword, sum the list, layer on seasonality and ramp-up time, and you have the forecast.
Everything interesting hides in the inputs. The volume is an estimate, the CTR curve is an estimate, and the position you'll reach is a guess with confidence attached. The next three sections take them in order, because knowing each input's error bars is the difference between forecasting and fiction.
Input one: search volumes are modeled, not counted
No tool counts searches - Google doesn't publish them. Keyword Planner gives ranges built for ad buyers, and the SEO suites model volumes from clickstream panels and their own data, the same estimate-machinery whose error bars this library has covered before. Treat any keyword's stated volume as a midpoint that could be off by half in either direction, and expect the errors to be worst exactly where forecasts are most tempting - new, niche and trending terms.
The practical hedge is portfolio thinking: volume errors partially cancel across a list of twenty keywords, so forecast clusters rather than single terms, and give more trust to keywords where multiple tools roughly agree.
Input two: the click-through curve
Position determines your share of clicks, and the shape is brutal: roughly a quarter of clicks at position one, falling fast through the top five, low single digits at the bottom of page one, near nothing beyond it - the shape Backlinko's analysis made famous and Advanced Web Ranking tracks month to month. The exact percentages vary by query type, device and whether the searcher's brand-savvy, so the curve is a starting assumption, not a constant.
Two corollaries worth internalizing. Position 8 is not 80% of position 1's traffic - it's more like a twentieth, which is why striking-distance pushes from page two to page one produce the disproportionate wins. And a forecast built on "we'll rank #1" is a fantasy document - forecast for positions 3-7 unless you have evidence for better.
Input three: the AI Overviews discount
The CTR curves above describe SERPs that increasingly don't exist. When an AI Overview sits on the results page, Pew Research found users click a result on 8% of searches versus 15% without one, and Ahrefs measured first-position CTR falling 34.5% under an Overview. A forecast that ignores this overstates informational-keyword traffic badly - the organic traffic post covers the wider shift.
The workable adjustment: search your target keywords and note which trigger an Overview, then cut forecast CTR for those by a third to a half. The pattern is merciful to some intents - transactional and navigational queries trigger Overviews less, and the definitional "what is X" space gets hit hardest. Recheck quarterly, because this input is still moving.
Forecasting for a site with no history
A new site changes the math in one dominant way: authority. The CTR curve still holds, but the position assumptions collapse - a domain with no links and no track record isn't reaching position 5 on a competitive head term in year one, whatever the content's quality, and most new pages never crack the top ten at all. The honest new-site forecast targets the long tail exclusively: low-volume, low-competition keywords where reaching position 3 is plausible, summed across many of them.
It also changes the calibration source. With no GSC history to calibrate against, borrow conservatively - assume the pessimistic end of every published curve, stretch the ramp to two or three quarters, and treat the first six months of actual GSC data as the real forecast's beginning. The first version of a new site's forecast is mostly a hypothesis for the data to correct, and writing it down anyway is what makes the correction fast.
Calibrate with your own Search Console data
Here's the step that separates a real forecast from a template: replace the generic curves with your own. Search Console's Performance report shows your actual CTR at every position you hold, across your real mix of SERP features and brand strength - which makes it the only CTR curve that's true for you. Export queries with position and CTR, bucket by position, and the resulting curve is what your forecasts should use. Most sites find their real curve runs below the published ones, which is exactly the kind of optimism a forecast needs removed.
GSC calibrates the ramp too: look at your own recent posts' history to see how long they took to reach their settled positions. This library's own experience matches the industry's general finding - new content takes months, not weeks, and Ahrefs' dated-but-still-sobering study found only a sliver of new pages reach the top ten within a year. Forecast new content at partial value for its first two quarters, whatever the spreadsheet's enthusiasm.
Assembling it: seasonality, ramp, and ranges
The assembly is a spreadsheet, not software. One row per keyword: volume, target position, calibrated CTR, Overview discount if triggered, and a ramp factor by quarter. Multiply across, sum down, then shape the monthly totals with seasonality - Google Trends confirms whether your topics have a seasonal rhythm, on its relative 0-100 index. That's the whole machine.
Then do what every honest forecast does and publish a range. Your inputs each carry tens-of-percent error, so the sum deserves at least a plus-or-minus-a-third band - "1,500 to 3,000 monthly visits by Q2, centered near 2,200" is a forecast someone can plan against. A single number with no band isn't more confident, just less honest, and the general forecasting post's rule applies doubly here: when actuals leave the band, that's the forecast working - it's telling you an assumption broke.
A worked example, end to end
Say you're planning a five-post cluster around a topic whose keywords total 4,000 searches a month: one head term at 2,000 and four long-tails around 500 each. Target positions, honestly: 5 for the head term (competitive), 3 for the long-tails. Your calibrated GSC curve says position 5 earns you 4% and position 3 earns 8%. That's 80 visits from the head term and 160 from the long-tails - 240 a month at maturity. Two of the five keywords trigger AI Overviews, so their contribution gets cut by 40%, taking the total to roughly 190.
Then the ramp: quarter one at 25%, quarter two at 60%, mature from quarter three - so the honest pitch is "about 50 visits a month by the end of Q1, climbing toward 130-250 monthly by Q3". Notice what the arithmetic did: a topic that sounded like "4,000 searches!" resolved to a couple hundred monthly visits, with a ramp. That deflation is the method working - it's the difference between a forecast and a keyword tool screenshot, and it's exactly the calculation that tells you whether the cluster beats the other things you could write.
Keep the forecast alive
A forecast filed after the meeting is dead weight - the value compounds when it becomes a loop. Monthly, pull actuals from Search Console for the forecasted keywords: impressions tell you whether the volume estimates were sane, positions tell you whether the ranking assumptions are on track, and clicks settle the CTR question. Each miss localizes to an input, and fixing that input sharpens every future forecast - which is more than can be said for most planning documents.
Quarterly, recalibrate the curve itself from fresh GSC data, and re-run the AI Overview check on your keyword list - both move enough right now to drift a forecast inside two quarters. The whole maintenance habit is maybe an hour a month, and it converts forecasting from an annual guess into an instrument you actually steer with.
Why SEO forecasts miss, and what they're still for
Even careful forecasts miss, for reasons worth naming in the document itself: algorithm updates reshuffle positions without notice, SERP layouts change what any position is worth, competitors publish too, and sometimes the volume estimate was simply wrong. None of that is failure to predict the unpredictable - it's the reason the forecast carries ranges and gets revisited quarterly instead of framed.
What the exercise reliably delivers, even when the totals wobble, is the ranking: which keywords and clusters carry the most expected traffic per unit of effort. That ordering is robust to most input errors - a keyword twice as attractive stays ahead even if both volumes are off by 30% - and it's the actual product. Teams that forecast to prioritize get value every quarter. Teams that forecast to promise a number get one good meeting and a bad one.
The practical takeaway
Volume times calibrated CTR, discounted where AI answers sit, ramped over quarters, summed as a range - and read mainly as a priority list, not a promise. Your own Search Console history is the best input you have, so start there rather than with a template's curve. Then close the loop the way any forecast earns its keep: actuals against the band, monthly, with misses treated as information about which assumption to fix. Search is the most forecastable traffic you have - as long as you forecast it like an estimator, not an optimist.