What is a website analytics dashboard?
The always-on view of your website's numbers. What a good dashboard shows, why most hold too many tiles, and the free routes to one - from GA4's built-in snapshot to a custom Looker Studio page.
The always-on view
A website analytics dashboard is the screen you open to see how the site is doing right now: a handful of numbers and charts, always current, arranged to answer your standing questions at a glance. It's the live half of a pair - the other half is the periodic report, a snapshot written for people who won't open the tool. Dashboard for the operator, report for the stakeholder. Most teams need both and build neither deliberately.
Every analytics product ships one as its home screen, so "do I have a dashboard" is rarely the question. The real questions are whether it shows the right things, and whether anyone looks.
What a good one shows
Which exact metrics fill these slots depends on what the site is for - an ecommerce dashboard swaps in revenue, a content site swaps in read depth. The shape stays the same.
The standing widgets, from the dashboards that get used:
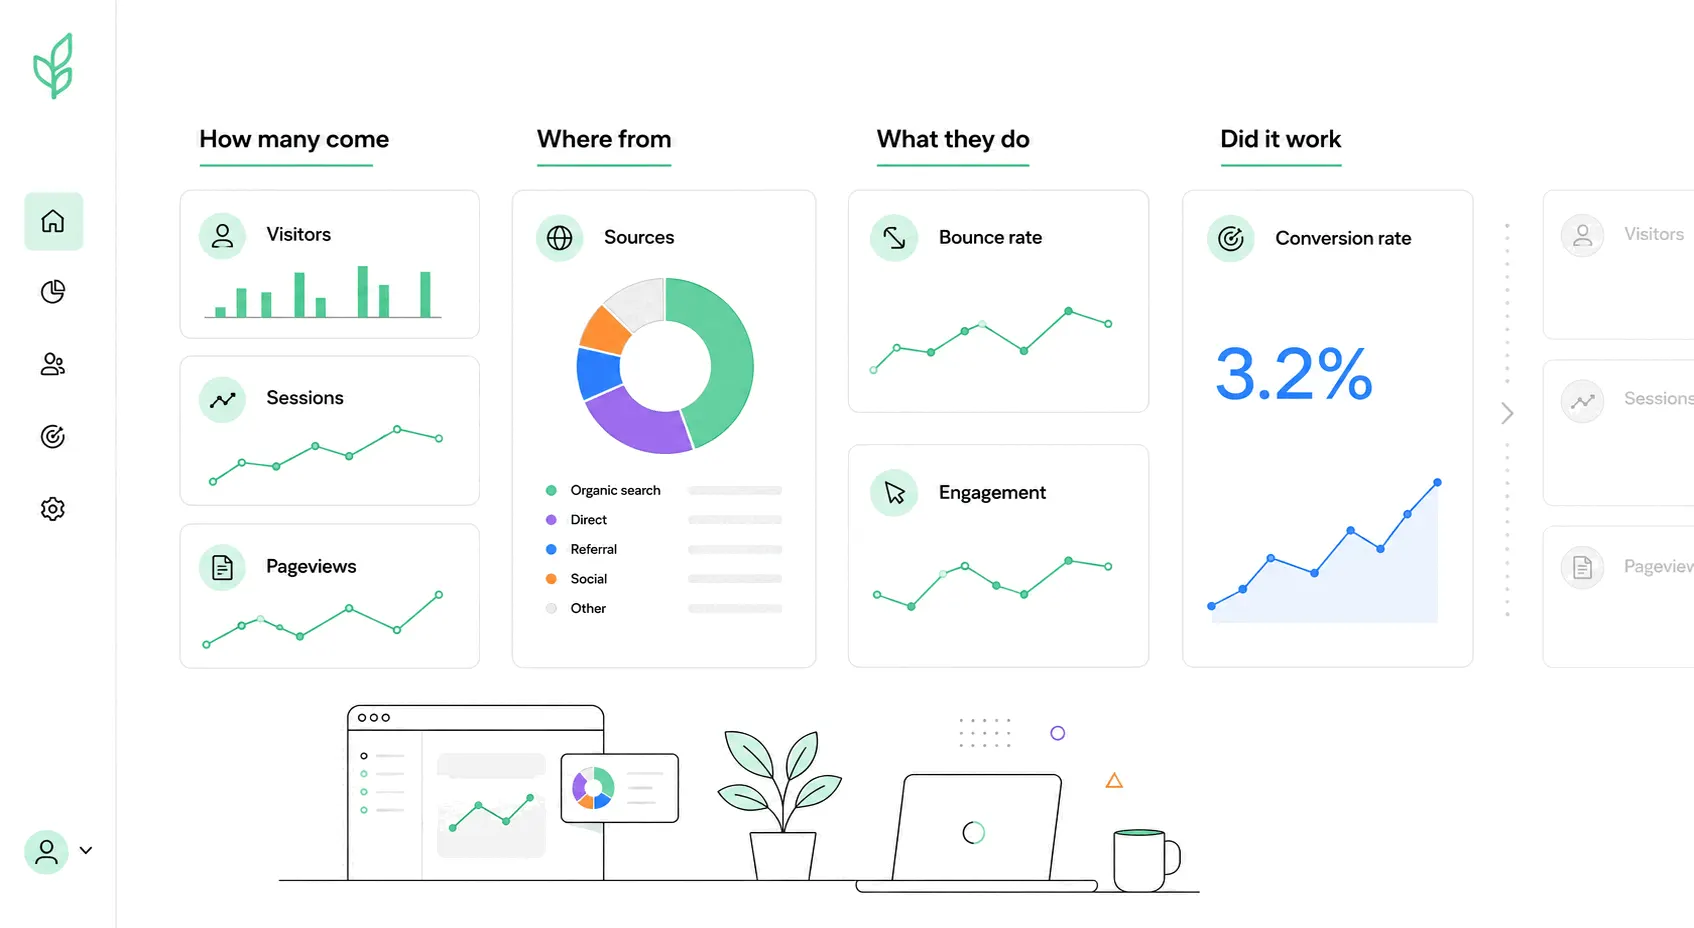
- Visitors or sessions as a trend line - direction over weeks, not today's count in isolation.
- Traffic sources - the channel split, so a moving total comes with its explanation attached.
- Top pages - what people are actually reading or using this week.
- Conversions - count and rate for the site's main action. The tile that makes the rest mean something.
- An engagement number - bounce rate or engagement rate as the smoke alarm.
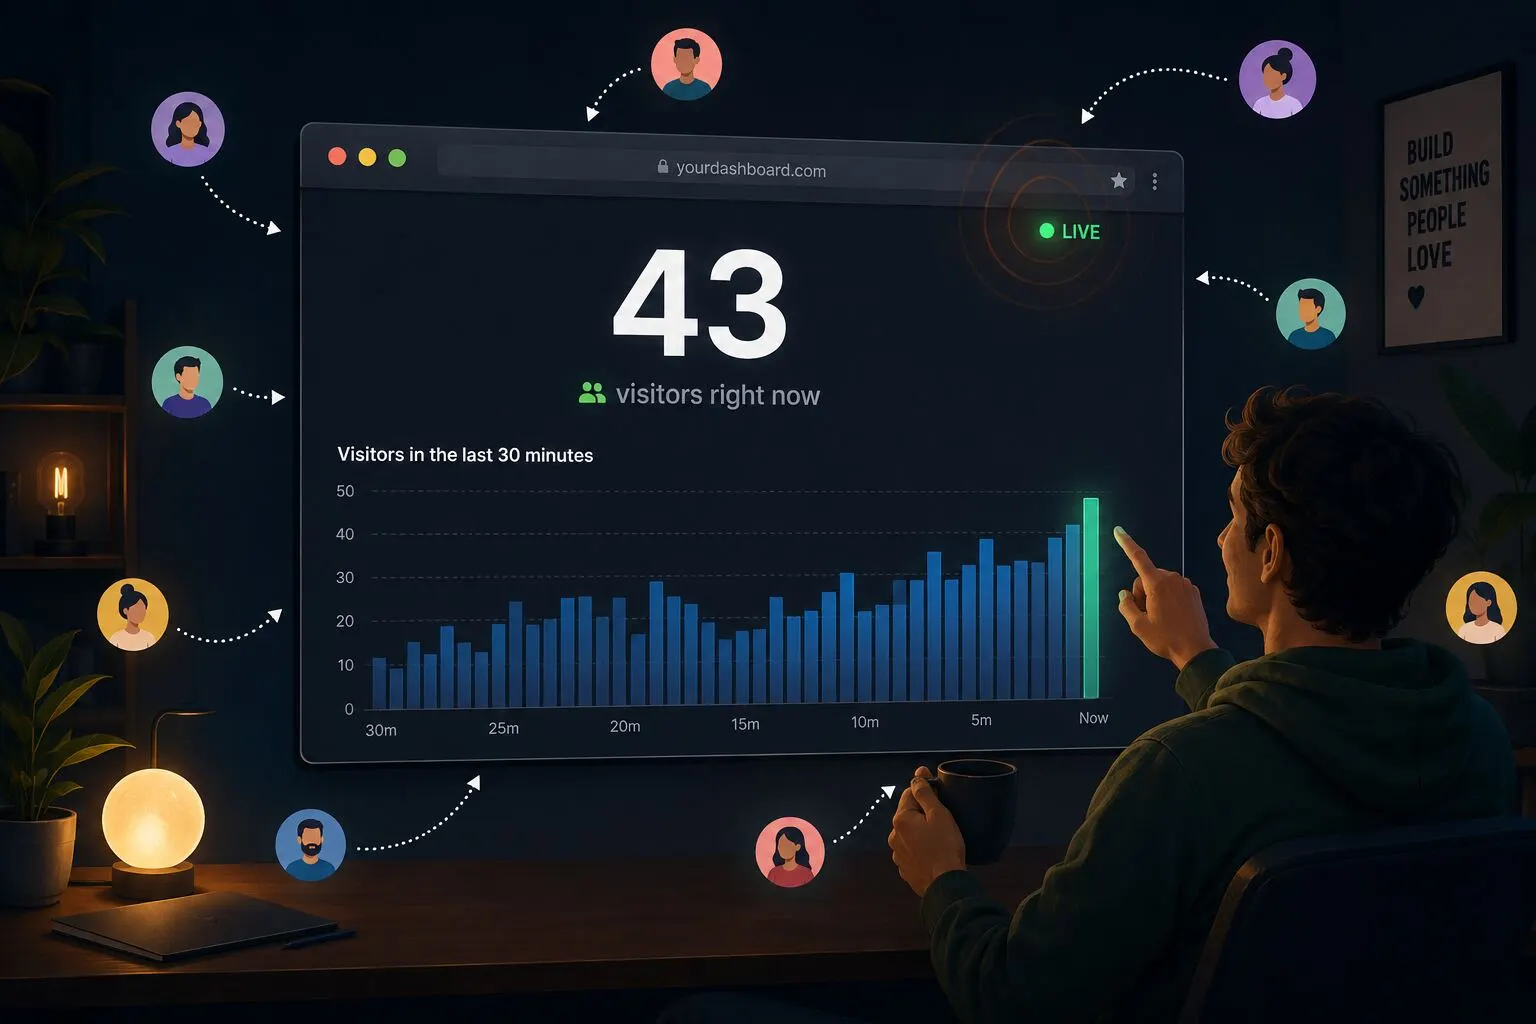
- A real-time counter - who's on the site right now. Operationally thin, honestly the most-watched tile, and the standard way to check tracking is alive.
Fewer tiles than you think
The failure mode of dashboards is abundance. Twenty tiles feel thorough at build time and unreadable ever after, because a screen where everything is displayed prioritizes nothing. Six to eight tiles is the working range. Past that, the eye skims and the anomaly you built the dashboard to catch slides by. A useful test: if a tile changed by a third and nobody would do anything, the tile is decoration.
The same restraint applies to audiences. A marketing team, an owner and a developer want different tiles, and one dashboard trying to serve all three serves none. Better one small screen per audience than a mural.
The dashboard you already have: GA4
GA4's home surface, the Reports snapshot, is a prebuilt dashboard: users, engagement, sources and conversions in fixed cards. In 2026 Google added customizable dashboards - summary cards you pick and filter, up to 15 per dashboard - which softens the old complaint that GA4's home screen showed what Google chose. One caveat: assembling cards still means knowing GA4's metric vocabulary, which is exactly the hurdle that keeps most small-site owners on the default view.
The free custom route: Looker Studio
For a dashboard that looks the way you want, Google's Looker Studio remains the free default. It connects to GA4 natively, builds pages by drag-and-drop, and joins Search Console or Ads data onto the same screen, which no analytics tool's own home view does. Two qualifications: it refreshes on an interval rather than live, and the same-screen convenience means numbers from different tools sitting side by side without agreeing - a footnote on the dashboard saves the recurring conversation.
Beyond that sit the dedicated dashboard products - Geckoboard and Klipfolio (paid, after trials), Databox (a small free tier, then paid). Their pitch is many sources on one wall-mounted screen with none of the assembly. For a single website's numbers, they're more machine than the job needs.
The practical takeaway
Pick the handful of numbers that match your actual questions, put them on one screen, and attach a routine - a weekly look with one question in mind does more than a beautiful dashboard visited never. The tooling barely matters at small scale: GA4's snapshot, a Looker Studio page, or a tool where the default screen is already the dashboard. Bigdelta's take is the last kind - visitors, sources, pages and conversions on one live screen, updating in real time, with alerts when traffic spikes so the dashboard taps you on the shoulder instead of waiting to be opened. Free up to 100K pageviews a month.