Session replay for debugging: reproducing what the user saw
A bug report names the failure without the steps that produced it. How replays with console and network context turn cannot-reproduce tickets into watchable reproductions.
The bug you cannot reproduce
Every developer knows the ticket. A user reports that checkout broke, the report says “clicked pay, nothing happened”, and on your machine the button works perfectly. A 2021 study of non-reproducible bug reports in Firefox and Eclipse opens with the field's rough count: about one in six reported bugs cannot be reproduced from the report alone. The same study found intermittent behaviour and missing information among the leading causes, which surprises nobody who has read a bug report.
The report is not the problem. The reporter saw the failure and described it honestly. What the report cannot carry is everything around the failure: the fourteen clicks before it, the browser it happened in, the half-loaded state of the page, the error that fired quietly in a console the user never opened. Session replay carries exactly that, which is why replay tools have become a debugging instrument as much as a UX one.
What a replay gives you that a report cannot
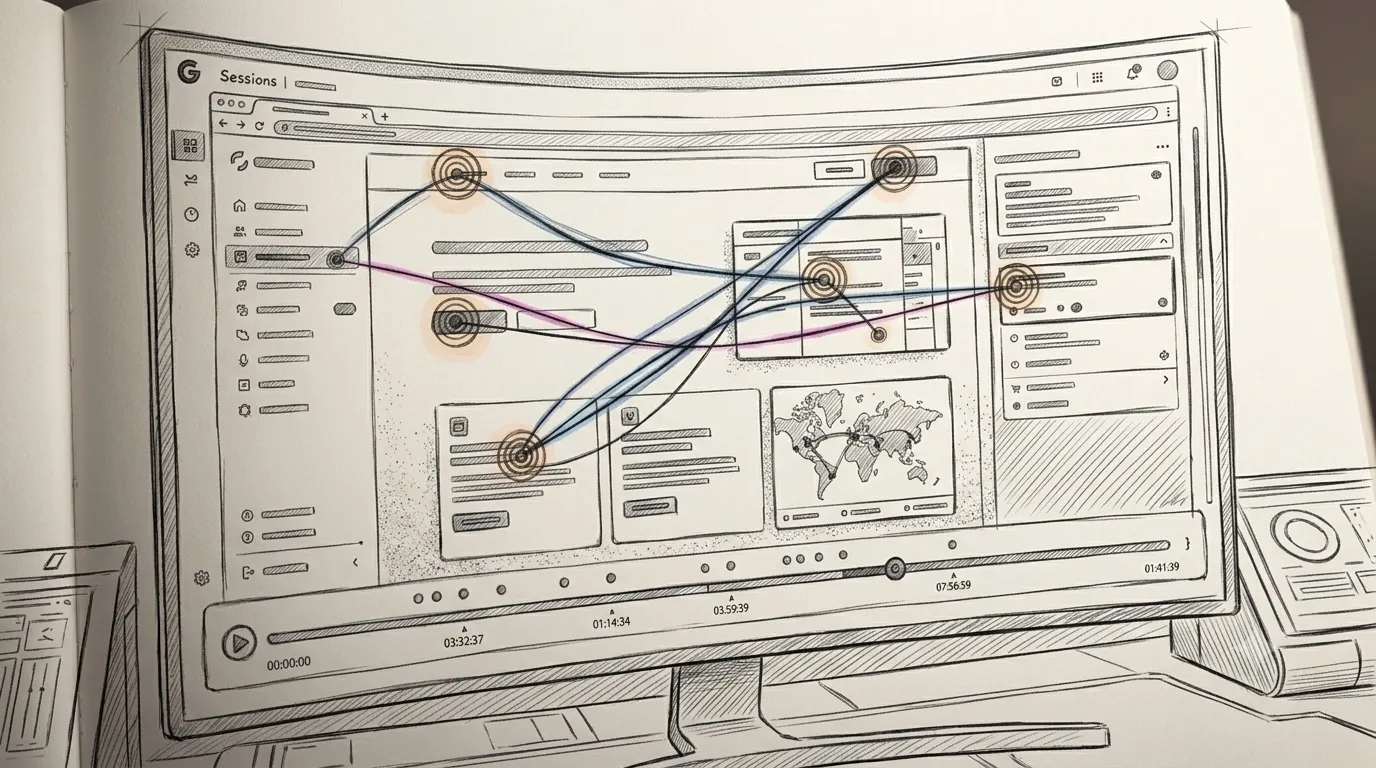
A session replay is a reconstruction of one visit, built from recorded browser events rather than captured video. For debugging, the reconstruction part is the point. The recording is not a movie of pixels but a log of what the page did, so the player can show more than the screen ever displayed.
Watch the session behind a bug report and you get the missing context in one pass. The exact click path, including the back-button dance nobody mentions in tickets. The device, browser and viewport, so “works on my machine” meets the machine it failed on. The timing: what had loaded when the user clicked, and what had not. And the parts of the story the user never saw at all, because most replay tools record the browser console and network activity alongside the visit.
The console and network layer
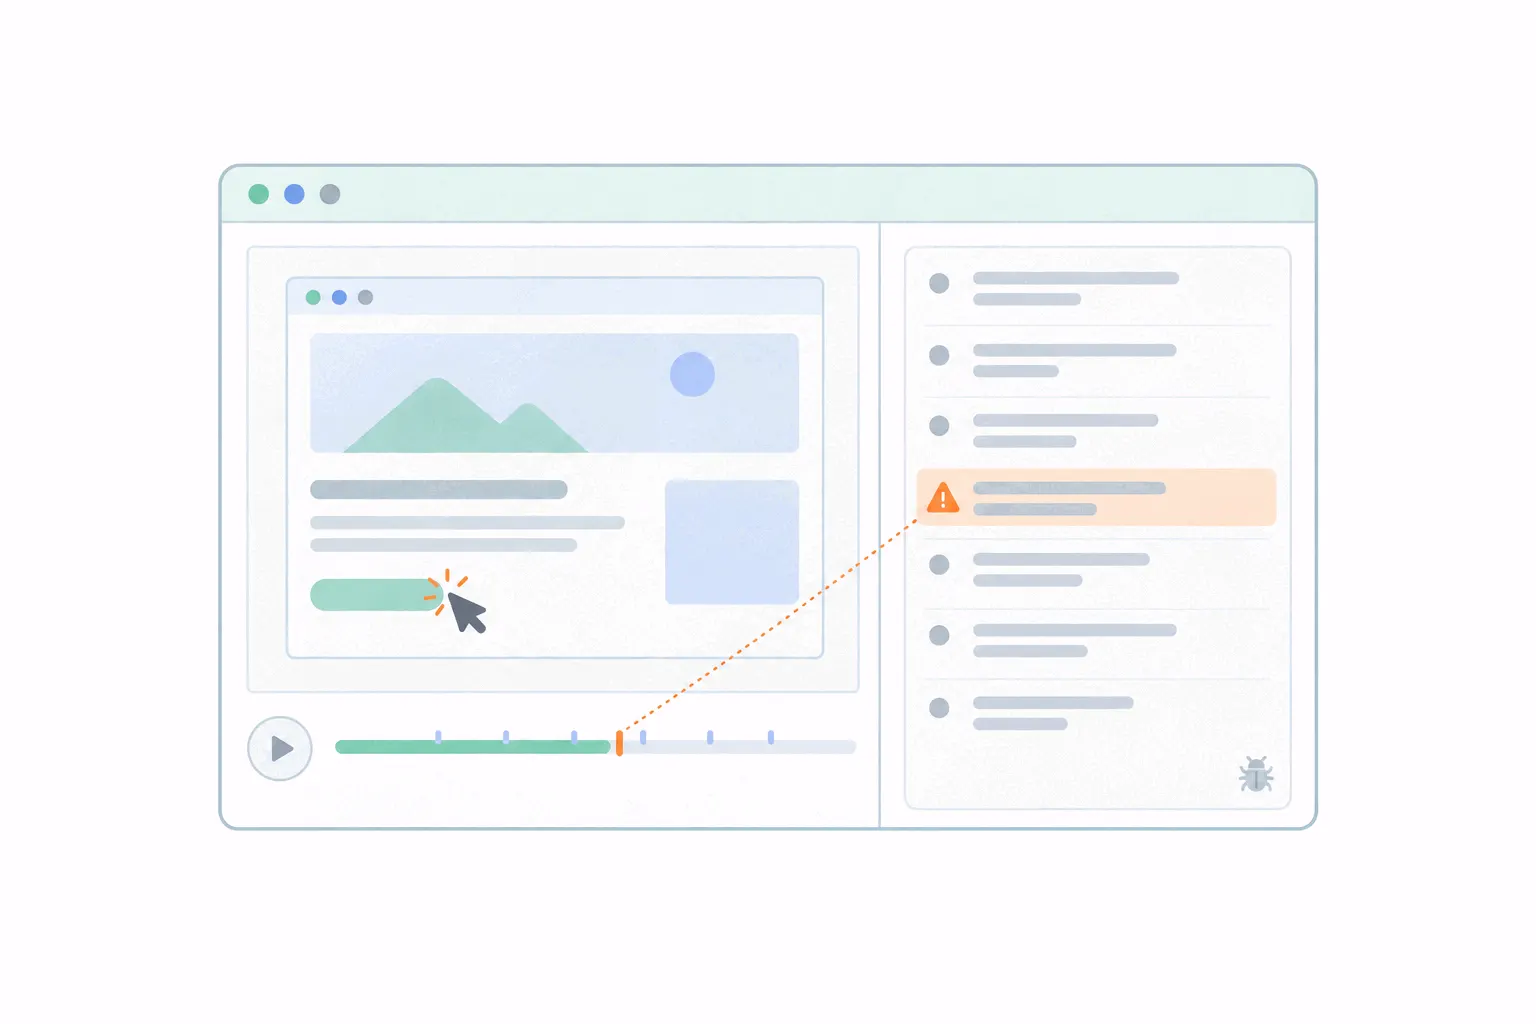
This is the layer that turns a replay from evidence into a diagnosis. One vendor's documentation describes its developer panel as capturing messages from the page's own logging, warnings and errors, plus the requests and responses between the browser and the backend, each synced to the playback timeline so the logs scroll with the visitor's actions. Another describes its recorder as snapshotting the page's structure and tailing every modification with timestamps.
The practical effect: when the user says “nothing happened”, you scrub to the click and read what actually happened. A JavaScript error at the moment of the click. A request that returned an error status. A response that never arrived, on a connection slower than any office network. The user's one-line report and the twenty lines of context now sit in the same player.
Two habits make this layer more useful. Keep meaningful console messages in production code rather than stripping every log, since your own messages become breadcrumbs in the replay. And check what your tool captures by default, because most record request URLs and status codes but not bodies, and truncate long messages.
Filter by error, not by luck
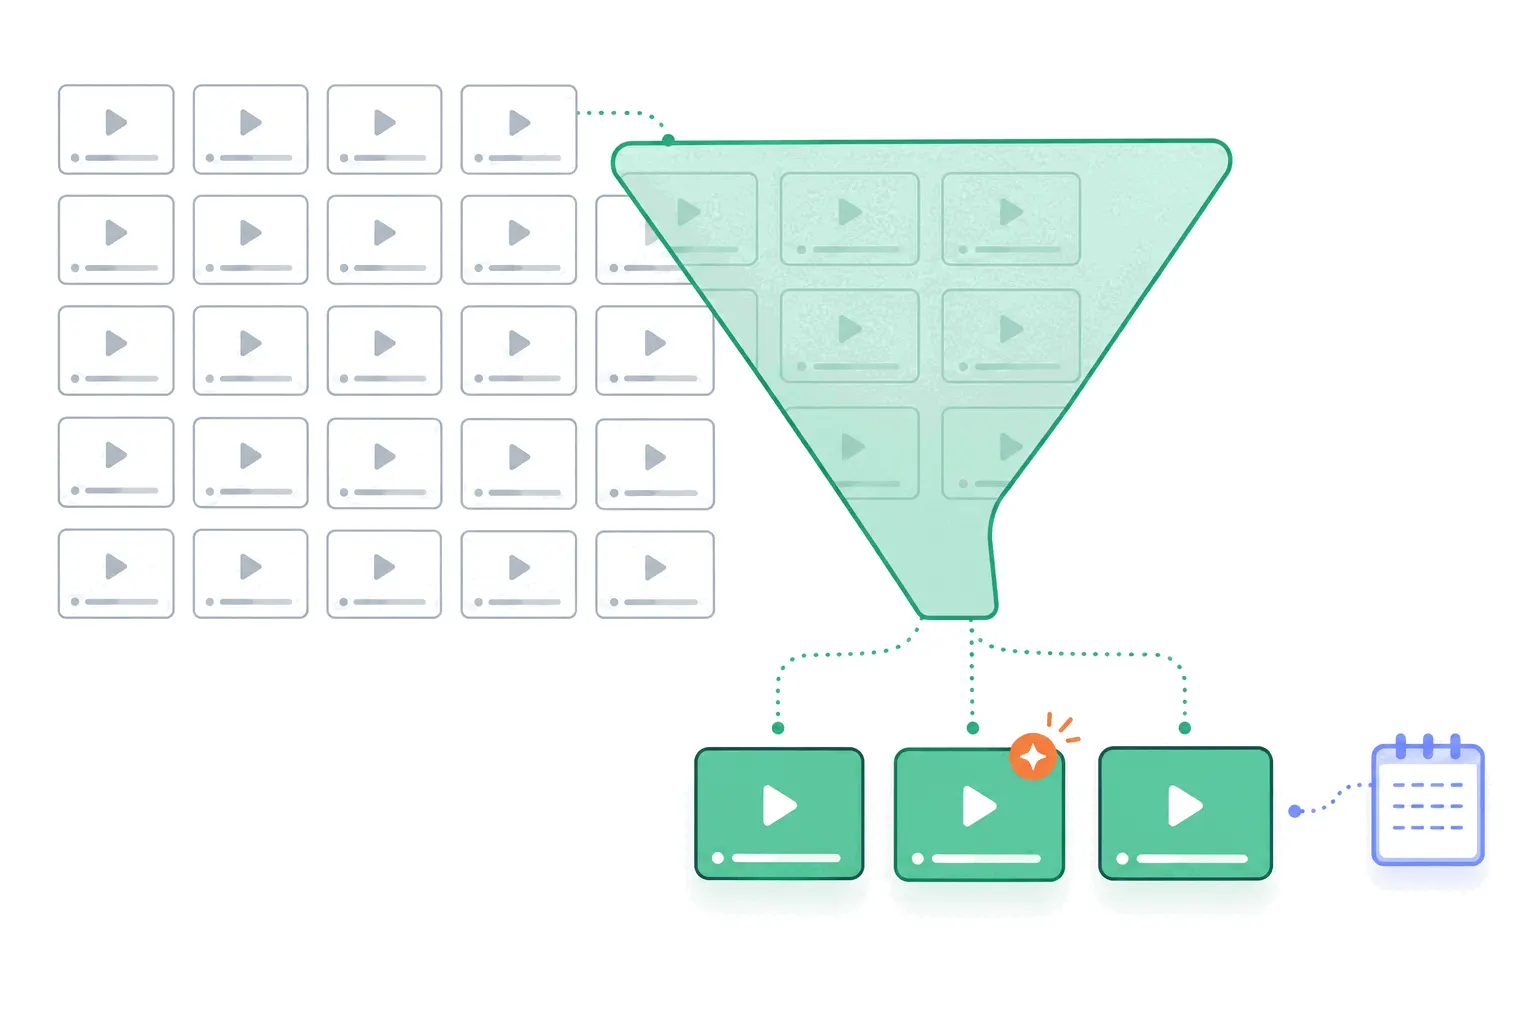
Nobody debugs by watching recordings at random. The workflow that works starts from the failures: most replay tools can filter recordings to sessions where a JavaScript error fired, and to sessions with rage clicks or dead clicks, the click patterns of a visitor meeting a broken control. That inverts the reproduction problem. Instead of trying to make the bug happen, you pull up the list of times it already did.
The error-session list also answers the question a single ticket cannot: how often. One report might be a broken extension on one laptop. Forty error sessions on the same element this week is a bug with a body count, and the triage routine for working through a filtered list is the same as for any recording review: a handful of sessions, watched for the common shape.
What to look for in the playback
Reading a failure session is quick once you know the order. First scrub to the error or the flagged click and watch the ten seconds before it, because the cause usually sits earlier than the symptom. Note the state: what was on screen, what was still loading, which step of the flow the user had reached. Then read the console and network entries at that timestamp. Then check the environment bar for browser, device and viewport, since layout-dependent and browser-specific bugs announce themselves there.
Then watch one or two more sessions with the same error. The bug is the part that repeats. Everything else is one user's weather.
What replay does not replace
Replay is the reproduction step, not the whole observability stack. Error monitoring tools still do the aggregate half: counting errors across every session, alerting when a release spikes them, grouping stack traces. A replay tool samples or stores a window of sessions, so the error monitor notices the fire and the replay shows how it started. Backend failures also live mostly out of frame. A replay shows the request that failed from the browser's side, and the server logs still own the question of why.
The honest division of labour: logs and error monitoring tell you that and how often, the replay shows you how, and the fix still comes from the code.
The support loop
The second debugging workflow runs through the support inbox. A user writes in about a failure, support looks up that user's sessions, and the developer watches the exact visit that produced the complaint instead of opening a reply-thread investigation. The back-and-forth of “what browser are you on, can you send a screenshot, does it happen in incognito” collapses into one link.
The link is the underrated part. Most tools let you share a session at a timestamp, so the handoff from support to engineering is “watch from 2:41” attached to the ticket, and everyone who opens it sees the same failure. In teams that work this way, the replay link becomes the standard attachment on frontend bugs, the way a stack trace is on backend ones.
What about the data in the replay?
Debugging with recordings does not mean reading what users typed. Replay tools mask text inputs, passwords and payment fields by default, so the session shows the form failing without showing what was in it. The GDPR checklist for session replay covers the consent and configuration side, which applies to debugging use as much as UX use.
Picking a tool with debugging in mind
If reproduction is a main use case, four capabilities separate the tools, and the replay tool roundup names the options.
- Console and network capture, synced to the timeline, since a replay without them shows the symptom and hides the cause.
- Error filtering, so sessions with a JavaScript error, a rage click or a dead click surface without watching anything at random.
- Shareable, timestamped links, because reproduction is a team sport and the replay has to travel to the person who will fix it.
- Enough retention to cover your release cycle, since a bug reported Friday needs Tuesday's sessions still watchable.
A workflow to steal
The teams that get the most from replay debugging run the same small loop. Filter to error sessions once a day or after each release, and treat a new repeating error as a ticket even before a user reports it. When a user does report something, find their session first and reply second. Attach the timestamped link to every frontend ticket. And when the fix ships, check the error-session list again, because the list going quiet is the only proof a reproduction-resistant bug is actually dead.
Bigdelta was built for this loop: replays filter by error so you watch the session where it happened instead of asking users for screenshots, the player shows console and network activity while the session plays out, and any session shares as a timestamped link for the bug report. The same one-script install covers the analytics and heatmaps around it.
None of this replaces reading code. It replaces the guessing that comes before reading code, which is where the afternoons go.