How to add heatmaps to a Shopify store
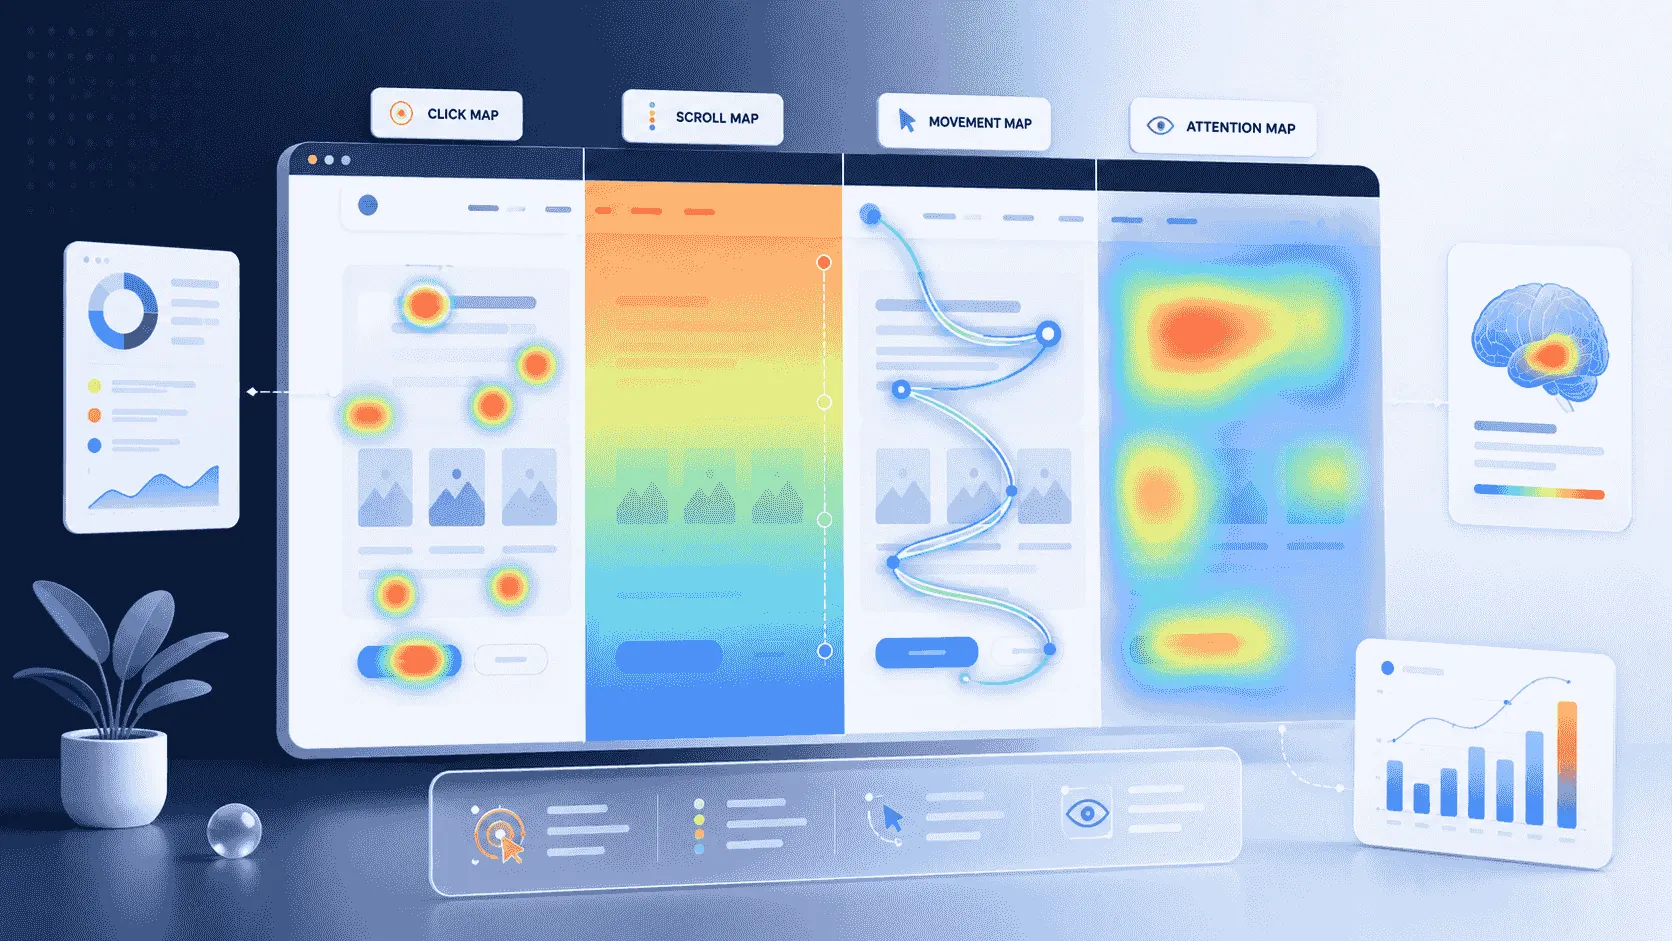
Shopify's reports tell you what sold - a heatmap shows how shoppers used the pages along the way. The two install routes, the tools with real Shopify apps, and the checkout limitation nobody's listicle mentions.
What Shopify gives you, and what it doesn't
Shopify's built-in analytics is genuinely decent at the commerce layer: sales, sessions, conversion rate, top products, all in the admin's reports. What it doesn't have, on any plan, is behavior visualization - no heatmaps, no scroll maps, no way to see where shoppers clicked on a product page or how far down a collection they browsed. The reports tell you that 2% of sessions bought, but they can't show you what the other 98% did on the way out.
That's the gap heatmaps fill, and on an ecommerce store the payoff is concrete: whether shoppers reach the reviews you paid to collect, whether the size guide gets found, what actually gets tapped on a collection page, where the checkout path leaks. Adding one to Shopify takes minutes. Choosing the route and the tool - and knowing the one hard limitation - takes this guide.
The modern install route: an app embed
Since Online Store 2.0, the clean way to add any tracking script to Shopify is a theme app extension: install the tool's app from the Shopify App Store, and it registers an app embed you toggle on under Online Store > Themes > Customize > App embeds. The script loads on every storefront page, nothing in your theme's code is touched, and uninstalling actually removes it - the historical Shopify problem of orphaned script tags rotting in themes goes away.
This route is why "does the tool have a Shopify app?" is a real selection criterion here, unlike on most platforms. An official app means one-click install, embed-block management and support that knows what a .myshopify domain is.
The app-embed install, concretely:
- Find the tool's app in the Shopify App Store and install it into your store - it will ask for the permissions its script needs.
- Follow the app's connect step (usually signing into or creating your account with the tool).
- Go to Online Store > Themes > Customize, open App embeds in the left panel, and switch the tool's embed on.
- Save, then visit your storefront and confirm the visit appears in the tool - most show a live view within a minute or two.
- Browse a product page, add to cart, and check the tool captured those actions before you trust anything it reports.
The legacy route: a snippet in the theme
Any tool without a dedicated app installs the way everything did for a decade: paste its snippet into the theme's code, in theme.liquid just before the closing head tag. It still works fine, with the honest caveats - you're editing the theme (duplicate it first), the edit needs re-applying if you switch themes, and removal is manual. On a store run by one careful person this is a five-minute job. On a store where themes get changed by whoever's around, the app-embed route earns its preference.
Either route covers the storefront: home, collections, products, cart, blog. Which brings us to the page neither route fully covers.
The theme route, concretely, for a tool without an app:
- Duplicate your live theme first (Online Store > Themes > three-dot menu > Duplicate) - your undo button for everything below.
- Open the code editor (same menu > Edit code) and find theme.liquid under Layout.
- Paste the tool's snippet just above the closing </head> tag and save.
- Visit the storefront and confirm the tool sees you, then click around a product page so it has something to map.
- Leave the duplicate theme in place for a week, then delete it once the install has proven boring.
The checkout wall
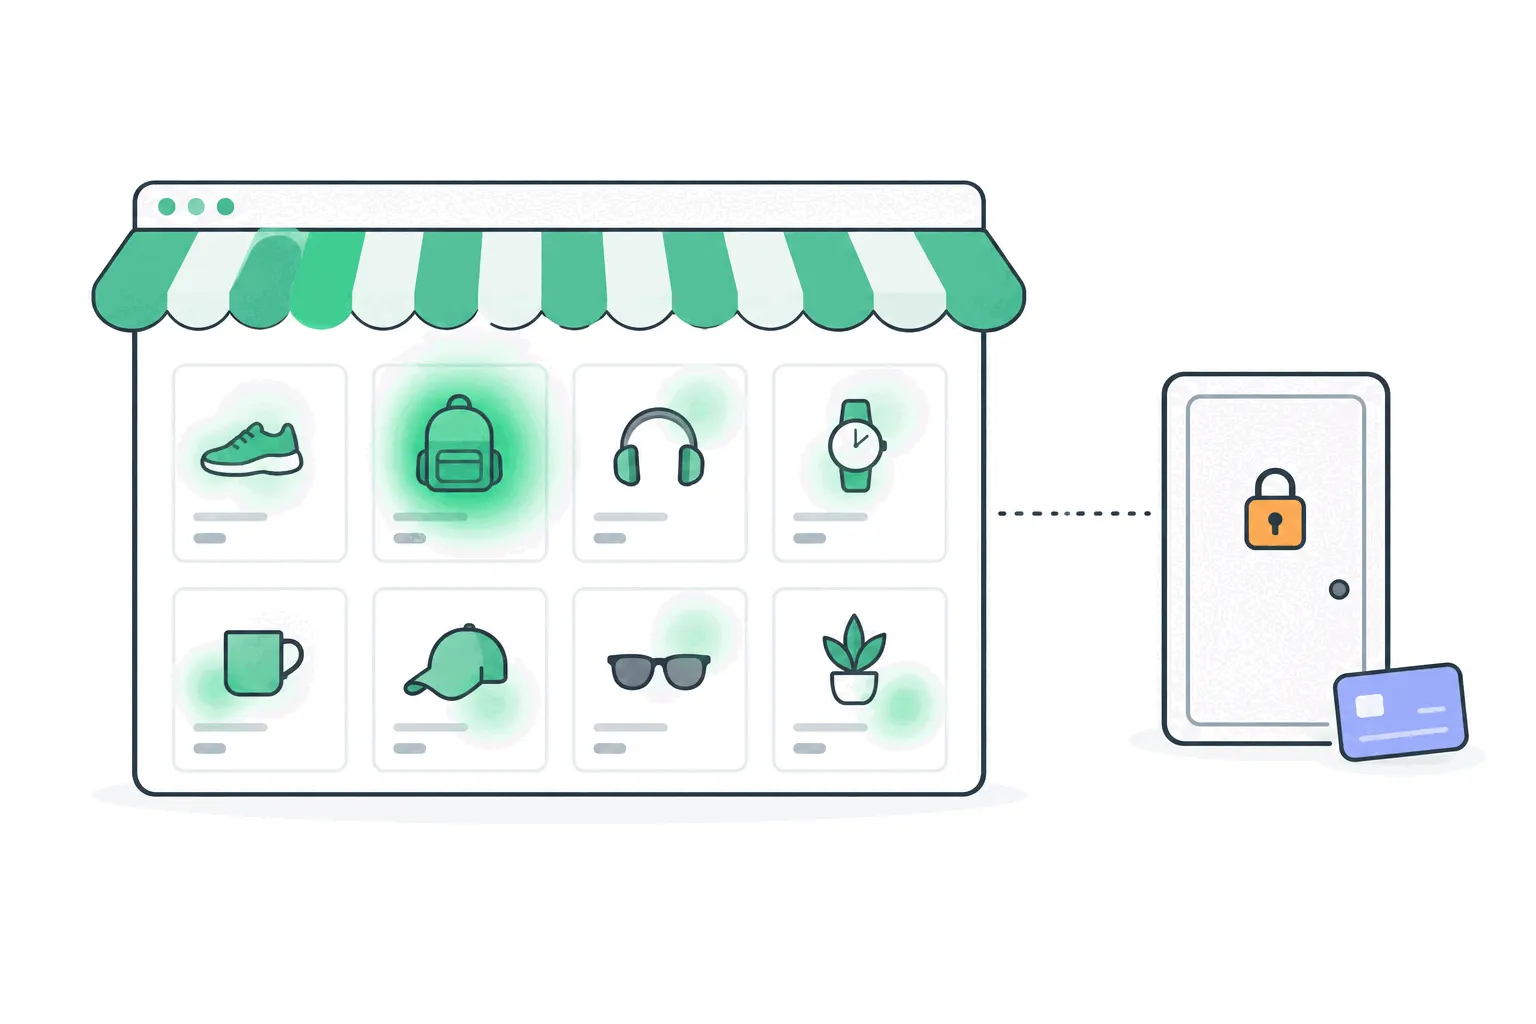
Here's the limitation most Shopify heatmap listicles skip: on standard Shopify plans, your checkout pages don't run third-party scripts. Shopify locked checkout down as part of its extensibility overhaul - the old script access was deprecated, with remaining legacy access shut off in August 2026 - so a heatmap tool installed by either route above records up to the moment a shopper enters checkout, and goes dark there. Checkout customization and deep checkout tracking are Shopify Plus territory.
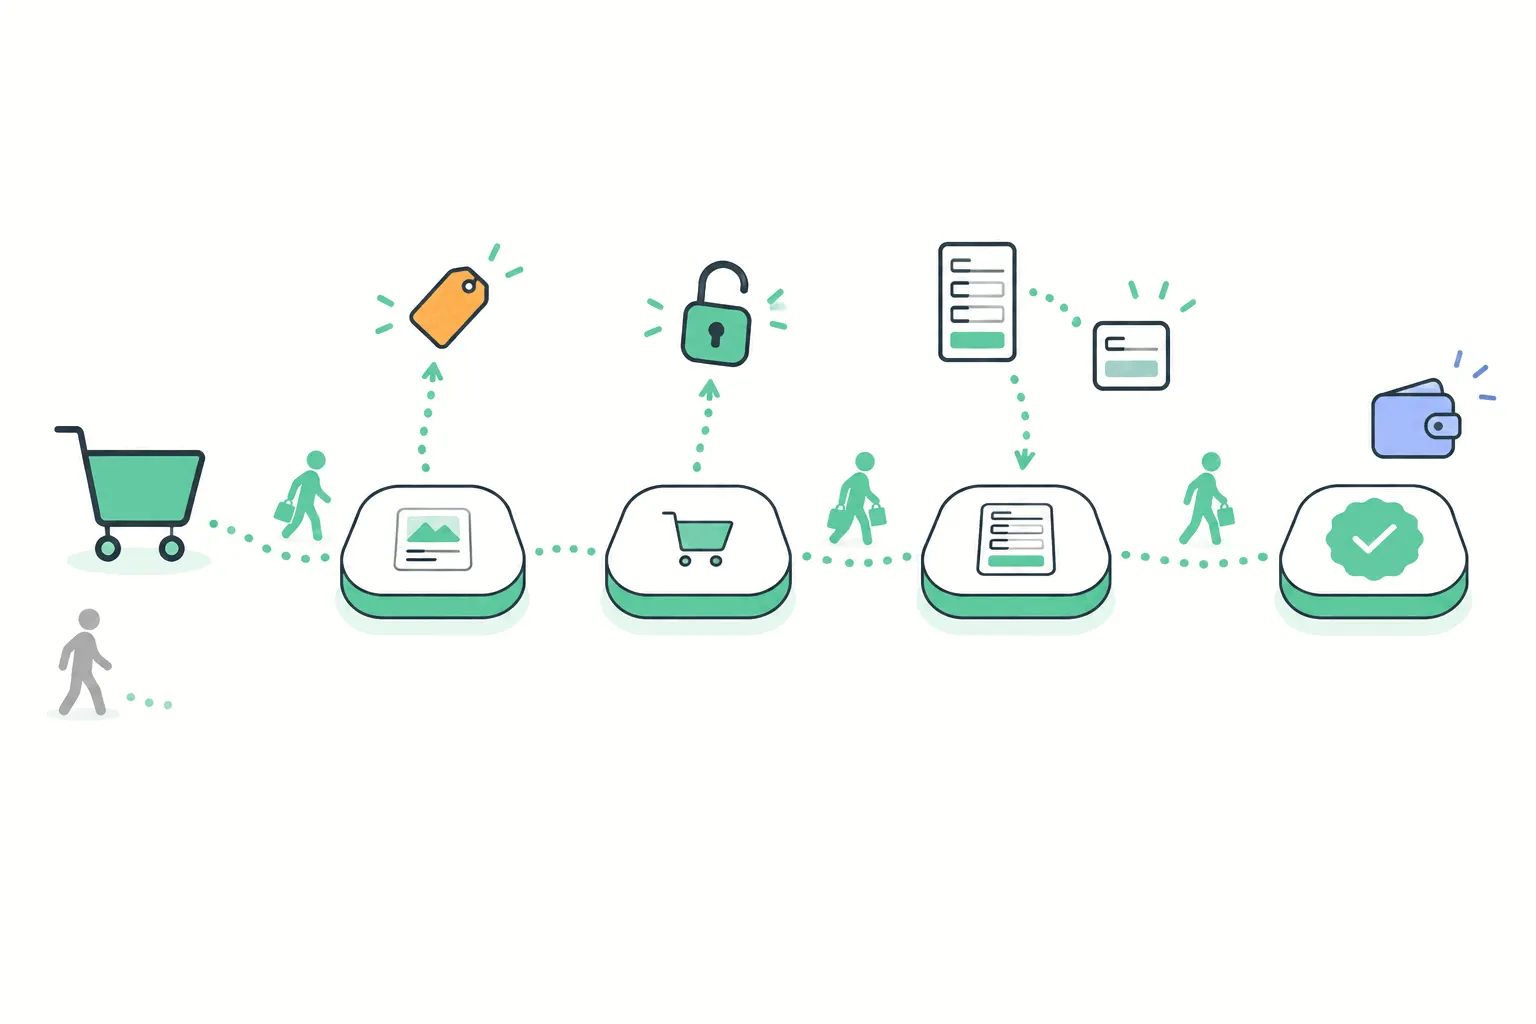
What you still get on a standard plan: everything up to and including the cart, plus checkout entry and completion as events - so funnel numbers for checkout survive, and the thank-you page comes back into view after purchase. What you don't get is footage or click maps of the checkout form itself. Plan around it: on standard Shopify, heatmaps are a storefront instrument, and the checkout's leaks show up in the numbers rather than the pictures. Treat any tool claiming full checkout recordings on a non-Plus store with suspicion.
The tools, by how they arrive on Shopify
Microsoft Clarity has an official free Shopify app and is the obvious first install: heatmaps, recordings and frustration signals at no cost, app-embed managed, with a lightweight script. Lucky Orange runs a dedicated Shopify app too, popular with merchants because it bundles replays, funnels and surveys in the low-$30s monthly range. Hotjar - now Contentsquare - notably has no official Shopify app - it installs via the snippet route or third-party installer apps, which is worth knowing before you follow a 2023 tutorial.
Bigdelta's Shopify app - ours, so judge accordingly - installs the combined stack from the App Store: web analytics, heatmaps, session replays, funnels and customer profiles in one install, with a free tier and traffic-based plans above it. The store-specific advantage is the data joins: the app connects to Shopify's own order and checkout data, so abandoned carts and the revenue view sit next to the behavior maps - the checkout wall limits what scripts can see, not what Shopify shares with apps through its own APIs. Fair disclosure for a listing this new: it launched in September 2026, so the review count won't reassure you yet - the free tier is the cheap way to let the product do that instead.
What store heatmaps actually show you
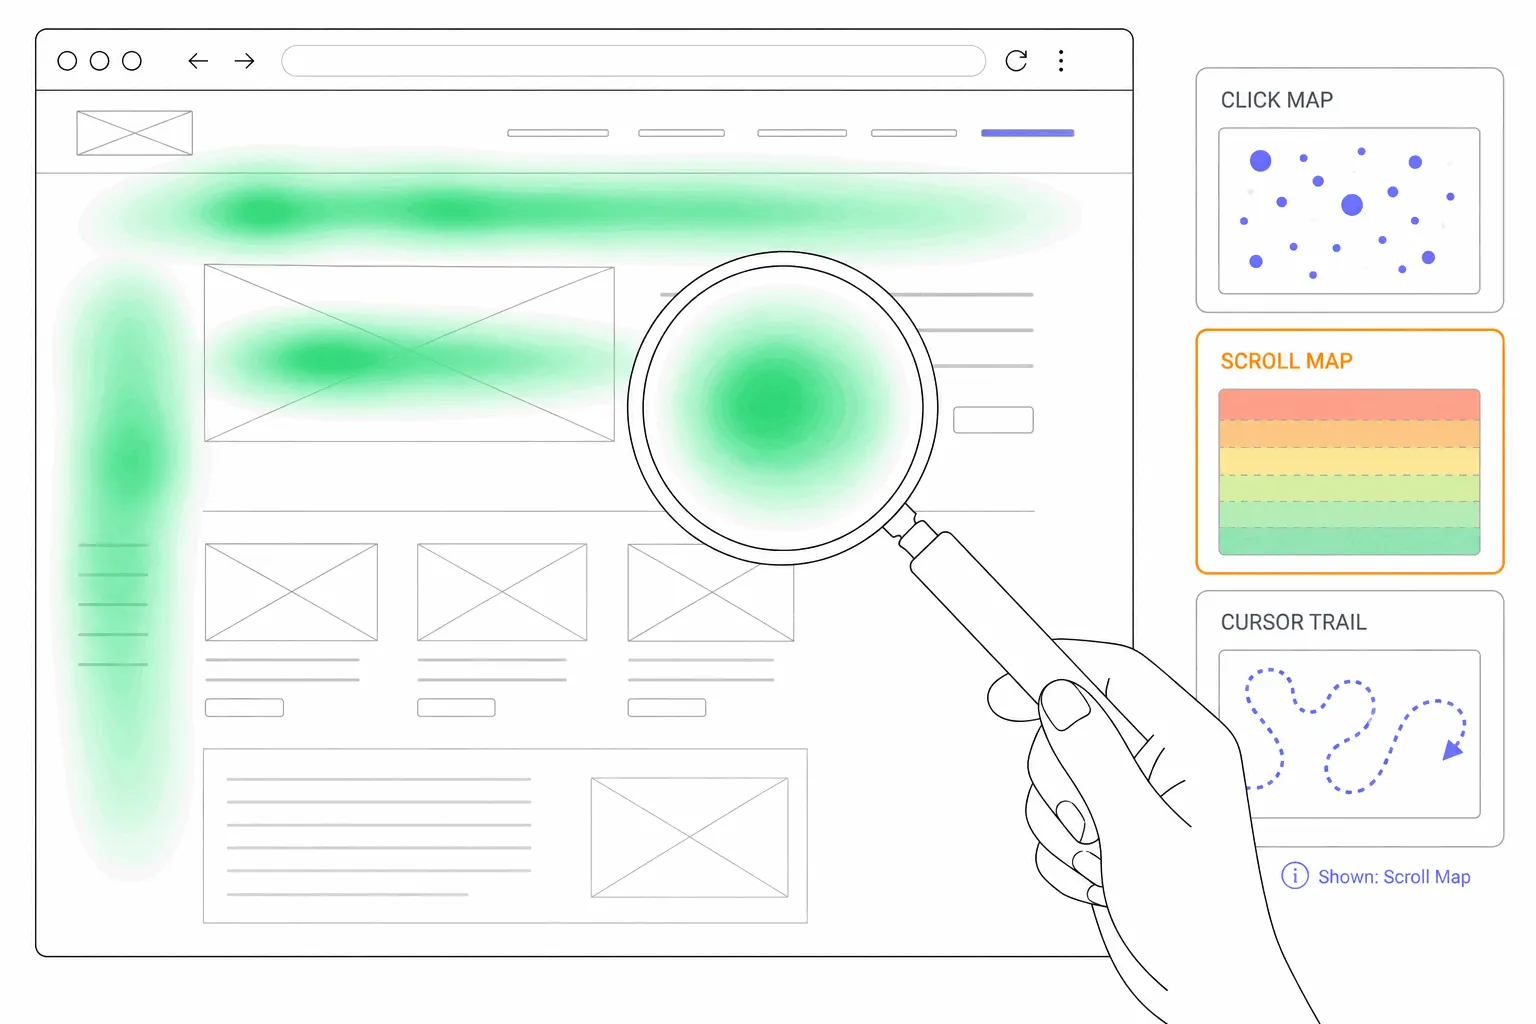
Product pages are where heatmaps earn their keep on a store. The scroll map answers whether shoppers ever reach the reviews, the shipping info, the size guide - the content merchants fight to add and then bury. The click map shows what gets tapped: variant swatches, image galleries, the accordion sections, and - the classic finding - product photos that shoppers try to click when they aren't clickable. Collection pages answer a different question: how deep shoppers browse before choosing or leaving, and whether your sort order matches where the clicks actually go.
Mobile deserves its own reading, not a footnote: most store traffic is on phones, thumb reach shapes what gets tapped, and a desktop-combined map describes a store nobody visits. Split by device before concluding anything - and give any page a few thousand views before trusting its pattern.
Will a heatmap slow the store down?
Store owners guard their speed scores jealously, and rightly - so the honest answer: a heatmap script is one more thing every shopper downloads, and the cost varies by tool. Clarity's script is a lightweight one (Microsoft cites it in the tens of kilobytes, loading asynchronously), while replay-heavy suites carry more. Async loading means none of them block the page from rendering, so the felt impact is usually small - but "usually small" is a claim to verify, not trust.
The verification is the same one we recommend on WordPress: measure your product page's speed before installing and after, with the same tool, and let the numbers decide. And resist stacking - a store running a heatmap app, a replay app, three marketing pixels and a reviews widget has a scripts problem no individual vendor caused. One behavior tool, chosen deliberately, is the version of this that stays cheap.
Shopify-specific data gotchas
None of these are fatal. They're the difference between a map you can trust at a glance and one that needs a caveat nobody remembers.
Three quirks of how stores are built that quietly distort heatmaps:
- Dynamic content - variant pickers, quick-view modals and slide-out carts change the page under the map, so clicks on a modal can render as clicks on whatever sat behind it. Prefer replays for modal-heavy flows, maps for the stable page.
- URL variants - localized domains, currency parameters and collection filters can split one template's traffic across many URLs, thinning every map. Check whether your tool aggregates by template or exact URL.
- Your own team - a store's staff visits its product pages constantly. Exclude office IPs or logged-in staff, or the merchandising team becomes your hottest heatmap zone.
How long to wait, and when the maps lie
Store traffic has rhythms that distort a young heatmap. Give any template a few thousand views before reading it, and be suspicious of maps collected across a discount event - sale-period shoppers behave differently enough that a map spanning Black Friday describes neither your normal customers nor your sale ones. The same goes for maps spanning a theme change: reset after any redesign, because averaged layouts produce fiction.
A practical cadence for a typical store: check the product-page maps monthly, collection pages quarterly, and any page you just changed after it has collected a couple of weeks of normal-season traffic. More often than that and you're reading noise. Less often, and the maps go stale under theme tweaks nobody logged.
From map to money
The install is the easy half - the payoff comes from reading the maps like evidence and acting. The ecommerce-shaped loop: pick one high-traffic template (usually the product page), read its scroll and click maps against one question - do shoppers reach and use the elements that drive purchase? - change the one thing the map indicts, and watch the conversion number for that template rather than the store's overall rate. Pair the maps with replays of abandoned sessions when the map shows where but not why.
And keep the checkout honest despite the wall: you can't heatmap it on a standard plan, but the begin-checkout-to-purchase funnel tells you when it's the problem, and checkout's own settings - not scripts - are where standard-plan fixes live.
The practical takeaway
Shopify has no built-in heatmaps, adding one takes an app embed or a snippet, and the honest constraint is the checkout: storefront pages map beautifully, the payment flow stays behind glass below Plus. Start free with Clarity's official app if you just want maps, or with Bigdelta's app if you want the maps living next to your visitor, replay and revenue numbers in one install. Either way, point the first month at your product page template with one question in hand - that's where a store's heatmap budget pays back first.