What is ecommerce analytics?
Ecommerce analytics ties every visit to what it was worth in orders and revenue. Which numbers matter for a store, where the data comes from, and how to read it without a data team.

The short answer
Ecommerce analytics is the measurement of how visits to a store turn into money: which products get viewed, what lands in carts, which carts survive checkout, what an order is worth, and whether the buyer ever comes back. It's web analytics with a revenue dimension attached — the same visits and traffic sources, joined to orders, products and repeat purchases.
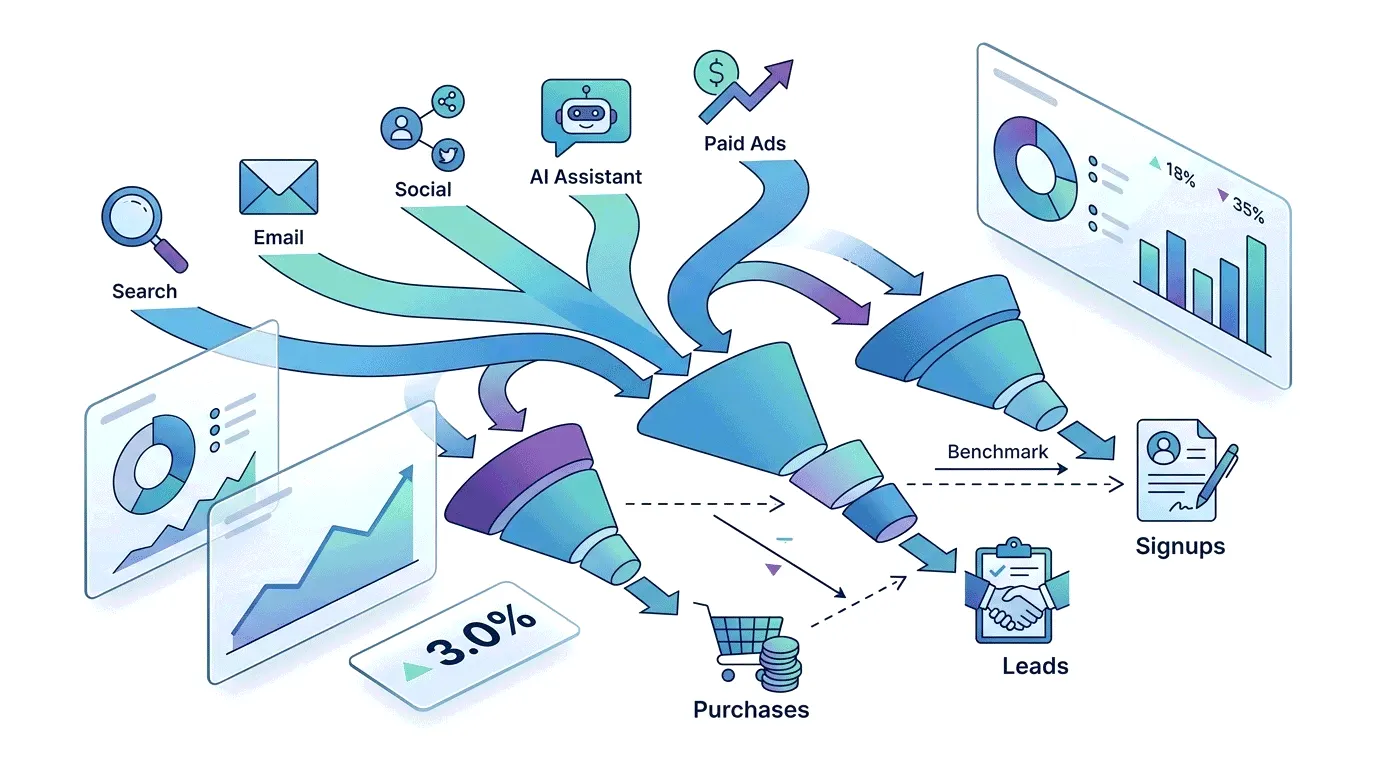
That join is the whole point. Traffic numbers alone can flatter a store into bad decisions: a channel that sends thousands of visitors and no buyers looks like a success in a pageview report and a money pit in a revenue-by-source report. Ecommerce analytics exists so the second report is the one you look at.
How is it different from regular web analytics?
Regular web analytics answers questions about attention — how many people came, from where, and what they looked at. Ecommerce analytics answers questions about outcomes: how much revenue each channel produced, which products convert browsers into buyers, and what share of customers order twice.
One formula shows the bridge between the two worlds. Revenue per visitor equals conversion rate times average order value — attention on one side of the equals sign, money on the other. When revenue drops, that decomposition is the first diagnostic: fewer visitors, a lower conversion rate, or smaller orders are three different problems with three different fixes, and a store that only watches traffic can't tell them apart.
Which ecommerce metrics actually matter?
Most stores can run on a shortlist. Conversion rate is the share of visits that end in a purchase — online stores typically convert low single digits of their traffic, and the benchmarks post covers what's normal by industry and traffic source. Average order value — revenue divided by orders — is the lever people forget: growing the average order 10% is often easier than growing traffic 10%, and it's why bundles and free-shipping thresholds exist.
Cart and checkout abandonment is the share of started carts that never become orders. Roughly seven in ten carts are abandoned across the industry, which sounds catastrophic and is mostly normal browsing; the checkout abandonment post covers the benchmarks and the fixable part.
Repeat purchase rate and customer lifetime value measure whether buyers come back, and what a customer is worth over their whole relationship with the store rather than at first checkout. These two decide how much you can afford to spend acquiring a customer, which makes them the quiet ceiling on every ad budget. And revenue by traffic source is the report that reconciles marketing with reality: each channel shown with the orders and revenue it produced beside the sessions it delivered.
Where does the data come from?
Three places, usually in combination. The first is your store platform: Shopify, WooCommerce and the like know about every order natively — Shopify's built-in reports cover sales, customers and conversion out of the box. The platform's numbers are the source of truth for revenue, but they see little of the behavior before the order: which channel first brought the buyer weeks earlier, or what non-buyers did before leaving.
The second is a general analytics tool taught about commerce. GA4 tracks pageviews on its own, but ecommerce is manual: your store has to send it a specific vocabulary of events — view_item, add_to_cart, begin_checkout, purchase, each carrying an items array with product details — before any monetization report shows a number. Store platforms ship integrations that fire these for you; custom storefronts need a developer. The reward for the setup is behavior and revenue in one place.
The third is a lightweight analytics tool with commerce built in. Simpler web analytics tools increasingly ingest orders directly, skipping the event-vocabulary homework — Bigdelta, for example, shows orders and revenue next to the visits that produced them, computes conversion per page and per channel, and tracks the product-to-cart-to-checkout path with a custom event for anything else that matters, from the same one-script install as its analytics.
Why don't my revenue numbers match across tools?
Because every tool counts differently, and none of them is lying. Your ad platforms claim credit under their own attribution windows, which is its own can of worms. But even between your store and your analytics tool, definitions drift: one includes tax and shipping in "revenue" while the other doesn't, one subtracts refunds automatically while the other never hears about them, and orders land on different timestamps in each system. A steady gap between two tools is almost always a definition mismatch, not missing sales — worth diagnosing once, then living with.
How do you actually use it?
The practical loop is narrow. Watch revenue, conversion rate and AOV weekly against your own history — trend beats benchmark. When conversion slips, walk the funnel: product page to cart to checkout to payment, and find the step where the drop concentrates. Then get specific about that step — for stores with session recordings, that means watching the visits that abandoned there to see the surprise shipping cost or the failing coupon field firsthand. Fix, watch the same numbers, repeat.
The mistake to avoid is the other loop: checking every metric daily, comparing each to a published benchmark, and reorganizing the store around whichever number looked worst that morning. Benchmarks vary wildly by vertical and channel; your own last quarter is the comparison that pays.
The practical takeaway
Ecommerce analytics is web analytics with orders attached: the same visitors, now with a purchase trail. The core kit is five numbers — conversion rate, average order value, abandonment, repeat rate, revenue by source — fed either by your store platform, by a general analytics tool taught the commerce event vocabulary, or by a lightweight tool that ingests orders directly. Read them weekly, against your own history, and let the funnel tell you where the money leaks before you redesign anything.