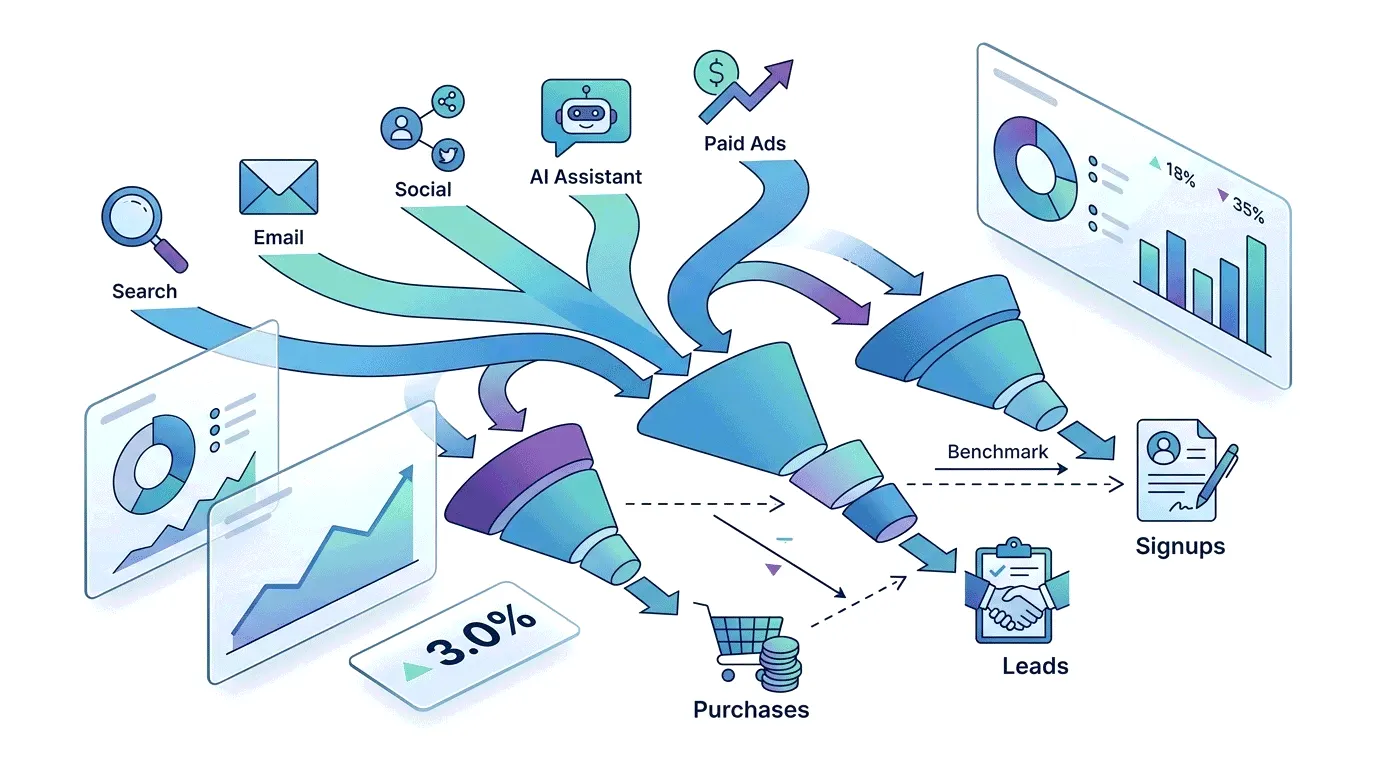
Ecommerce funnel benchmarks by step
Per-step figures exist, but they come from different panels, years and denominators, and the tidy composite funnels on ranking pages are stitched from exactly that mismatch. The disclosed numbers, step by step, and the one funnel measured on a single panel.
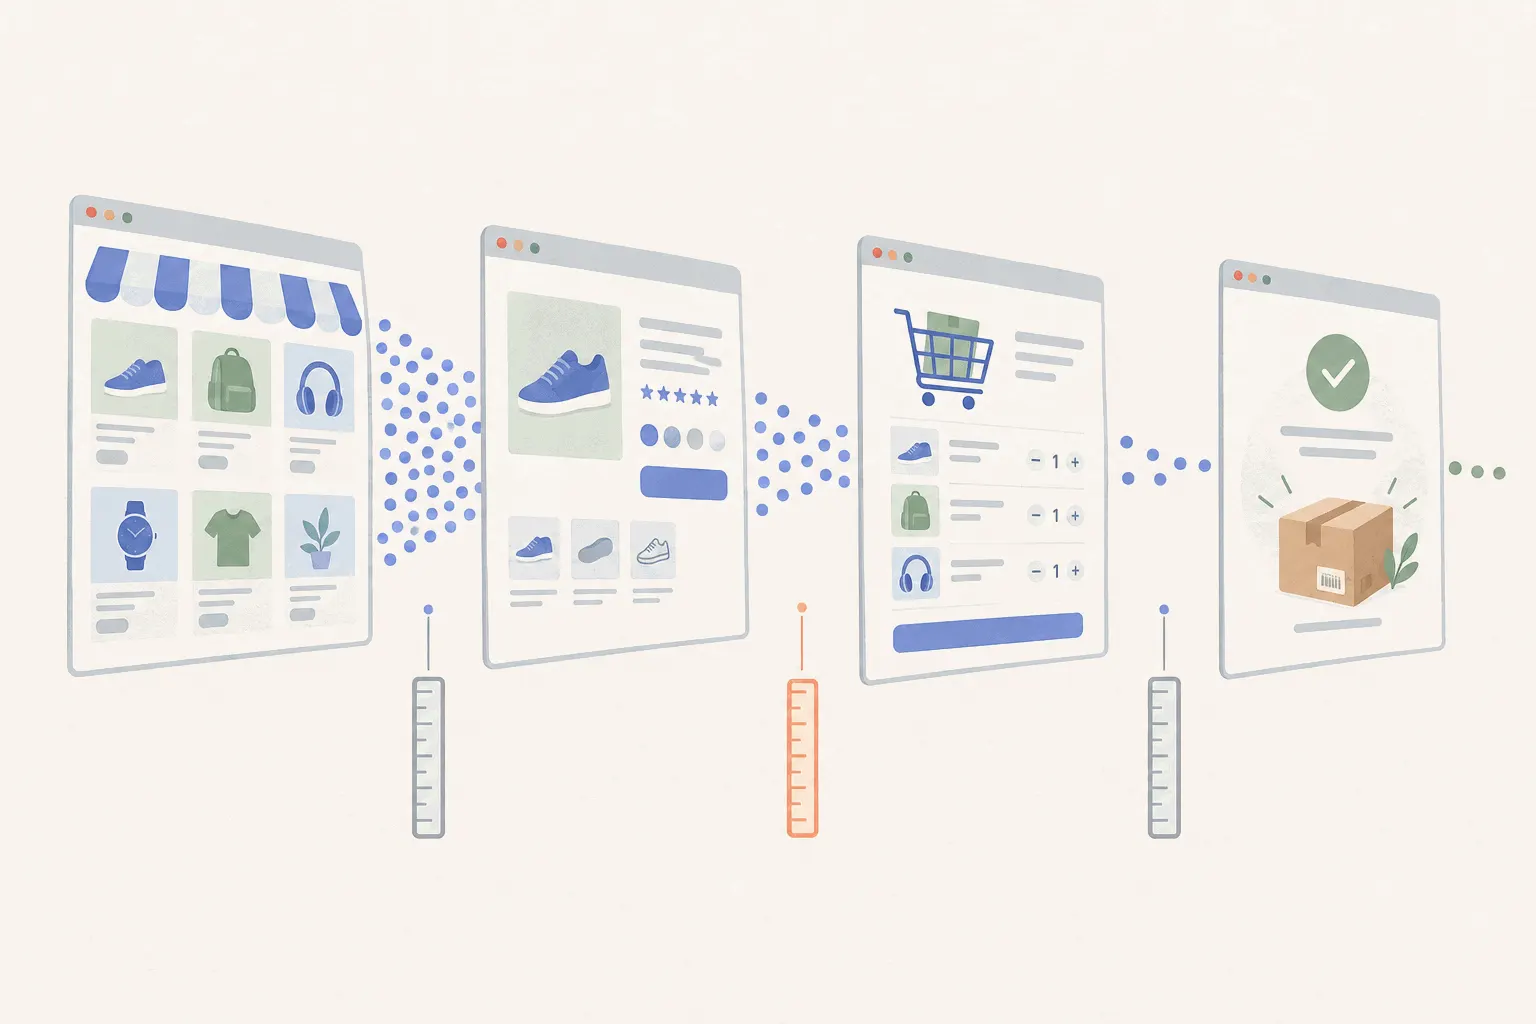
The one funnel measured on a single panel
Only one disclosed source publishes every major step from the same set of stores: Littledata's Shopify benchmarks, from a panel of 2,800 stores, most recently compiled in 2023. Per hundred sessions on the median store, about 4.6 put something in a cart. Of the sessions that reach checkout, roughly 45 percent complete it. End to end, about 1.4 sessions in a hundred become an order.
Those three numbers are internally consistent because they share a panel, which no cross-source composite can claim. Their limits are just as clear: the panel is Shopify stores, the figures are medians of small and mid-size merchants, and 2023 is a while ago. Treat the shape as durable, the decimals as dated.
The step the whole literature skips is product-page view to add-to-cart. No disclosed source publishes it as a standalone benchmark, so any table quoting one is either measuring a private panel or making it up. If you want that number, and it is a genuinely useful one, you have to measure it yourself.
Step by step, with their homes
Arrival to cart. The global average add-to-cart rate sits around 5 to 6 percent of sessions on Dynamic Yield's brand panel, against Littledata's 4.6 percent Shopify median, and the industry spread runs roughly fivefold from luxury at the bottom to food and beauty at the top. The full treatment, including the denominator trap that makes half the published tables incomparable, is in add-to-cart rate benchmarks.
Cart to order. The famous number here is Baymard's, roughly seven carts in ten abandoned, and its collision with Littledata's figure is instructive enough to get its own section below. Reasons, benchmarks and the definition boundary between cart and checkout abandonment live in checkout abandonment rate, and the fixes in how to reduce checkout abandonment.
End to end. Session-to-order conversion has the richest benchmark literature of the three, covered by industry and traffic source in what's a good conversion rate. For orientation: Littledata's Shopify median is 1.4 percent, while Dynamic Yield's current brand panel runs between 2 and 3 percent depending on device, and the gap between those two panels is normal, not a contradiction.
Two sources, two truths: the denominator lesson
Baymard's cart abandonment average of just over 70 percent is an aggregate of some fifty studies collected over two decades. Littledata's checkout completion of 45 percent implies abandonment around 55. Fifteen points apart, and both are honestly derived, because they start counting at different places: begin at every created cart and you catch the browsers who were never going to buy, begin at initiated checkouts and you have already filtered them out. Neither number is wrong. They answer different questions.
The same effect explains the strangest disagreement in the research: on device, Littledata's panel converts desktop well above mobile, while Dynamic Yield's current panel shows mobile slightly ahead. Different years, different stores, and likely different counting bases. When two disclosed sources disagree this much, an undisclosed "industry average" table deserves no benefit of the doubt at all.
So when you compare your own funnel to anything published, the checklist is short: same starting line, same denominator, similar store type, and a date you would accept for any other data. Most published funnels fail at least two of the four.
The figures to ignore
Two composites circulate widely enough to name. The "average ecommerce funnel" graphic that walks from 100 percent of visitors through tidy round steps to a 2 to 3 percent purchase rate is illustration, not measurement, and usually traces back to a mix of the sources above with the dates and denominators filed off. And the bare "ecommerce converts at 2 to 3 percent" line is fine as a memory aid but is not a target, because the disclosed spread by category runs from under 1 percent to over 5 within a single panel. A store selling engagement rings is not underperforming a snack brand at a tenth of its conversion rate.
Measuring your own funnel instead
Your store's funnel, split by device and traffic source over the last quarter, beats every table above, and it is cheap to have. GA4 users can build it from the standard ecommerce events, covered in GA4 ecommerce tracking, and read it with the discipline in funnel analysis: biggest leak first, segments before conclusions, trend over level. The published figures then do the one job they are good at, telling you whether a leak is ordinary or an outlier. A 70 percent cart abandonment rate is Tuesday. A 70 percent drop between product view and cart is a fire. Knowing which is which is what benchmarks are for, and the wider measurement stack for stores is in ecommerce analytics.