How to create a heatmap for your website
What it takes to get a heatmap of your own site: a tool, one script, the right page and device, and enough visits to trust the picture.
What you need before you start
Three things. A website you can add a snippet of code to, either directly or through a plugin, a tag manager or the "custom code" box most site builders have. A heatmap tool, free or paid. And a page that gets real traffic, since the tool can only draw what visitors do.
You do not need to know how to code. Every tool hands you a few lines to paste, and the platforms most small sites run on have a plugin or app that pastes it for you. If you already run a web analytics tool, check whether it includes heatmaps. Many do now, and that saves installing a second script.
Choose a tool
The decision comes down to three questions. Is there a free plan that covers your traffic? Does it draw the map types you want, since some tools stop at click and scroll maps while others add mouse movement and attention maps? And does it live alongside your analytics, so you can open the map for a page straight from that page's numbers?
The best heatmap tools post compares the current options in detail. Bigdelta is one of them: heatmaps, session replays and web analytics run from the same script, and the free plan covers sites under 100,000 page views a month.
Add the script and check that it is collecting
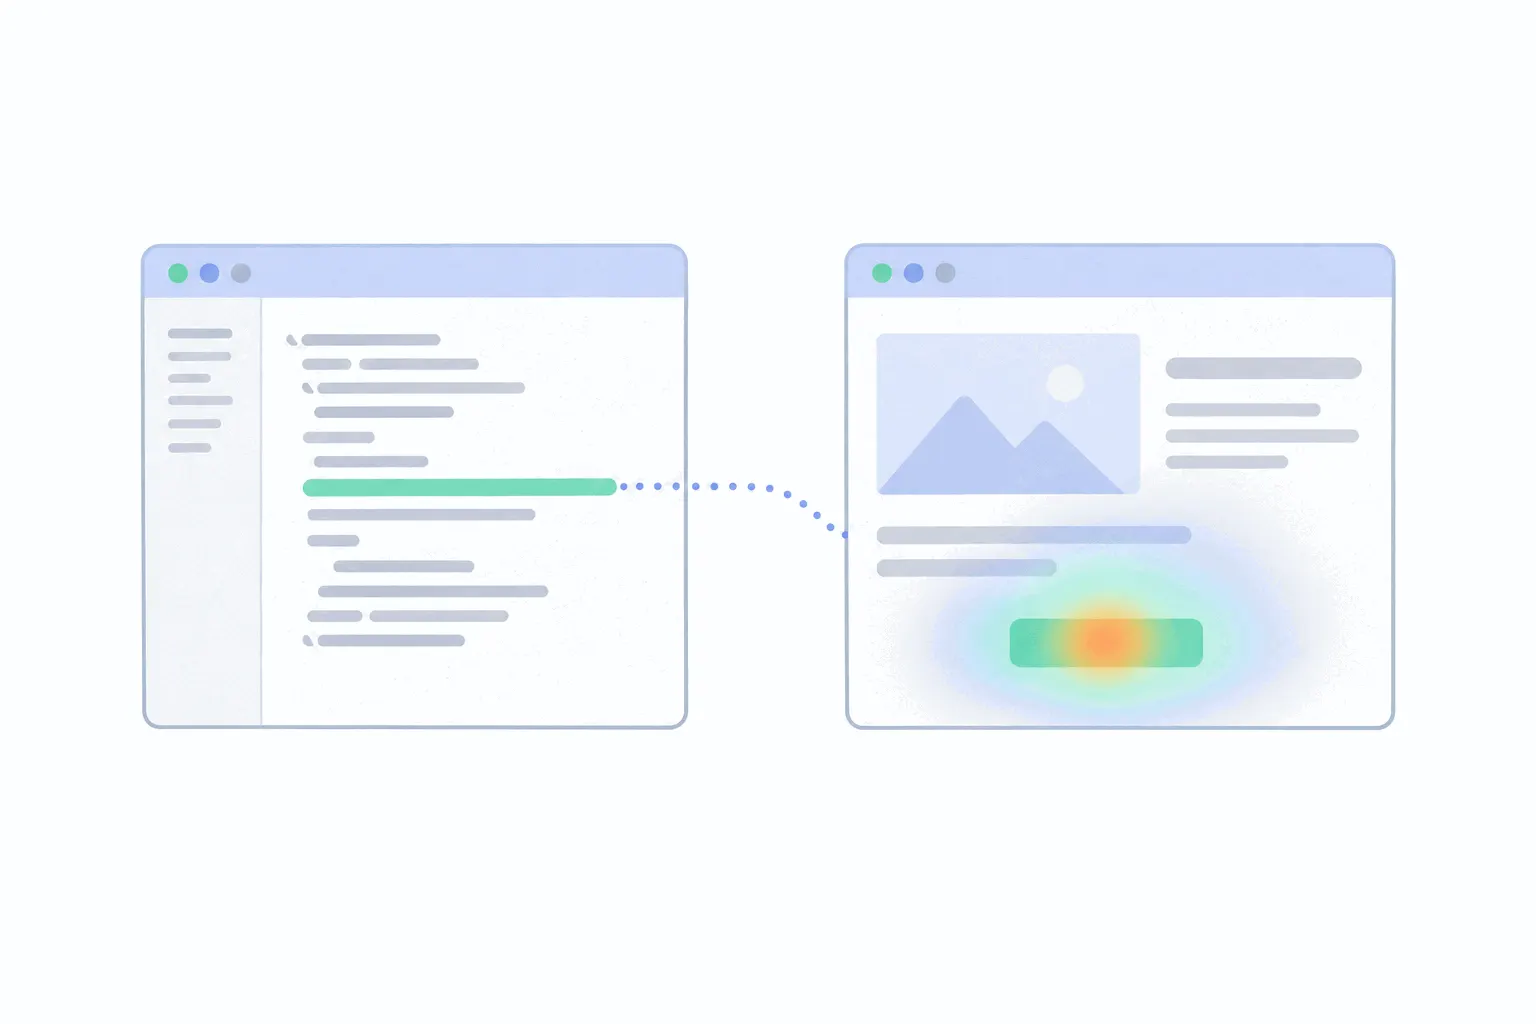
Once you have an account, the tool gives you a tracking script. It is a short block of code that goes into the head section of every page, which is the part of a page's code that loads before anything visible. Paste it once in your site's template or theme and every page picks it up. If you are not the person who edits the code, most tools let you email the snippet to whoever is.
There are three common ways to get it onto the site. Paste it into your site's header settings, which most builders and content systems expose without touching a theme file. Install the tool's plugin or app, which does the pasting for you on WordPress, Shopify and similar platforms. Or add it as a tag in Google Tag Manager, where several tools have a ready-made tag template that only asks for your site ID. The Shopify heatmap guide walks through the app route on a store.
Then confirm it works before you wait for data. Open your site in a browser, click around for a minute, and look for yourself in the tool. Most tools show live visitors within a few minutes of install, and one vendor's setup guide says data appears as soon as the code is added. Another says to wait about half an hour before a heatmap is generated. If nothing shows up after an hour, the usual culprits are a script pasted on one page instead of the template, a caching plugin serving the old version of the page, or an ad blocker in your own browser hiding your visit.
Choose the page and the device
Heatmaps are built per page, so pick the page that matters. For most sites that is the home page, the page with the most traffic from search, or the page where money changes hands: a product page, a pricing page, a signup form. Some tools draw maps for every page automatically. Others ask you to name the page first and start collecting from that point, so name it early.
Then pick a device. Every tool that takes heatmaps seriously builds separate maps for desktop, tablet and phone, and there is a plain reason for it. A responsive page lays itself out differently at different widths. The menu folds into an icon, three columns become one, and the button that sat top right on a laptop lands halfway down a phone screen. Piling taps from a narrow layout onto clicks from a wide one paints heat on things that were never in the same place. Bigdelta, for example, generates desktop, tablet and mobile maps separately. Whatever tool you use, look at one device at a time.
Wait for enough visits
This is the step people skip. A heatmap with a handful of visits looks just as colourful as one with thousands, so nothing warns you that it is not ready.
There is no statistical test for a heatmap, so the thresholds are rules of thumb, and vendors give different ones. One heatmap vendor's 2026 playbook puts the point where click patterns start to form at a few hundred visits per page, with 500 before changing anything, and says scroll maps settle a little sooner. A second vendor's guide tells its users to wait two to four weeks before reading anything into a map. A third recommends 2,000 to 3,000 page views before drawing conclusions. The spread is wide, but the direction is the same: hundreds at minimum, thousands if the decision is expensive.
Remember that the count is per page and per device. A page with 600 visits a week split two-thirds phone and one-third desktop gives you a usable mobile map after a week and a desktop map that needs three. Let the collection run over whole weeks too, so that weekday and weekend visitors both make it into the picture.
Open the map
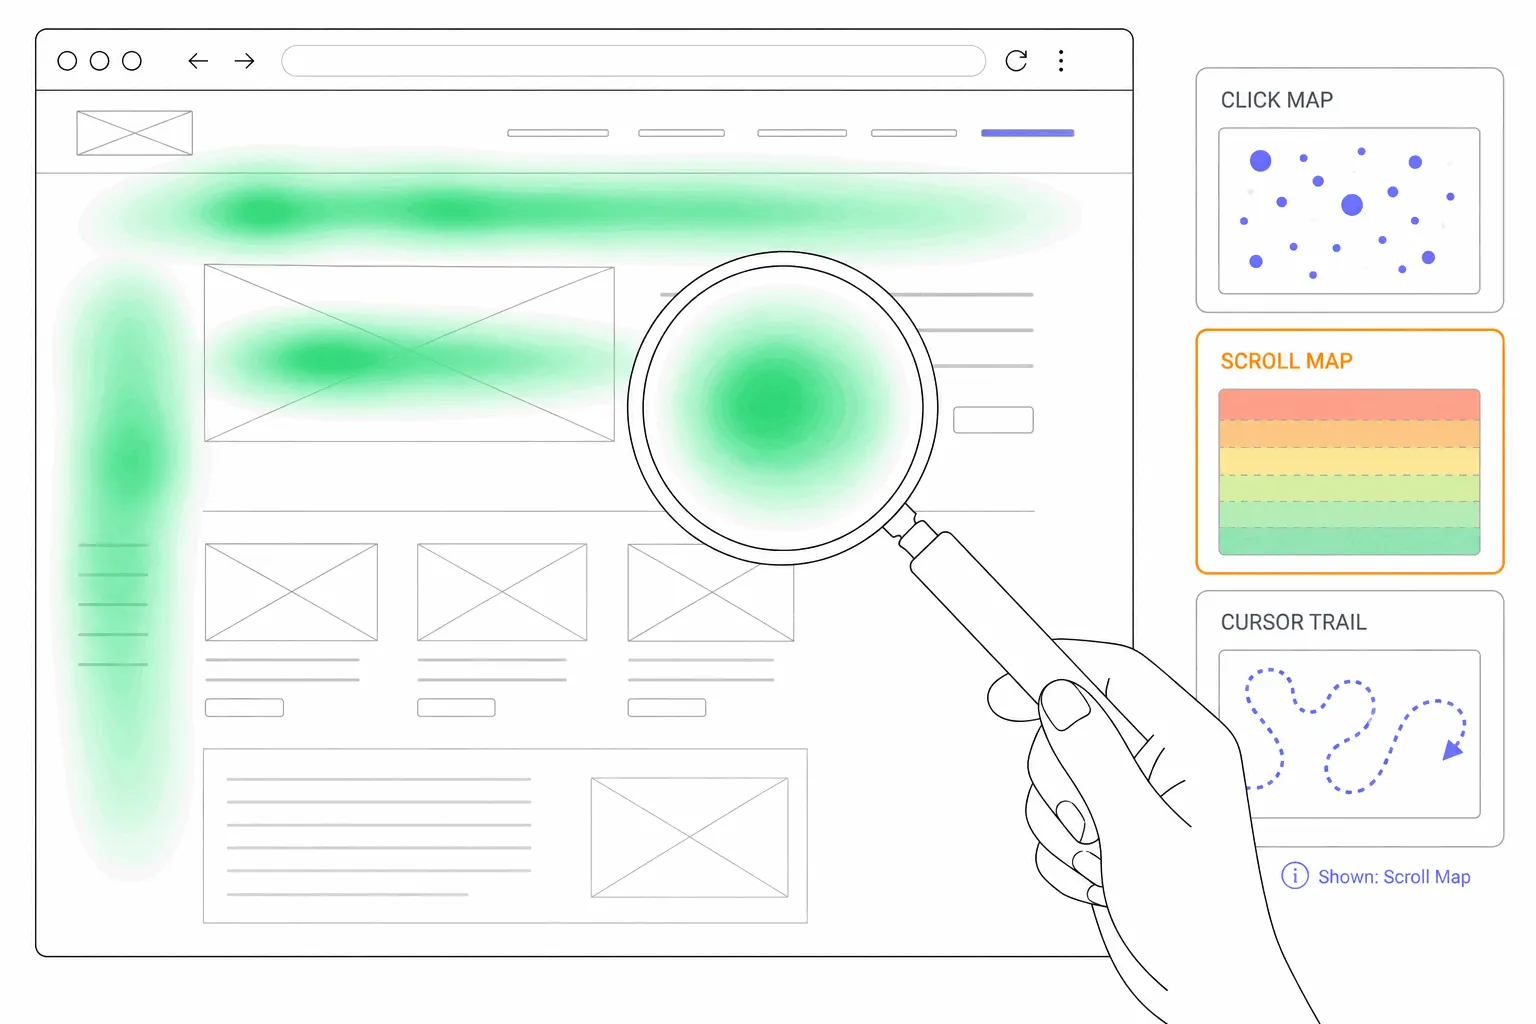
When the count is there, open the page's map and switch between the types. The click map shows where people clicked and tapped. The scroll map shows how far down they got. Movement and attention maps, where the tool draws them, show where the cursor went and where time was spent. Filter by traffic source if you can, because visitors from an ad and visitors from search often behave like two different audiences on the same page.
Reading the map is its own skill, and how to analyze a heatmap covers it: starting from a question, checking the sample before the colours, and getting a second source before a redesign. The heatmap examples post shows the ten patterns you are most likely to meet on the first map you open.
Looking for a heat map of spreadsheet data?
A large share of people searching for a heat map generator want to colour a grid of numbers, not watch a web page. If that is you, no tool or script is needed. In Excel, select the cells, open Conditional Formatting on the Home tab and pick a colour scale, and the cells shade from low to high. Google Sheets does the same under Format, then Conditional formatting, then Colour scale. Python and R have heatmap functions in their standard charting libraries. The rest of this post is about the website kind.
Can you generate a heatmap from a URL alone?
Some tools offer to draw a heatmap from a page address or a screenshot with nothing installed. They cannot see your visitors. What they produce is a prediction of where eyes are likely to land, made by a model trained on eye-tracking studies, and it is a different thing from a map of what your visitors did. The post on AI heatmaps covers what those predictions are good for. A map of real behaviour on your page needs the script, and there is no way around it.
Mistakes that waste the first map
A few errors turn up on almost every first attempt.
- Reading it too soon. Thirty visits paint a convincing picture that changes completely the next day. Wait for the counts above.
- One map for all devices. A combined map mixes two layouts. Pick a device before you look.
- Changing the page mid-collection. If you move a section or swap the hero, the clicks collected before the change sit on a layout that no longer exists. Most tools take a screenshot of the page to draw the heat on, and several let you refresh that screenshot after a redesign. Start a fresh period after any real change.
- Expecting every visitor. Ad blockers and declined consent banners stop the script for a share of visits, so the map is drawn from the visitors who let it run. The dark traffic post covers how large that share tends to be. The pattern usually holds, but the totals do not.
- Missing content on the screenshot. If parts of the page load late, the screenshot can be taken before they appear and the map shows heat on blank space. Most tools let you delay the snapshot or retake it.
After the first map
Once the first map is readable, the job changes from setup to routine. Pick the page with the biggest gap between what the map shows and what you intended, watch a few session recordings of visitors on that page, change one thing, and start a new collection period to see whether the map moved. That loop, one page at a time, is what a heatmap tool is for.