I just launched my product. What should I track first?
Launch week needs five numbers, and most analytics tools ship with forty. Visitors, sources, one action, signups and one activation signal — in that order. Everything else can wait for month two.

Forty charts, three questions
The product is live, the launch post is up, and the first instinct is to measure everything — install a heavyweight analytics suite and define twenty events. The second instinct, common after an hour inside that suite, is to measure nothing and refresh the signup list by hand. Both waste launch week, and launch-week data is the kind that can't be collected twice.
The questions that matter in week one are three — five numbers cover them, and everything else (cohorts, retention curves, revenue ratios) needs history you won't have for weeks anyway:
- Did anyone come?
- Where did they come from?
- Did anyone do the thing the product is for?
First: visitors, and where they came from
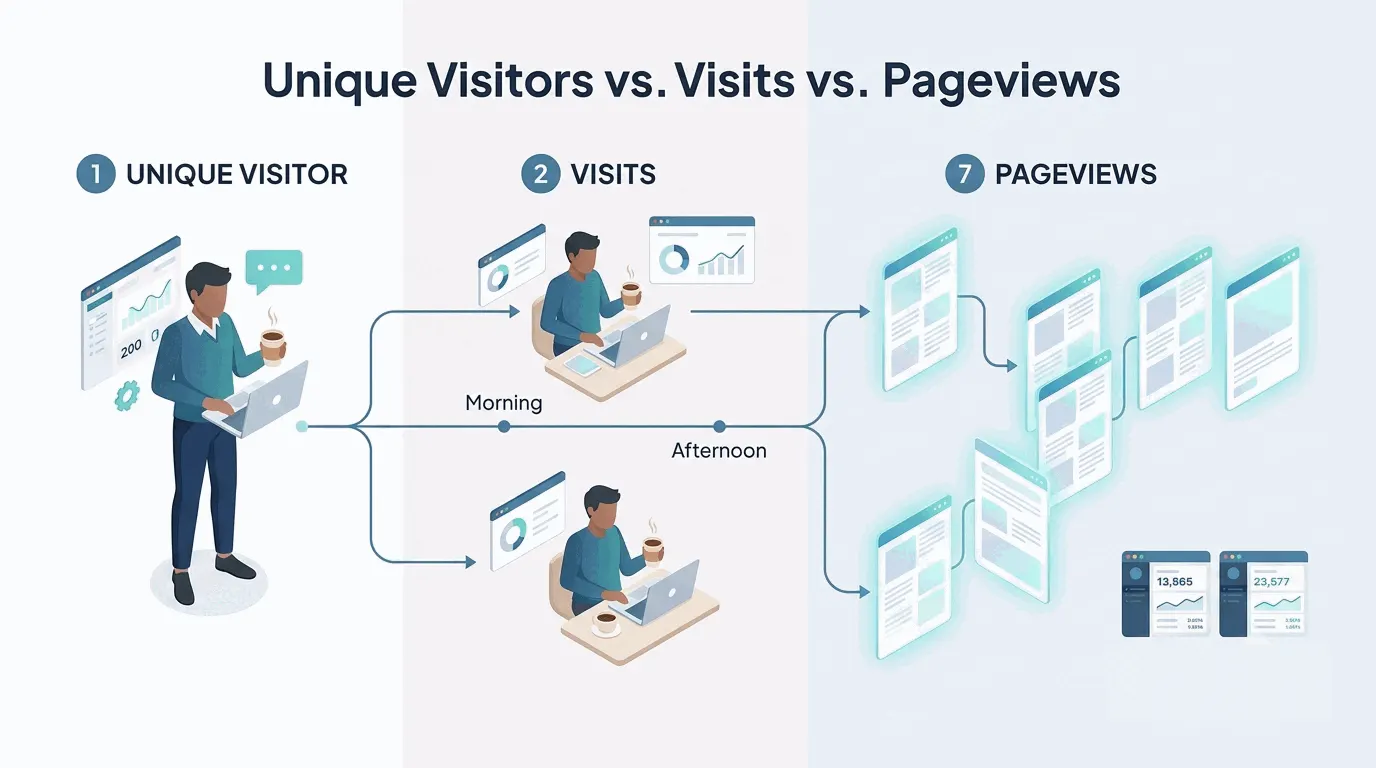
Start with a plain visitor count, from a real analytics snippet rather than a hosting dashboard — platform counters count HTTP requests, which means every bot and uptime checker inflates the number while single-page-app navigation deflates it. The difference between visitors, visits and pageviews is worth two minutes of reading before quoting any of them.
Sources matter more than the total, because launch week is a distribution experiment: the Reddit post, the Product Hunt listing and the newsletter mention are each a bet, and the source report is where the bets pay off or don't. One prerequisite, and it has to happen before the links go out: put UTM tags on every link you place. Untagged clicks from messaging apps and mobile browsers fall into the 'direct' junk drawer, and a launch is exactly when unlabeled traffic hurts most.
Second: one action, not twenty
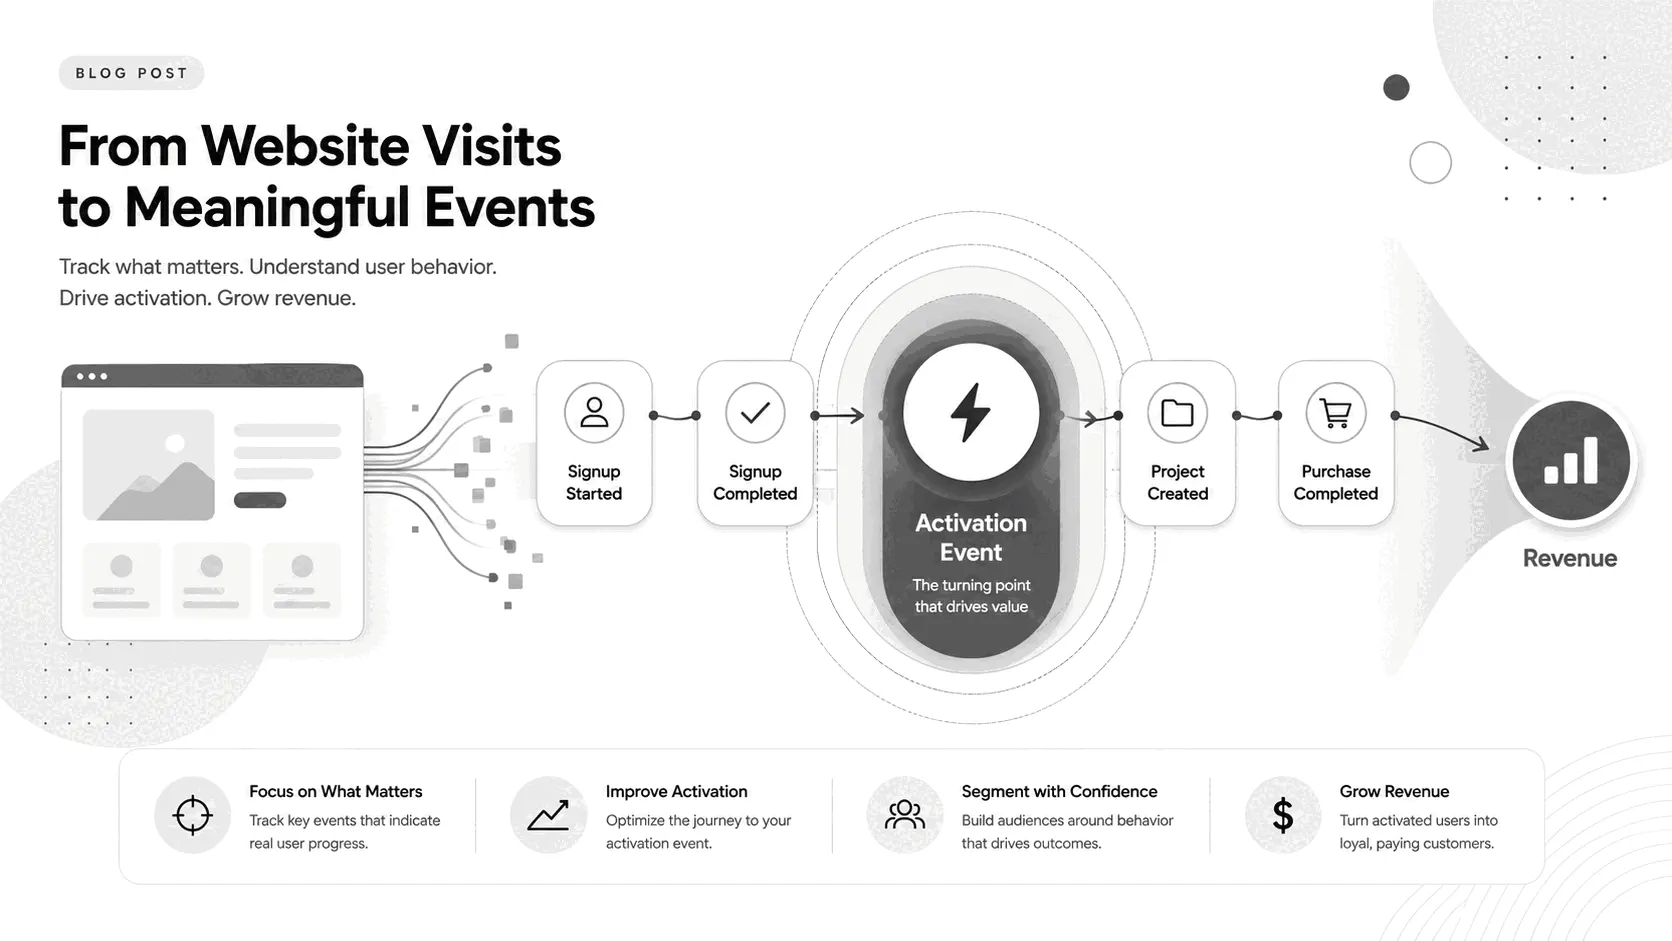
Resist the urge to instrument every button. One event carries most of week one's signal: the action that means someone actually used the product — signed up, ran the tool, placed an order. If there's a form involved, track it as two events, started and completed, because the gap between them is the first real diagnosis the data can hand you.
The guide to choosing events covers naming and structure, but the launch-week version is simple: an event that doesn't help answer 'did anyone use it' can wait.
Third: one activation signal
Signups alone overstate a launch, because curiosity signups are free. The number that separates interest from use is how many new signups reached the product's first moment of value — created a project, imported data, sent the first message. Pick a crude definition now; it can be refined once there's enough retention data to check it against. That share is your activation rate, and in week one it's allowed to be a hand-counted number.
What can wait — and one thing that can't
Retention cohorts need weeks of history, and LTV and CAC need customers and ad spend you don't have yet. Bounce-rate tuning needs enough traffic for the number to mean anything. All of it can wait for month two without losing a thing, because those reports are computed from the raw pageviews and events you're already collecting — the analysis can happen later; the collection can't.
The one early luxury worth taking: session recordings. With forty visitors a day, watching nearly every session is actually possible, and this is the only time in a product's life that will be true. A handful of replays of strangers meeting the product for the first time teaches more about the landing page than any launch-week chart.
The practical takeaway
Install tracking before the launch post goes out — data from before the snippet exists is the one thing no tool can backfill. Then hold the scope to five numbers: visitors, sources, the one core action, signups, and a rough activation count. Check them daily and ignore the rest. The questions that pile up over the first month will decide which event to add next. A tracking plan that starts small gets maintained; one that starts with twenty events gets abandoned by month two.