Why did my traffic drop? A step-by-step diagnosis
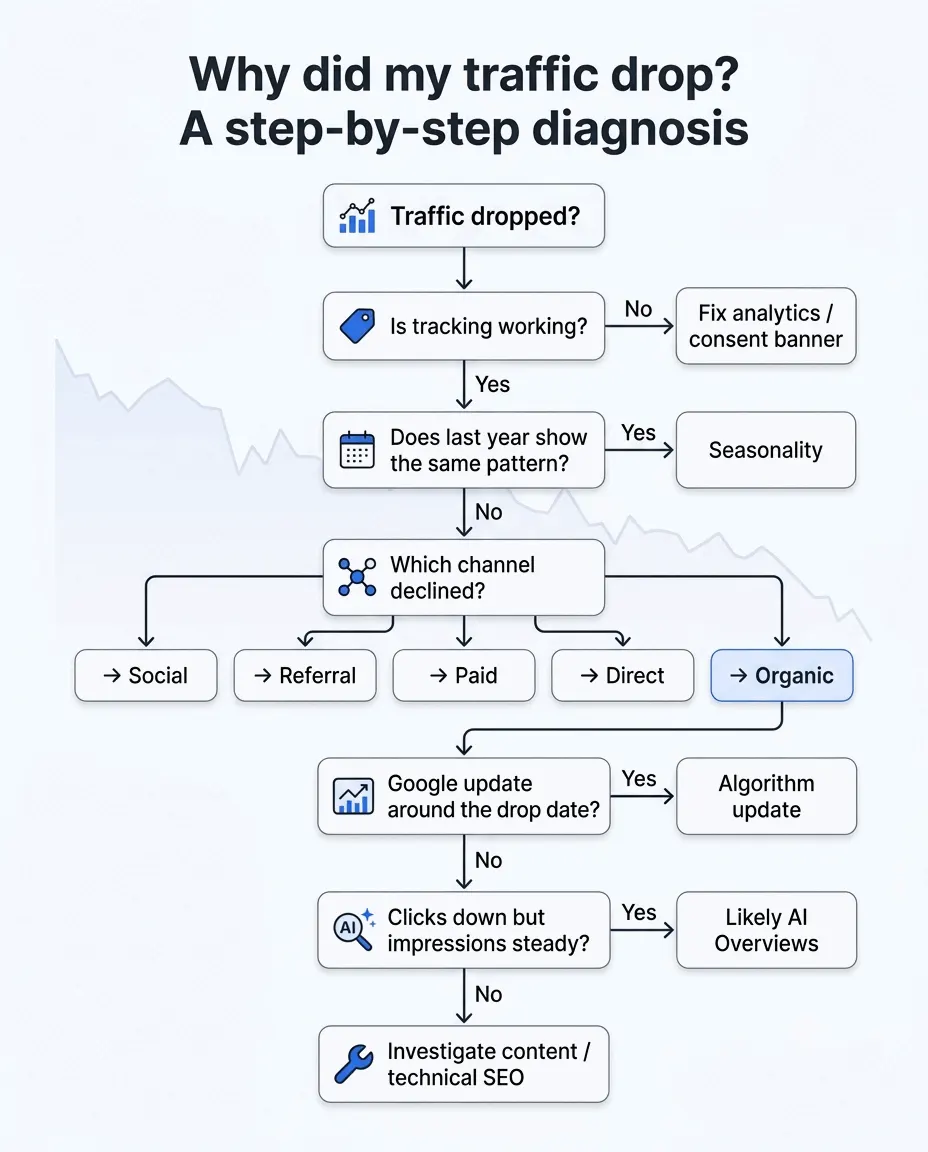
Most traffic drops have one of five causes: broken tracking, seasonality, a channel-specific problem, a Google update, or AI Overviews eating your clicks. Check them in that order — the common causes are also the fastest to rule out.
Start with the shape of the drop
Before hunting for causes, look at how the line fell, because the shape narrows the suspects. A cliff — normal on Tuesday, halved on Wednesday — points to something that changed on a date: your site, your tracking, or a Google update rollout. A slow slide over months points to seasonality, decaying content, or gradual changes in search itself. And a drop in one traffic source while others held steady points the investigation at that channel alone.
Zoom out to at least twelve months so you can see patterns a 30-day view hides. Then work through the checks below in order. They're arranged so the most common and fastest-to-rule-out causes come first.
Step 1: make sure the traffic actually dropped
The most common cause of a scary analytics graph is not less traffic — it's broken counting. This is where every diagnosis should start, because it takes five minutes and instantly explains drops that look catastrophic.
Suspect tracking when the drop is to zero or near zero, or when it lines up with a redesign, a replatform, a new cookie banner, or anyone touching the site's code. The typical failures: the rebuild didn't carry the analytics snippet over, a tag manager change removed it, or a new consent banner now blocks counting until visitors accept — which many don't, so a chunk of real traffic silently vanishes from the numbers.
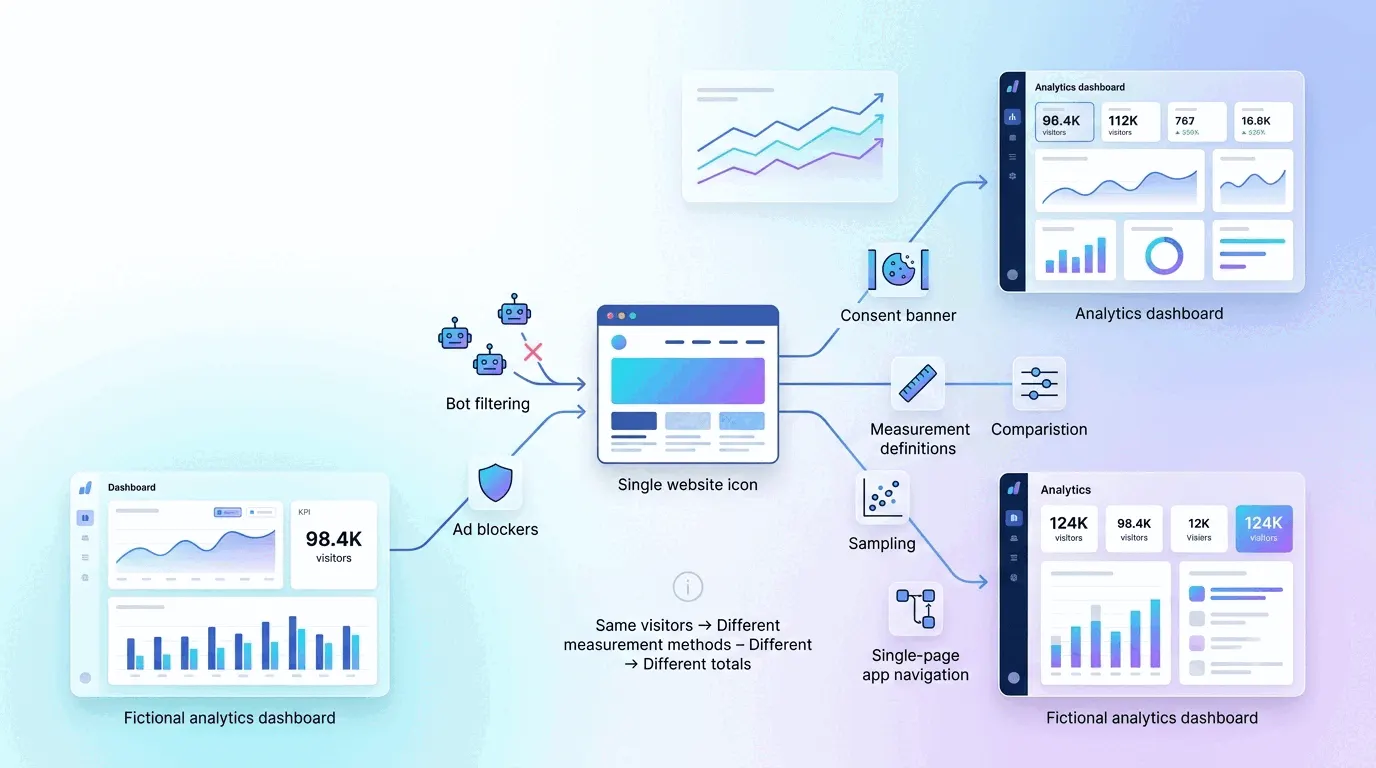
Two checks settle it. Open your analytics tool's realtime view and visit your own site from a phone; if you don't appear, the snippet is gone or blocked. Then compare against a count your snippet can't affect: Google Search Console records clicks from Google on Google's side. If Search Console shows steady clicks while your analytics shows collapse, the traffic is fine and the counting broke. (More on why counts disagree in why analytics tools show different numbers.)
Step 2: check the calendar
Compare the drop against the same period last year, not against last month. Traffic is seasonal for almost every site: B2B products dip in July and August and again around the December holidays, consumer sites have their own rhythms, and single weeks get distorted by public holidays in whichever country sends most of your visitors. If last year's graph shows the same dip in the same weeks, you have your answer and nothing is wrong.
If your site is too young to have a last year, ask whether your audience's behavior has an obvious rhythm — teachers in summer, accountants after tax season — before assuming something is broken.
Step 3: find out which channel dropped
The total traffic line hides the cause; the source breakdown usually reveals it. Segment the drop by channel and see where it concentrates.
Each channel implicates different suspects. Organic search down: continue to steps 4 and 5. Social down: platforms change their feed algorithms without notice, and a single post that drove traffic last month simply stops being shown. Referral down: some site that linked to you removed the link, redesigned, or lost its own traffic — find which referrer shrank. Paid down: check the ad account before anything else, since budgets, disapprovals and tracking changes all live there. Direct down: hardest to read, since 'direct' is partly a bucket of unattributed visits, but a big move often means an email, app, or dark-social source changed.
Step 4: if organic search fell, check for a Google update
Google ships several algorithm updates a year, each rolling out over one to three weeks, and sites can gain or lose meaningfully in them without doing anything. In 2026 so far there have been two core updates — one in late March, one in late May — plus a spam update in March. The authoritative list is Google's Search Status Dashboard; check whether your drop's start date falls inside a rollout window.
An update hit has a recognizable signature in Search Console: average position slips across many queries at once, and impressions and clicks fall together, starting inside the rollout window. If that's what you see, the honest news is that there's no quick fix — Google's guidance amounts to improving content quality broadly, and recoveries, when they happen, tend to arrive at subsequent updates rather than gradually. What helps practically: identify which pages lost most, compare them against what now ranks, and improve or consolidate rather than tinkering with technical details that didn't cause the drop.
Step 5: if clicks fell but impressions didn't, it's probably AI Overviews
There's a newer signature worth knowing, because it's becoming the most common one for content sites: in Search Console, impressions are flat or rising, average position barely moved, but clicks and click-through rate sag. That means your pages still rank — but an AI-generated answer now sits above them, and fewer people scroll past it.
The scale of this is well documented. AI Overviews appeared on roughly a third to half of searches by early 2026 — mostly informational queries, rarely transactional ones. A randomized experiment by researchers at the Indian School of Business and Carnegie Mellon (a working paper, not yet peer-reviewed) found that when an AI Overview appears, organic clicks fall by 38% and the share of searches ending with no click at all rises from 54% to 72%. Ahrefs measured click-through rates for first-position pages falling 34.5% when an Overview is present, and Pew Research found users click a result on 8% of searches with an AI summary versus 15% without.
You can't opt out, so the response is positioning: informational queries that an AI paragraph can fully answer will keep bleeding clicks, while queries where the searcher needs to do something — compare products, use a tool, buy — still deliver visitors. It's also worth checking whether the Overviews on your queries cite you; a citation recovers some of the lost clicks and is the closest thing to ranking in the new layout.
The rare causes, worth two minutes each
A few causes are uncommon but so quick to check that they belong in every diagnosis. Search Console's manual actions report tells you directly if Google penalized the site — no guessing involved, there's a message or there isn't. A site:yourdomain.com search on Google shows whether your pages are still indexed at all; if they're gone, look for a noindex tag or a broken robots.txt that shipped with a recent deploy. And if you recently changed domains or URLs, missing redirects from the old addresses are the first thing to verify.
The practical takeaway
Run the checks in order: is the counting broken, is it seasonal, which channel fell, was there an update, are impressions surviving while clicks die. The first two explain most drops and cost ten minutes together. Whatever you find, write the date and the cause down where your team will see it — the next investigation starts from that note, and traffic questions get easier every time you have a documented history to compare against.