How to track website conversions
A conversion is just the action you want a visitor to take. Which action it is, is your call — and the choice decides everything the number is worth.

A conversion is just the action you care about
The word sounds like it belongs to someone with a certification. It doesn't. A conversion is a visitor doing the thing you were hoping they'd do — buying the product, booking the call, joining the mailing list, tapping the phone number on their screen. That's the whole concept.
It's worth counting separately from traffic because traffic only tells you people showed up. Most sites have plenty of arrivals and very few actions, and a traffic report will never show you that gap. It doesn't have the data to.
Here's the part that trips people up: nobody hands you your conversion. You choose it. Two sites with identical traffic can report a 0.4% rate and an 11% rate, both perfectly accurate, because one picked 'bought something' and the other picked 'clicked anything at all'. This is also why the phrase means different things in different rooms — in SaaS, conversion rate usually refers to signups who become paying customers, which is a much later step than the one this post is about.
Macro and micro conversions
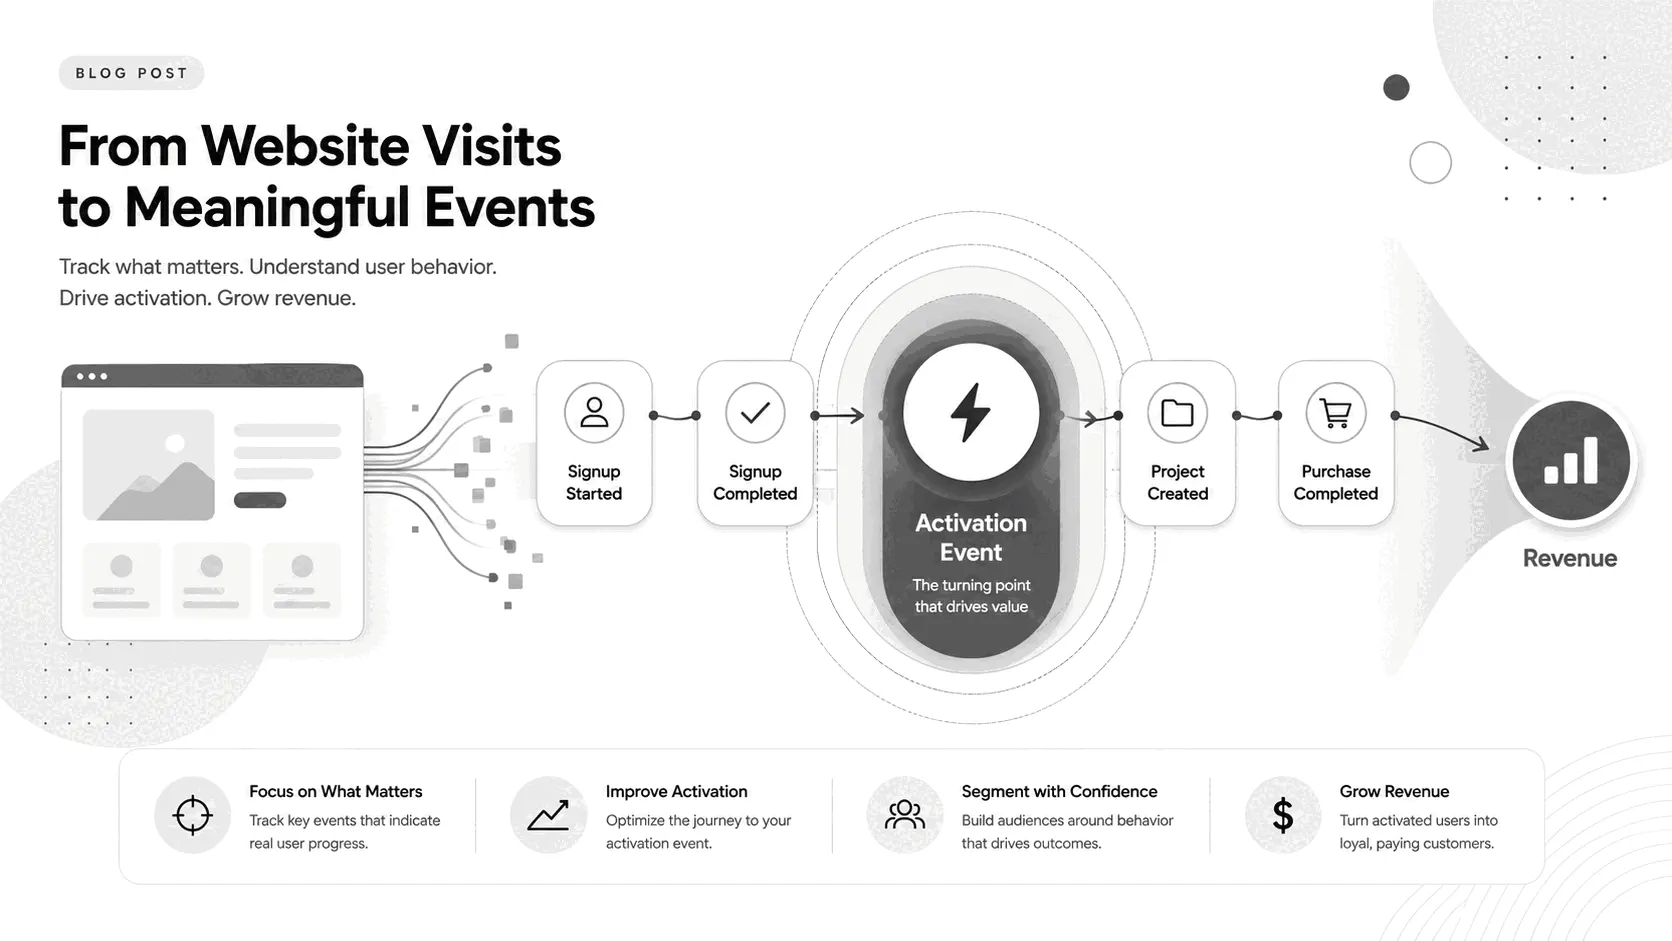
Your macro conversion is the one that pays: a purchase, a trial start, a real enquiry. Most sites have exactly one and everybody in the building already knows what it is.
Micro conversions are the steps on the way there. Added to cart. Reached the pricing page. Started filling in the form. On their own they're not worth much, which is why beginners skip them and track only the macro.
That skip is what leaves you stuck. If you make eleven sales a month, the macro number moves from 11 to 9 and you have no idea whether that's a broken checkout, a bad week, or nothing. Micro conversions happen often enough to show a pattern — 400 people reached the cart and 40 started checkout, against 380 and 95 last month, and now the question has an obvious place to start. Picking which ones to record is its own decision, covered in what events to track.
What counts as a conversion for your kind of site
The right macro conversion is the action closest to money that you can actually observe. The right micro conversions are the two or three steps immediately before it. By business type:
- Ecommerce and DTC — macro: completed purchase. Micro: add to cart, checkout started. The gap between those two micro numbers is where most stores are quietly losing money.
- SaaS — macro: trial started or account created. Micro: pricing page reached, and the first real action inside the product. If you sell straight from the pricing page with no trial, the subscription itself is your macro.
- Blog or content site — macro: newsletter subscribe. Micro: reaching the end of a post, clicking an affiliate or outbound link. Pageviews are not conversions, however good they look.
- Local and service businesses — macro: a booking, a call, or a quote request. Micro: tapping the phone number, opening directions, opening the booking widget. Phone taps matter more than anything else on mobile and most local sites never record them.
- Lead generation and agencies — macro: a qualified form submission. Micro: case study viewed, calendar opened. Qualified is doing real work in that sentence — counting every form fill measures your spam volume.
- Marketplaces and apps — macro: first transaction or install. Micro: listing viewed, app store link clicked. That last click leaves your site, so a pageview counter can't see it.
The denominator decides the number
800 visitors last week, 24 of whom bought something: 24 ÷ 800 = 3% conversion rate.
The formula is the easy half. The bottom line is where the trouble starts, because 'total visitors' can mean people or it can mean visits, and one person visiting four times is either 1 or 4 depending on which your tool counts. Same site, same week, same sales, and the rate shifts by a wide margin. Some tools report one, some the other, and several — Bigdelta and Google Analytics among them — will show you both, which means the figure you end up quoting depends on which row you happened to read. Neither is wrong, and comparing one against the other tells you nothing. The visitors, visits and pageviews hierarchy is worth twenty minutes if this is new.
Two published studies show how far this goes. Ruler Analytics reports that software companies convert at 7.6%. First Page Sage reports that B2B SaaS companies convert at 1.1%. Both are real studies with disclosed methods, and they are seven times apart, because Ruler counts marketing engagement across a broad software category including phone calls, while First Page Sage counts cold visitors who request a demo. Neither is lying. They're answering different questions with the same two words.
Our own library has a pair like this. Ecommerce sites convert at 1–3%, and checkout abandonment runs 50–70%. Those look contradictory until you notice the first is measured against everyone who visits and the second against the much smaller group who reached checkout with their card out. Whenever a conversion number surprises you, check what's underneath the line before you check anything else.
One more thing the rate can't do: a single site-wide percentage hides everything interesting. Split it by traffic source at minimum. Ruler's 2026 data has organic social converting at 2.23% against 4.9% for organic search and email, so a site whose traffic mix shifted toward social will watch its overall rate fall while every individual channel holds steady. When the number does drop, a funnel will show you which step broke — and session recordings will show you why.
What a good conversion rate looks like
A benchmark tells you roughly which neighbourhood you're in. It can't tell you whether you're doing well, because your traffic mix moves your rate further than your website design does — a site living on brand searches and email will beat a site buying cold traffic, selling the same product at the same price.
Ecommerce is the best-measured category by some distance. IRP Commerce's live trading panel put the average at 1.70% in April 2026, down from 1.81% a year earlier. Littledata's Shopify benchmark gives 1.4% average with the top tenth above 4.7%, though that data was assembled in 2023 and is still being quoted as current everywhere. Dynamic Yield, sampling larger brands, reports 2.69%. Read it as 1.4–2.7% and note which end you belong to, because small stores and enterprise retailers genuinely behave differently. On the way out, Baymard Institute's average across fifty studies has 70.22% of carts abandoned, which is the most solidly sourced number in this entire field and the reason checkout abandonment deserves its own attention.
For SaaS the trustworthy figure is trial-to-paid rather than visitor-to-trial. First Page Sage, across 86 companies through Q3 2025, reports 18.2% for no-card trials and 48.8% when a card is required up front, with freemium at 2.6%. Recurly's 2025 subscription report gives 12.0% and 39.0% for the same two shapes, and adds that overall trial conversion fell from 46% to 33% year over year. Two careful studies, ten points apart. What both agree on is the shape: asking for a card roughly triples the conversion rate and shrinks the number of people who start, which is a trade rather than a win. The trial-to-paid benchmarks go into which side of it suits you.
For lead generation, Ruler Analytics' 2026 report — 110 million sessions, published in May — puts the overall average at 5.13%, with paid search at 5.4% and organic search at 4.9%. Unbounce's landing page benchmark gives a 6.6% median across industries, with the top quartile above 10%; that report's most recent edition covers 2024, and landing page traffic is campaign traffic, so it sits well above what a whole site achieves.
Three categories have no honest benchmark, and you should know that before you go looking. Newsletter signup rates all trace back to a Sumo study from 2016 — the 3.09% figure you'll find on every blog is ten years old, and the newer sources measure against such different denominators that one of them drops from 3.49% to 0.68% when recalculated on the same basis. Local and service business call rates come from small posts with no stated sample size. SaaS visitor-to-trial figures have no primary source at all that we could find. Numbers do circulate for all three, confidently and with decimal places. They just don't come from anywhere.
When your numbers and the ad platform's don't match
Run ads and you'll eventually notice Meta claiming 40 conversions in a week your analytics recorded 25. Nobody is broken. Google Ads books a conversion on the day of the click, so a Monday click that becomes a Friday sale is a Monday conversion there and a Friday one in your analytics. Every ad platform also credits itself: someone who saw a Meta ad, searched, clicked a Google ad and then bought counts once for Meta and once for Google, which is why the platform totals added together exceed the sales you actually made. Google acknowledges this and offers a comparable-attribution view to work around it.
The counting rules differ too. Meta's default window credits conversions within seven days of a click and one day of merely seeing the ad, and that view-through half has no equivalent in your analytics, which never knew the ad was displayed. Google Analytics changed vocabulary in 2024 and now calls these key events, reserving 'conversion' for a key event exported into Google Ads. Two names, two attribution models, two datasets, one word.
Consent banners and ad blockers take a further bite. Roughly 29.5% of internet users block ads at least sometimes according to GWI's Q2 2025 data, and Google's Consent Mode fills part of the resulting hole with modelled estimates rather than observed events. Your true conversion count is higher than any tool reports.
The way out is to stop trying to make them agree. Pick one system as the number the business runs on, ideally the one closest to your actual revenue, and use each ad platform only to compare its own campaigns against each other. Tagging your links properly makes that comparison possible; the broader question of why analytics tools disagree applies to visitor counts as much as conversions.
The practical takeaway
Name one macro conversion and two or three micro conversions leading to it, then write down what each is measured against so nobody has to guess in six months. Segment by traffic source before you draw any conclusion from a change. Glance at the benchmarks once to check you're not off by a factor of ten, then ignore them and compare yourself to last month, which is the only comparison where the definitions are guaranteed to match. And set it all up before the campaign rather than after — analytics can't tell you about the week before it was installed.