Know where you stand
against the best.
Compare your MRR, churn, NRR and growth rates against peer SaaS companies at your stage. Spot gaps, set realistic targets and build investor-ready narratives backed by real data.
Every metric that matters, with context.
MRR & ARR benchmarks
See how your recurring revenue growth stacks up against companies at the same ARR stage.
Churn rate comparison
Compare gross and net churn by segment, pricing model and annual contract mix.
NRR & GRR percentiles
Find out if your net retention is in the top quartile for your vertical and ACV band.
LTV:CAC & payback
Benchmark unit economics against B2B and B2B2C SaaS norms at your scale.
Active account growth
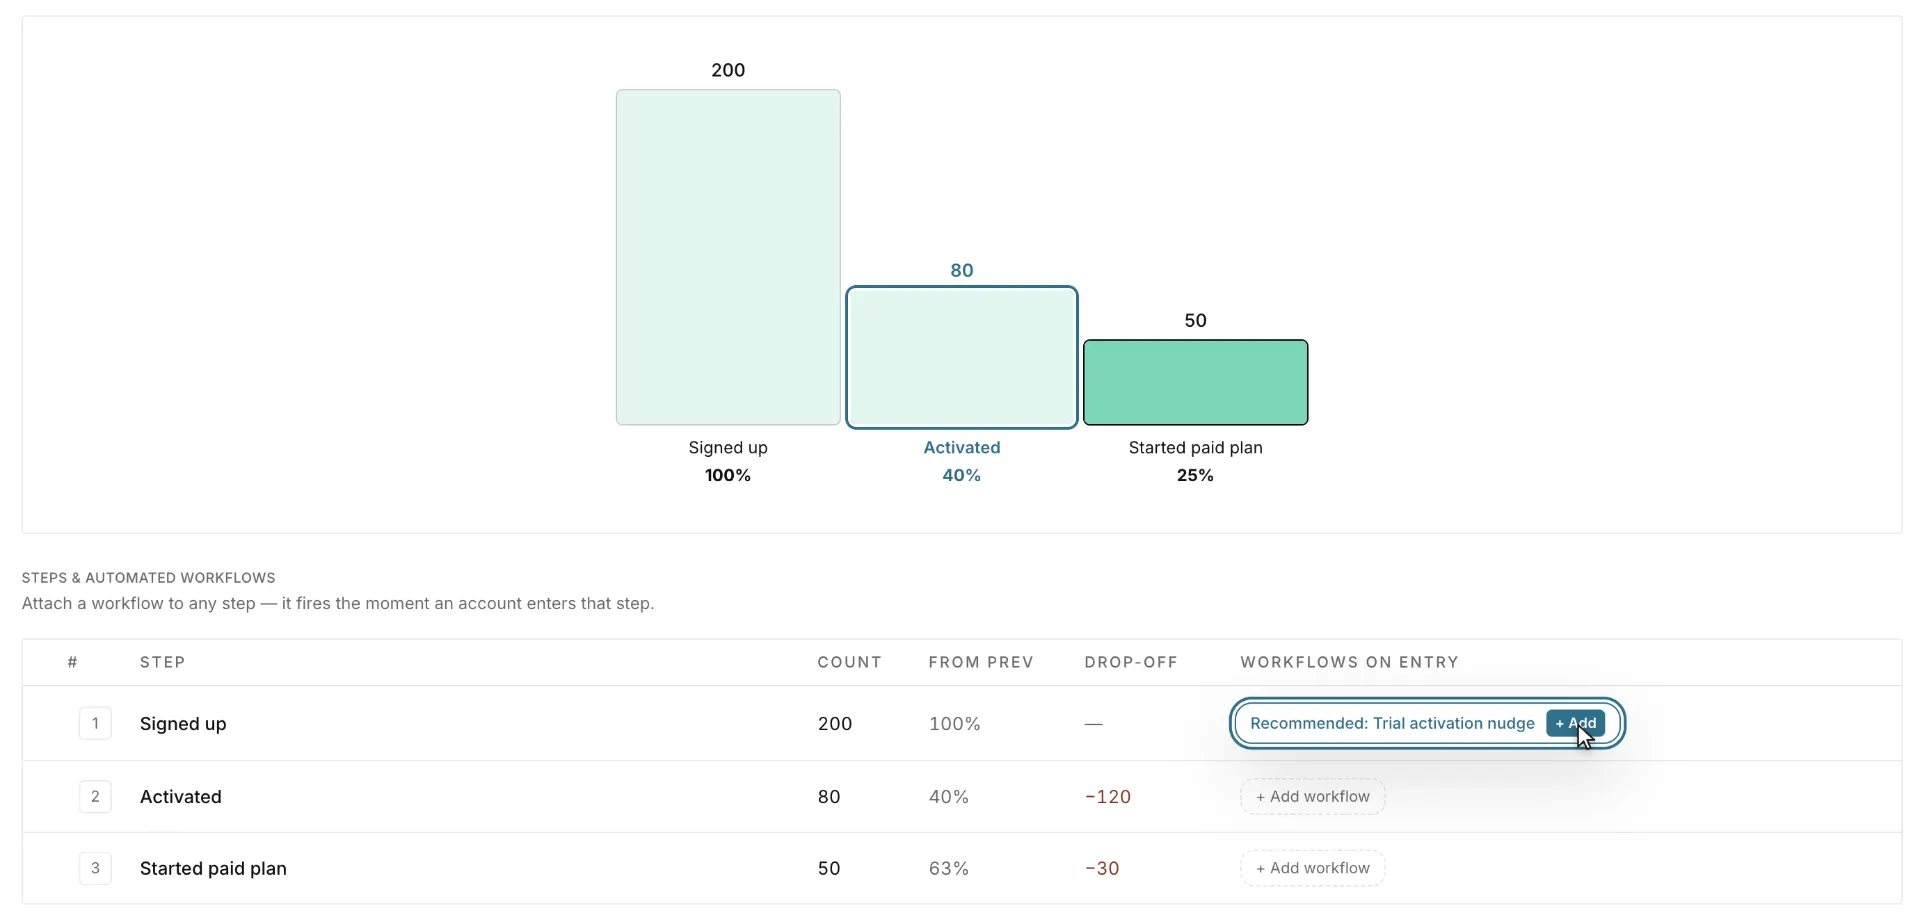
Track signup-to-active conversion and expansion velocity vs. peers.
Quarterly trend reports
See how benchmarks shift over time so you can adapt targets as the market evolves.
Where does the data come from?
Bigdelta aggregates anonymised metrics from thousands of connected SaaS companies. Every benchmark is segmented by ARR band, vertical, go-to-market motion and pricing model so comparisons are meaningful.
- Segmented by ARR stage — $0-$120K, $120K-$1M, $1M-$5M, $5M-$20M, $20M+.
- Filtered by vertical — B2B SaaS, API-first, vertical SaaS, B2B2C and more.
- Updated quarterly — benchmarks refresh as new data flows in.
Turn benchmarks into a growth plan.
Gap analysis
Identify the two or three metrics where you're furthest behind peers and focus there first.
Investor-ready reports
Export benchmark charts and narratives for board decks, fundraising and internal reviews.
Trusted by your team
One source of truth for founders, finance and investors — no more conflicting numbers.
Questions about benchmarking.
How is my data kept private?
All benchmark data is aggregated and anonymised. We never share individual company metrics externally. Your data contributes to percentiles, not identifiable reports.
What ARR bands do you support?
We segment benchmarks into $0-$120K, $120K-$1M, $1M-$5M, $5M-$20M and $20M+ bands. You can toggle between them to see how targets shift as you scale.
How often do benchmarks update?
Core benchmarks refresh quarterly as new billing and product data flows in. High-frequency metrics like MRR growth update monthly.
Can I share benchmarks with my board?
Yes. Export charts and narratives as PDFs or share secure links. Board members see benchmarks without accessing your raw data.
Do I need a certain size to use benchmarks?
No. Even pre-revenue and early-stage companies benefit from knowing what 'good' looks like at the next stage. Start tracking early to build the right habits.
Know where you stand.
Free forever under $120K ARR. Connect your billing data and see how your metrics compare in minutes.
Start free