Average session duration is lying to you
The last page of every visit contributes zero seconds, bounces drag the average toward nothing, and whether the clock keeps running while a tab sits in the background depends on which tool you ask. Here's how the number is actually computed, why it fell when you switched to GA4, and what to look at instead.
The short answer
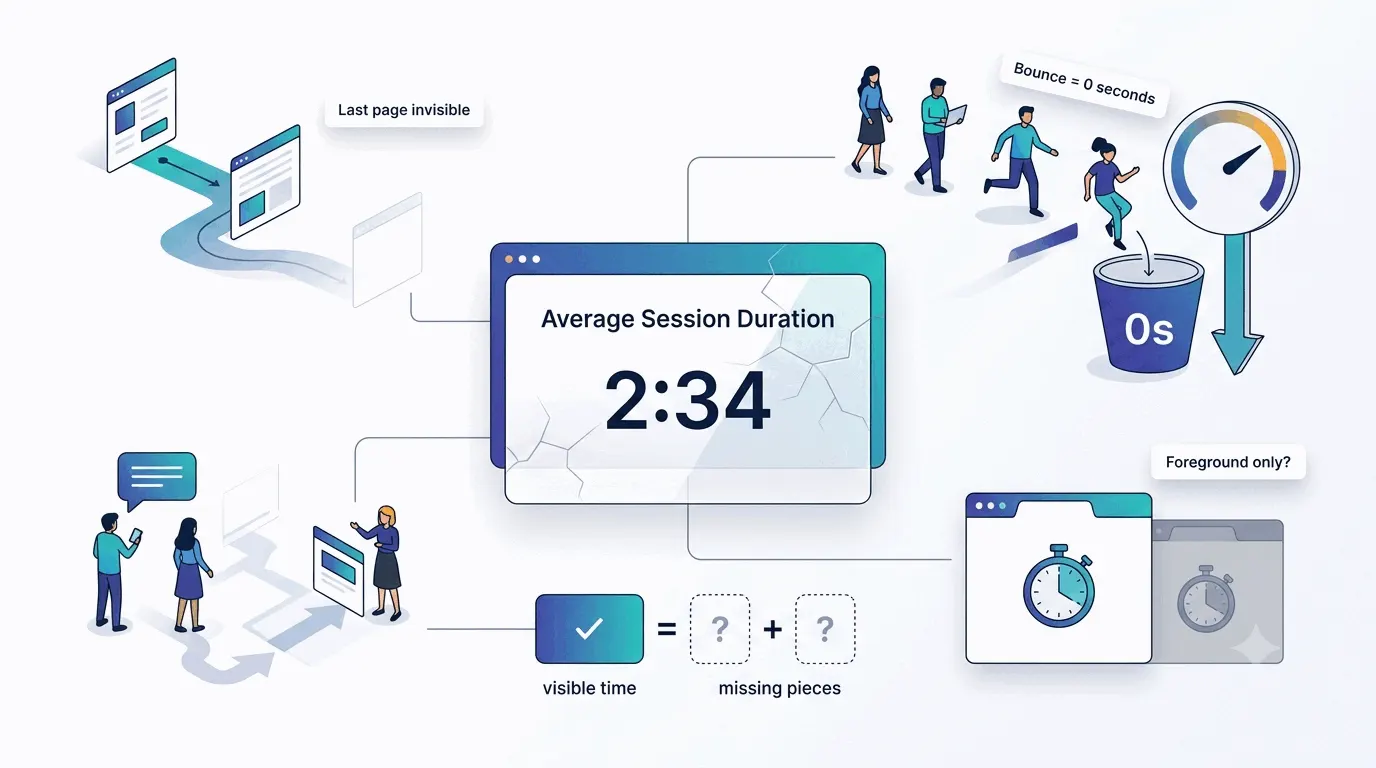
Average session duration is the most confidently wrong number on an analytics dashboard. The classic calculation — timestamp of the last interaction minus timestamp of the first — can't see the final page of any visit, because nothing comes after it to subtract from. A bounce, where the first page is the final page, therefore lasts exactly zero seconds, and on a site where half the visits bounce, half the sessions contribute nothing to the average. Meanwhile the tools disagree about the clock itself: Universal Analytics kept counting while a tab sat forgotten in the background; GA4 and Plausible count only time the page is actually in the foreground.
So the number is a blend of real reading time, invisible last pages, fictional zero-second visits, and idle tabs — mixed in proportions that depend on the tool. It's not useless, but it doesn't mean what it sounds like it means.
The last page counts for nothing
The mechanics are worth two minutes, because they explain most of the weirdness. Universal Analytics measured time on a page as the gap between successive pageviews: Page A at 2:00, Page B at 2:05, so Page A took five minutes. But the visit's last page has no next pageview, so its time is unknowable — recorded as zero. Session duration inherits the flaw: it runs from the first interaction to the last, and everything after that final click is invisible. A visitor who spends twenty minutes reading your best article and closes the tab registers those twenty minutes nowhere. Matomo's time-on-page works the same way, though it offers an opt-in heartbeat timer that pings every few seconds precisely to fix this.
The bounce case is the flaw at full volume. In a single-page visit the entry page is the exit page, so the whole session is worth 0:00 — regardless of whether the visitor left in three seconds or read for ten minutes. Now do the arithmetic for a normal site: engaged visitors averaging three minutes and a bounce rate of 50% produce a reported average of about ninety seconds. The metric halved your number before you saw it, and nothing on the dashboard says so.
The clock disagreement: idle tabs
The second problem is what counts as time at all. Universal Analytics made no distinction between a page being read and a page sitting behind six other tabs — open your article, switch to email, come back in ten minutes, and all ten minutes counted. Modern tools use the browser's Page Visibility API to notice when a tab goes to the background and stop the clock: GA4's engagement time counts only when the page is in focus, and Plausible measures the same way. Microsoft Clarity splits the difference and shows both numbers — active time and total time — which is the most honest presentation any of these tools has shipped.
Every one of these choices hides under the same innocent-looking label. Which is the real reason the metric can't be compared across tools: the tools aren't measuring the same thing and don't say so in the UI.
GA4 quietly demoted the metric
Google's own answer to all this was to stop leading with duration. GA4's standard reports show average engagement time — foreground-only, per active user — and organize everything else around the engaged session: a session that lasted 10+ seconds, or converted, or viewed a second page. Engagement rate is the share of sessions that cleared one of those bars, and it's GA4's replacement for bounce rate, inverted. (Average session duration still exists in GA4 — it's in Explorations and the reporting API — but it's no longer the number Google puts in front of you, which tells you what Google thinks of it.)
The engaged-session framing sidesteps the zero-inflation problem instead of solving it: rather than letting bounces drag an average toward nothing, GA4 counts them separately and lets you reason about them. A newsletter archive at 70% non-engaged might be perfectly healthy — people read one thing and leave happy. A store at 70% is bleeding. The framing makes that a visible question instead of a silent discount on your average.
Why one tool says 0:16 and another says 1:21
Put two tools on the same site and the gap stops being theoretical. Plausible ran exactly that test in 2025 — both scripts on one recipe site for 28 days. A page that showed 1 minute 21 seconds of time-on-page in Plausible showed 16 seconds in GA4; across the compared pages GA4 reported 54.7% less time on average.
The mechanism, not a bug on either side: both tools count only foreground time, but GA4 divides total engagement time by all sessions — including the sub-10-second ones its own engagement definition excludes — while Plausible includes bounced visits' actual time in the numerator too, so its figure runs higher. Small numerator, big denominator, deflated result. Worth noting the test is Plausible's own, run on one site — but the arithmetic it illustrates is documented on both sides, and the direction of the gap is exactly what the math predicts.
What to look at instead
Engagement rate is the sturdiest of the bunch: it dodges the last-page problem entirely (a threshold doesn't care that the final page's time is invisible) and it moves when reality moves. Climbing from 40% to 50% means more visitors are doing anything at all — that's real, and worth checking regularly.
Per-page time beats the sitewide average for actual decisions. The average blends your landing pages, your checkout, and your 404s into one number; time on this page, compared across your own pages in your own tool, tells you which content holds attention and which loses it — and when a page's number looks bad, recordings of the people on it explain why in a way no duration can.
And whatever you look at, keep it inside one tool. Duration inherits every quirk of how your tool defines the session it's measuring — where it splits, when the clock runs — so cross-tool comparisons compound two layers of definitional noise.
The practical takeaway
Treat average session duration as a trend line, never a truth. Within one tool, a number that moves means something changed — investigate. The absolute value means almost nothing: it's discounted by bounces, blind to last pages, and inflated or deflated by idle-tab policy, in proportions you can't see. Benchmarks for it are worse than useless, since published figures almost never say which of these rules produced them. If you keep one habit from this post: when the duration number surprises you, check the engagement rate and the per-page times before believing it — most surprises are the metric, not the visitors.