Replit's built-in analytics: what it tracks and where it stops
Replit ships genuinely good infrastructure telemetry with every published app — requests, uptime, CPU. The catch: a request isn't a person, and none of it says what users actually did.
What Replit actually gives you
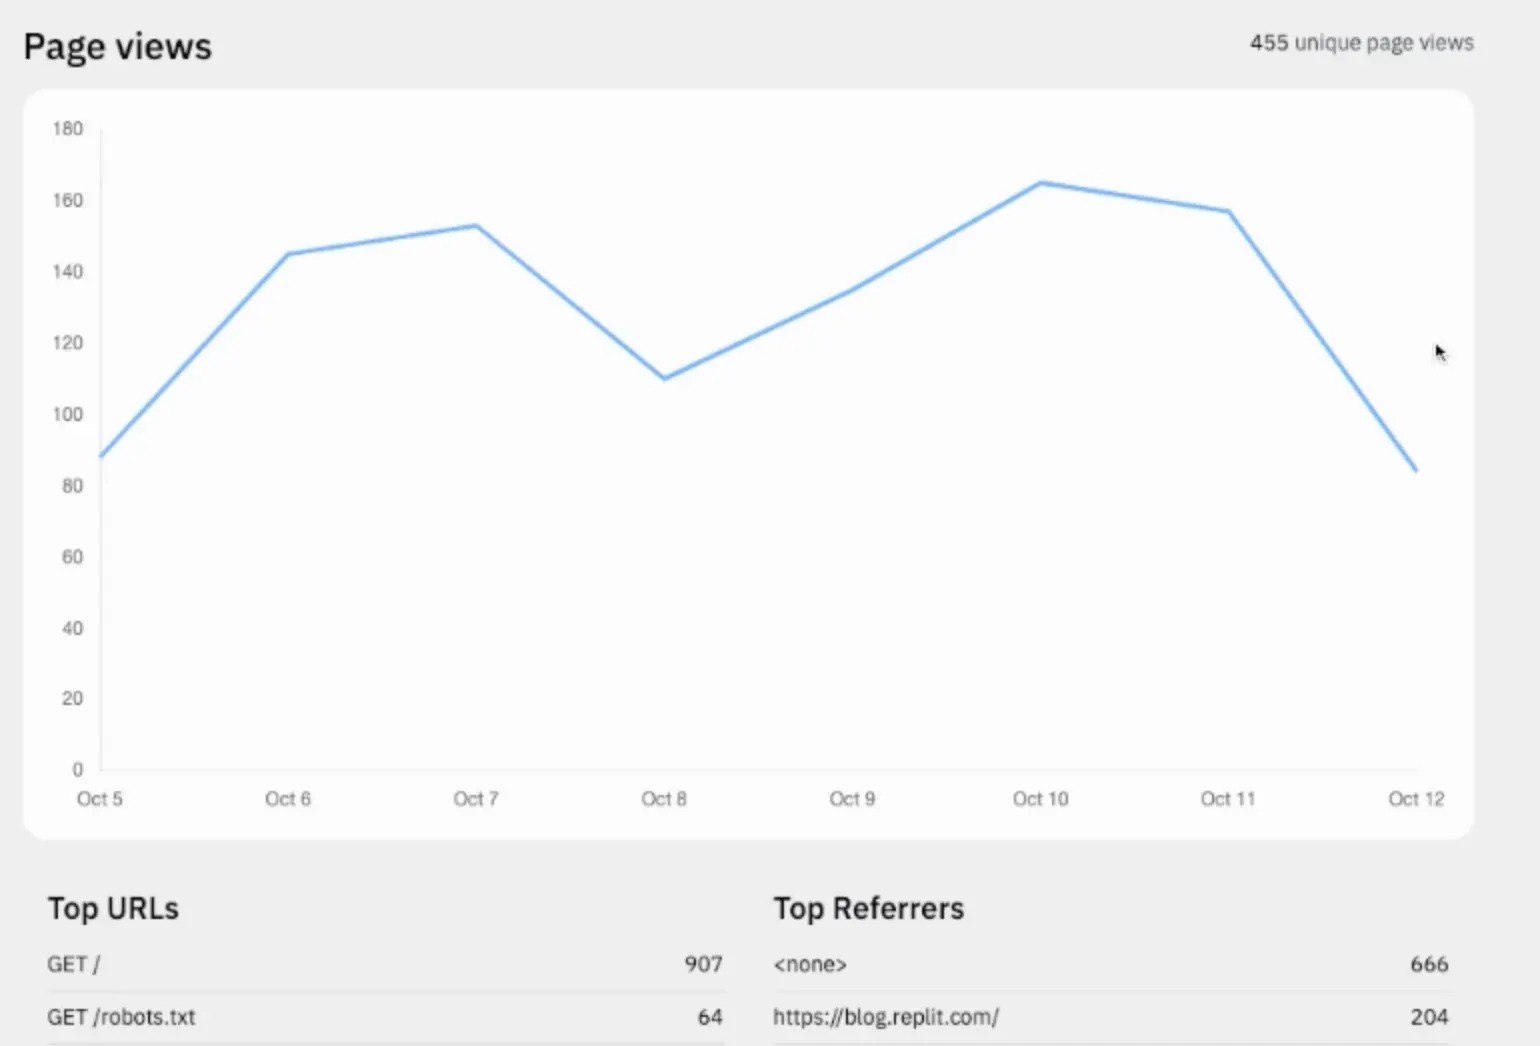
Publish an app on Replit and it starts collecting data immediately — no snippet, no configuration. The deployment analytics live in the Deployments pane: page views per hour, top URLs, top referrers, a country heatmap, browsers and devices, request durations. The Monitoring tool adds uptime, HTTP status codes, unique IPs, and CPU and memory usage.
Credit where due: as infrastructure telemetry, this is better than what most app platforms ship. When something breaks, the answer is usually right there. A wall of 404s from a single IP at 2am isn't a traffic surge, it's a vulnerability scanner sweeping for /wp-admin. A memory chart climbing all week explains the crash before anyone files a bug report. Replit built this dashboard for keeping an app alive, and at that job it's honestly good.
The trouble starts when the same dashboard gets read as visitor analytics. It isn't one, and the gap is bigger than it looks.
Page views that aren't people
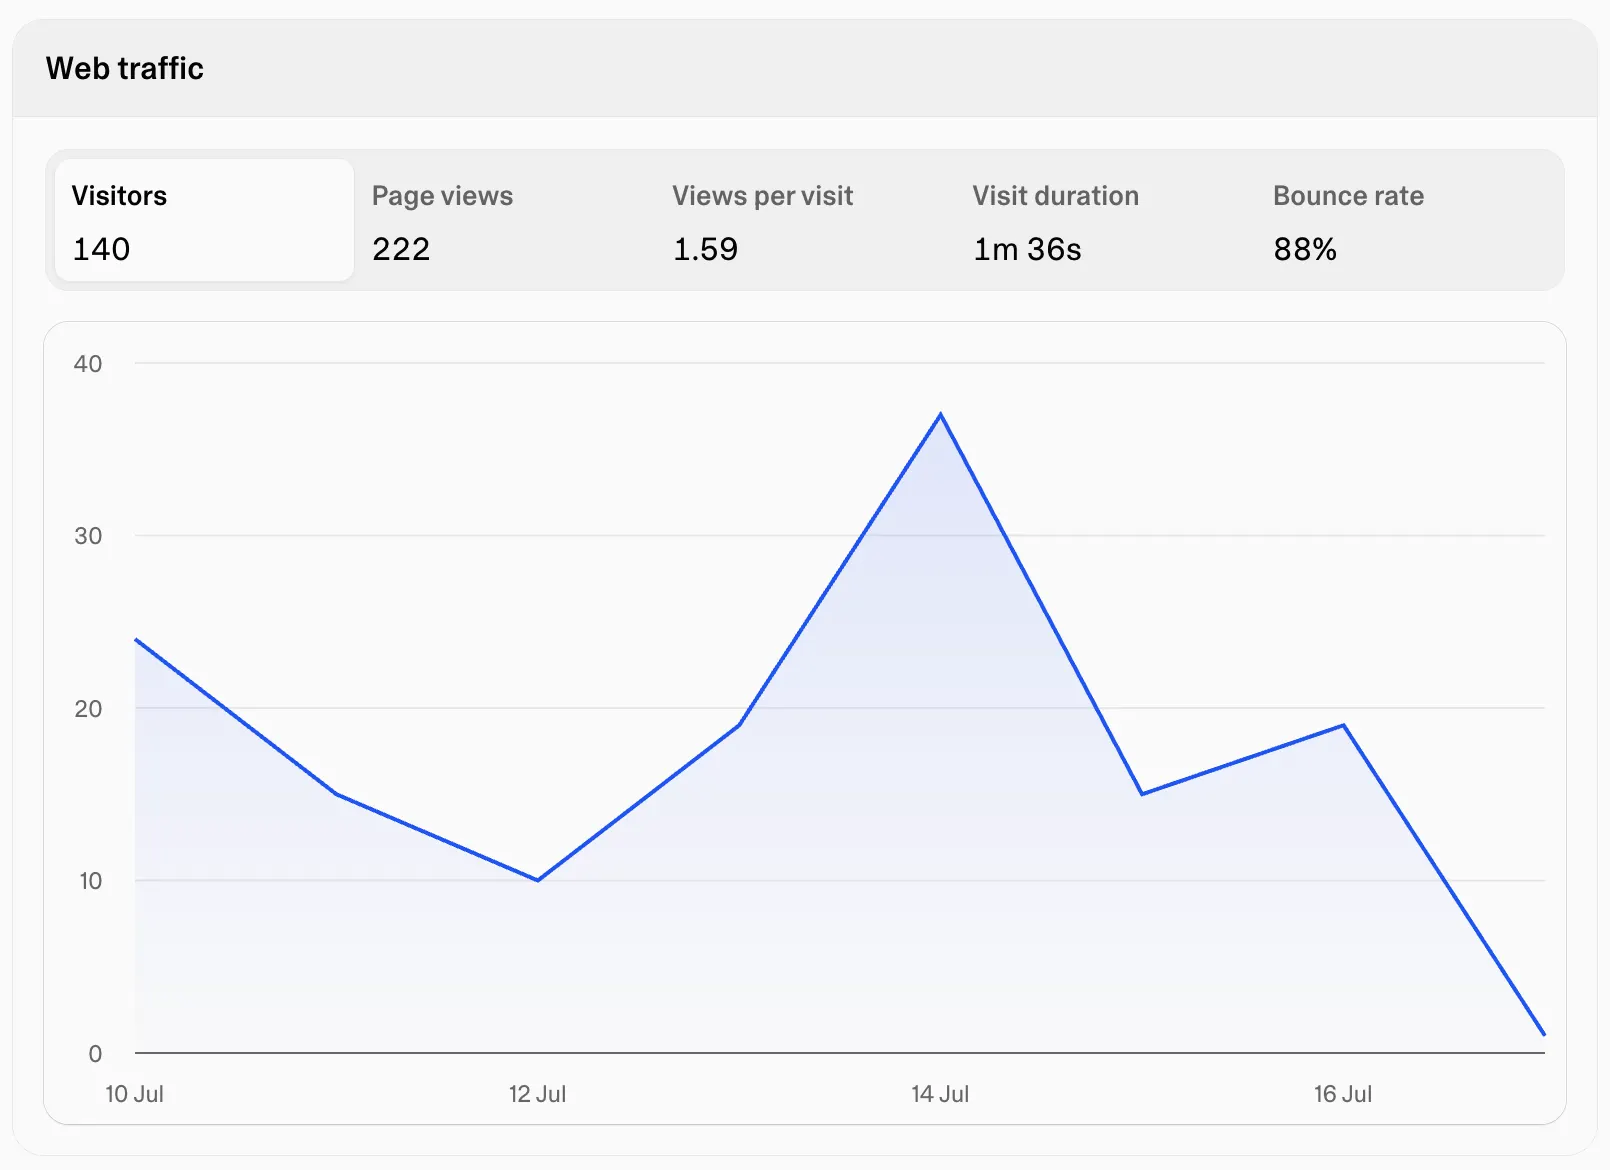
Replit counts a 'page view' as an HTTP request hitting the app. A request is not a person. An uptime checker pinging every five minutes produces 288 page views a day of nobody. Search-engine crawlers, scrapers and bot sweeps all land in the same bucket as real visitors, and there's no filter to separate them.
It undercounts in the other direction too. Most apps built with Replit Agent are single-page React apps — after the first load, navigation happens in the browser without touching the server. A visitor who opens the app, browses six screens and spends ten minutes inside registers as roughly one request plus some static assets. So the headline number is inflated by machines and deflated by engaged humans at the same time. It still shows trends, roughly. It doesn't show people.
Where it stops
Below the request level there's nothing. No events — a signup button can be clicked a hundred times a day or never, and the dashboard reads the same. No sessions or paths, so 'how many people who hit the landing page reached the form?' has no answer. No funnels, no way to replay what a confused visitor did.
Retention makes it worse: logs keep 7 days of history, so comparing this launch week against the last one means screenshots or nothing. Some capabilities are plan-gated too — uptime monitoring needs a Core plan or above. And Replit's docs currently point 'visitor and user insights' at a Growth pane, which suggests something more visitor-shaped is coming or in flux — though as of mid-2026 there's no documented feature behind that pointer, and nothing announced does events, funnels or recordings.
The GA4 detour
The standard next move is Google Analytics, and the first step is deceptively smooth: ask Agent to add the gtag snippet and it's done in a minute. What follows is less smooth. GA4 wants a property and a data stream before it wants anything else. Tracking that signup click means defining a custom event, which in practice means Google Tag Manager — a second product with a second learning curve. Fresh events take up to a day or two to reach the standard reports, so the first evening gets spent in DebugView second-guessing the setup. And the reports that eventually appear speak in 'engaged sessions' and 'key events' — vocabulary built for marketing departments with a dedicated analyst, not for one person shipping an app between other jobs.
GA4 does work. Invest a couple of weekends and it will answer nearly anything. The more common outcome, though, is a property that gets checked twice and then quietly abandoned — which measures exactly nothing.
The middle ground
The questions that actually matter a week after launch don't need GA4's machinery. Did anyone click the button. Where in the form do people quit. Are those 4,000 'page views' forty humans or one bot.
This is what Bigdelta is for. It tracks behavior, not requests: real visitors and the events, funnels and page-to-page paths behind them. When the numbers raise a question the numbers can't answer, session recordings and heatmaps take over — five replays of people stalling on the same form field beat a week of staring at request charts, and a heatmap will cheerfully reveal that nobody scrolls past the hero image. Getting it into a Replit app is one Agent prompt, about the same effort as the GA snippet — and the reports need no glossary.
The tradeoff is real, so it's worth stating: GA4 will always have more configuration depth. Projects that grow into BigQuery exports and ad-audience segmentation will eventually want that depth. Until then, the depth is mostly setup cost.
The practical takeaway
Don't turn anything off — Replit's monitoring is the right tool for uptime, errors and resource limits, and nothing here replaces it. Just don't ask it who your users are; it was never built to know. The moment a launch is planned, add behavior tracking alongside the ops dashboard, because the week the app gets its burst of attention is precisely the week request counts explain the least — and that data can't be collected retroactively.