Changelog
Sep 6, 24
Related object visualization in tables
Aug 12, 24
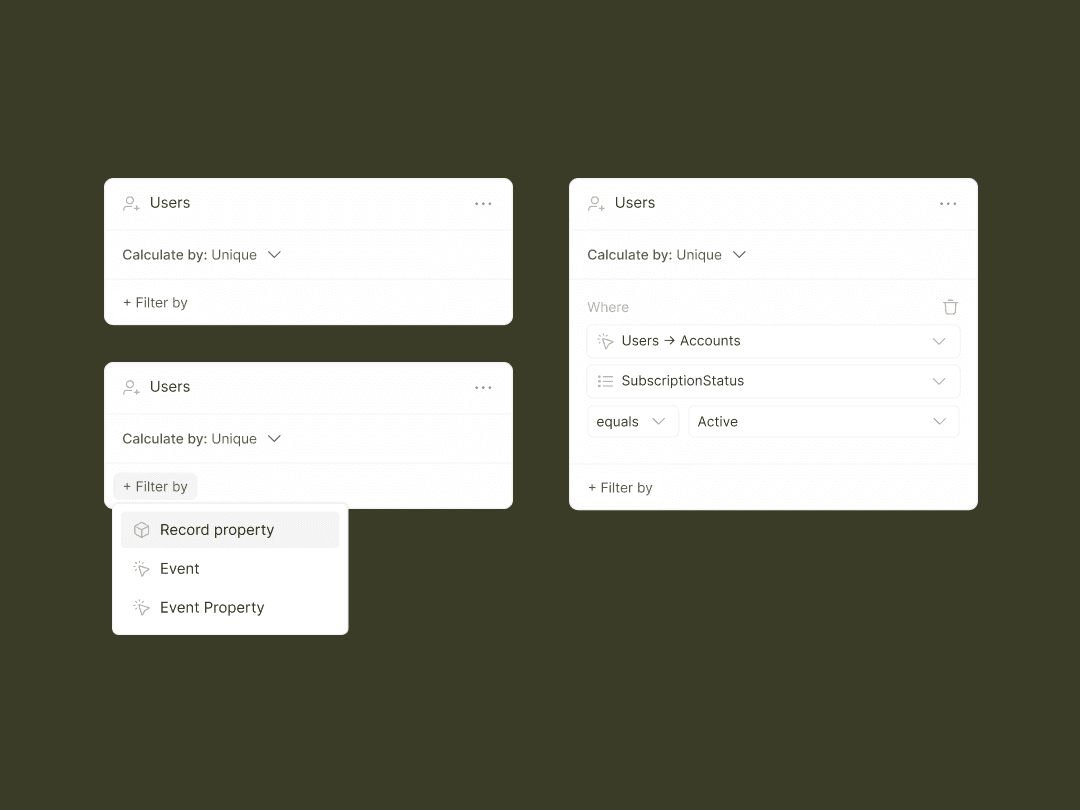
Powerful filtering options were added to record and event tables. Filter records by any property, related objects' properties, and events they performed.
Jun 6, 24
Apr 23, 24
Apr 9, 24
Mar 12, 24
We’ve added two updates to make metric management easier:
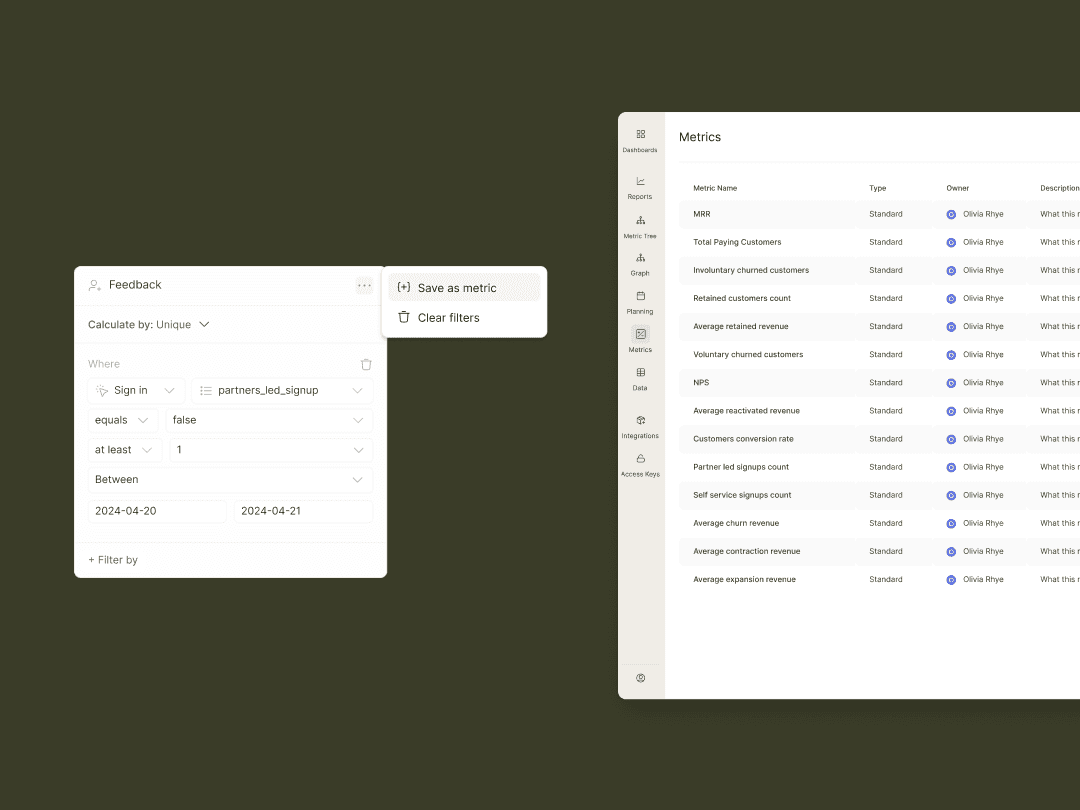
An option to save metric from the report view. Choose “Save metric” to use it in a metric graph or for future reporting needs.
Metric list. You can see all saved metrics in a separate Metrics tab.
Feb 27, 24
Feb 20, 24
Feb 13, 24
You can now filter reports using records’ properties. Not only can you use any of the properties from the record’s profile but you can also use any of the properties from the related records’ profiles.
Let’s say, you want to calculate only the users from the accounts that have paid subscription. You can build a report for users but filter it using accounts’ properties.
Jan 30, 24
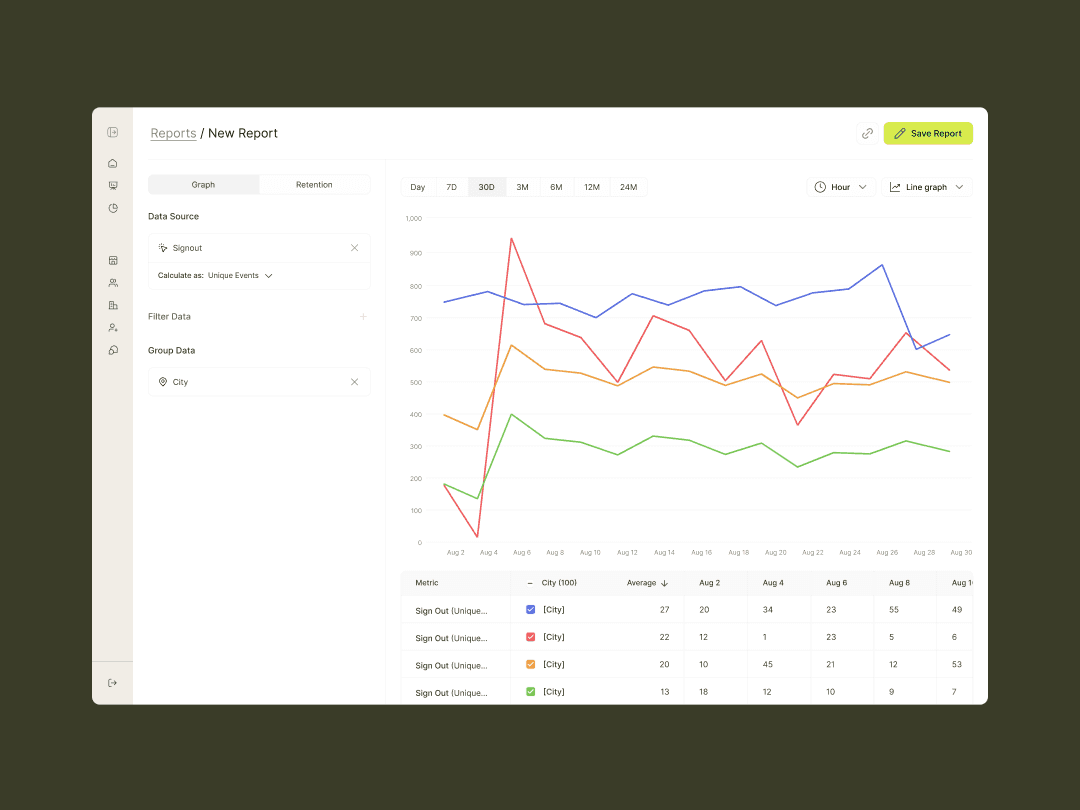
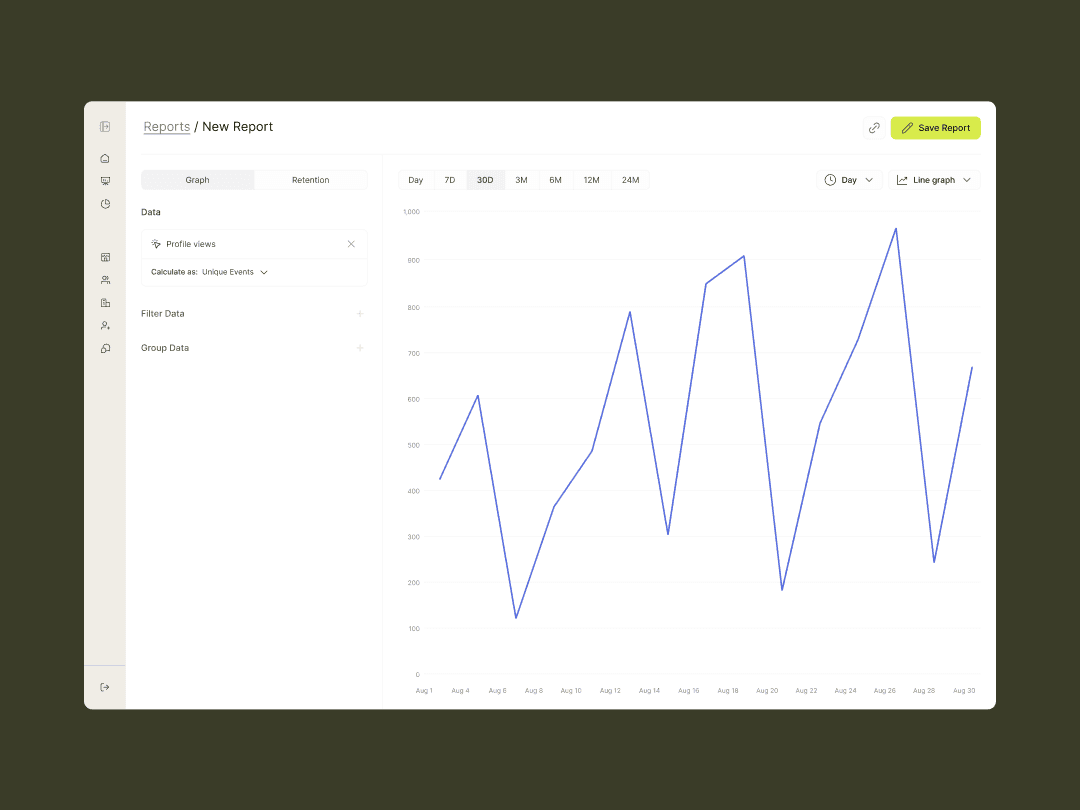
We’ve added an option to build and view reports for any of the records or events in your workspace. Reports support all standard and custom records and any events associated with these records.
